Prediction of Influenza B Vaccine Effectiveness from Sequence Data
Abstract
Influenza is a contagious respiratory illness that causes significant human morbidity and mortality, affecting 5-15% of the population in a typical epidemic season. Human influenza epidemics are caused by types A and B, with roughly 25% of human cases due to influenza B. Influenza B is a single-stranded RNA virus with a high mutation rate, and both prior immune history and vaccination put significant pressure on the virus to evolve. Due to the high rate of viral evolution, the influenza B vaccine component of the annual influenza vaccine is updated, roughly every other year in recent years. To predict when an update to the vaccine is needed, an estimate of expected vaccine effectiveness against a range of viral strains is required. We here introduce a method to measure antigenic distance between the influenza B vaccine and circulating viral strains. The measure correlates well with effectiveness of the influenza B component of the annual vaccine in humans between 1979 and 2014. We discuss how this measure of antigenic distance may be used in the context of annual influenza vaccine design and prediction of vaccine effectiveness.
keywords:
influenza B, antigenic distance,1 Introduction
Influenza is a highly contagious respiratory illness that infects all ages. It occurs seasonally worldwide, causing substantial morbidity and mortality [1]. In humans, influenza A/H3N1, A/H1N1, and B are the main causative agents. In each influenza season, influenza A generally spreads widely. Influenza B tends to be regionally dominant, causing seasonal epidemics every 2–4 years [2, 3]. The major molecular factors of influenza accessible to the immune system are hemagglutinin and neuraminidase. Entry into host cells requires hemagglutinin, which is also the main target of neutralizing antibodies [4, 5]. To protect against influenza infections, the World Health Organization (WHO) recommends the trivalent seasonal influenza vaccine, which includes the two main influenza type A strains, H1N1 and H3N2, and an influenza B strain from the Yamagata or Victoria lineages [6]. Hemagglutinin undergoes antigenic drift because of selective pressure, and this drift reduces vaccine effectiveness.
Influenza B virus is less prevalent than influenza A, and the morbidity and mortality associated with influenza B are often perceived to be lower than those caused by influenza A. Nonetheless, influenza B has attracted researchers’ attention in recent years. An early modeling study with a two-tiered phylodynamic model for influenza B compared the evolution of A/H3N2, A/H3N8, and B [7]. In some recent studies, influenza A and B infections resulted in similar morbidity and mortality in hospitalized adults [8], and also caused similar clinical characteristics in outpatients [9]. These results indicate that influenza B virus can cause infections as severe as those caused by influenza A.
Influenza B is comprised of two distinct evolutionary lineages: B/Yamagata/16/88-like and B/Victoria/2/87-like. These two lineages have co-circulated since the 1980s [10, 11]. The lineage that predominates can change yearly. In the USA, there were 5 changes of the predominant lineage in the 10 seasons between 2001 and 2010 [12], often resulting in a mismatch between the vaccine strain and the dominant circulating strain. There is limited to no protection of a vaccine for one lineage against a viral strain from the other lineage. Moreover, the protection of a vaccine for one lineage against viruses within that same lineage is not uniform, as it depends on the antigenic distance between the vaccine and virus. Compared to influenza A, there are relatively few studies of the relation between antigenic distance and vaccine effectiveness for influenza B.
We here introduce a method to estimate antigenic distance between the influenza B vaccine and circulating viral strains. Epitope regions were mapped from a standard influenza A/H3N2 virus. Additional amino acid sites that exhibited high entropy in influenza B sequences sampled from the human population were added to the epitope regions. Note that while the binding of a specific antibody in a specific individual against a specific antigen is typically dominated by 5–6 contacting amino acid residues in the antigen, here we consider typical regions of antibody binding among a distribution of antibodies and a distribution of people and against a mixture of antigens within a given influenza B strain. This is the reason for the rather large size of the generalized epitopes A-E in the hemagglutinin protein considered here. We here define an estimate of antigenic distance between the vaccine strain and the dominant circulating strain as , the fraction of amino acid site substitutions between the vaccine and circulating virus lineage in the dominant epitope region of HA1 [13]. We will show that this measure of antigenic distance correlates well with effectiveness of the influenza B component of the annual vaccine between 1979 and 2014.
To additionally detect the emergence of new influenza strains in the human population, we built a dimensionally reduced space using the multidimensional scaling method. This reduced space allowed for the visualization of the evolution of influenza B. In this representation, the emergence of new vaccine strain clusters is apparent. In particular, clades appear in this representation at antigenic distances sufficiently far from current dominating strains that immune recognition is ineffective.
This study provides a method to estimate influenza B antigenic distance and vaccine effectiveness. The measure of antigenic distance introduced here, which provides a novel tool for prediction of vaccine effectiveness in influenza B, may be used in the context of annual influenza vaccine design.
2 Methods
2.1 Sequence Data
Influenza B hemagglutinin protein sequences from human hosts in all regions were downloaded from the Influenza Virus Database of the National Center for Biotechnology Information (NCBI) [14]. Data were collected for the years 1979 to 2014. Only data containing the entire HA1 sequence were used.
2.2 Vaccine Strain and Circulating Strain
For each season, and for each epidemiological study, we determined the relevant vaccine strain and the relevant dominant circulating strain. For those studies that specified the vaccine strain used and the dominant circulating strain observed, we used those sequences. For the studies conducted in the USA that did not specify the strains, we used the vaccine strain and dominant circulating strain identified in the Center for Diseases Control and Prevention (CDC) ”Morbidity and Mortality Weekly Report”. For the remaining studies, we used the vaccine strain and dominant circulating strain identified in the annual WHO reports on ”recommendations on the composition of influenza virus vaccines.” We note that the vaccine and dominant circulating strains changed from year to year and from Northern to Southern Hemisphere studies.
2.3 Sequence Alignment
In each season, and in each epidemiological study, we determined whether the vaccine strain was a Yamagata or Victoria lineage strain. To do this, we first determined the lineage to which the vaccine strain belonged from the WHO report [6]. If the report was inconclusive, we used the lineage assigned by the Influenza Virus Database. If the database was inconclusive as well, typically only for the sequences from early years, we used the phylogenetic tree calculated by the maximum likelihood method of MEGA 6.06 [15] to determine the lineage to which a strain belonged. For each lineage, we used a standard crystal structure of HA1 to align the strains. For the Yamagata-like lineage, we used B/Yamanashi/166/1998 (PBD ID: 4M44). For the Victoria-like lineage, we used B/Brisbane/60/2008 (PBD ID: 4FQM). All protein sequences from a given Northern or Southern Hemisphere influenza season were aligned to the sequence determined by this procedure. The sequences were numbered with reference to these standards, with the first amino acid site of each model amino acid site 1. The Victoria sequence is one amino acid longer than the Yamagata model, and multi-sequence alignment using PRANK [16] showed a gap at amino acid site 163 in the Yamagata model.
The crystal structures of the two models are similar, with average root mean square deviation between them of 0.3671 Å.There are six missing amino acid sites in the crystal structure of 4FQM and three missing amino acid sites in the structure of 4M44. These amino acid sites are in the tail region. They are far away from the epitope region and are not included in root mean square deviation calculations.
2.4 Epitope Mapping
We here mapped the epitopes of both Yamagata-like and Victoria-like influenza B virus from the 5 epitopes of the H3 subtype of influenza A virus [17, 18, 19, 20, 13, 21, 22] using PRANK, which allows for gaps in the alignment and takes evolutionary distances into account [16]. We note that various modifications of these epitopes have been proposed, which range from relatively minor additions of amino acid sites [23], to dramatic reassignments [24]. The latter is discussed in our previous study [25], and we note here that measures of antigenic distance based upon it correlate less well with A/H3N2 vaccine effectiveness in humans than do those based upon the original epitope definition.
We used the sequence and numbering of A/California/7/2004 for the reference, as in the H1N1 mapping studies [21, 22]. If an epitope amino acid site in A/California/7/2004 aligned to a gap in the influenza B model, that epitope amino acid site was deleted in the influenza B model. If an epitope amino acid site in A/California/7/2004 aligned to multiple amino acid sites in the influenza B model, because of a gap in A/California/7/2004 adjacent to the epitope amino acid site, then further analysis was undertaken. The amino acid site before the gap and all the amino acid sites in the gap in the influenza B model were considered as potential epitope amino acid sites. The amino acid sites with the highest seasonal entropy, as described more fully in the Supplemental Information, were selected as the final epitope amino acid sites. Numbers of sequences per year are shown in Table S1.
2.5 Antigenic Distance between the Vaccine Strain and the Dominant Circulating Strain
The antigenic distance between the vaccine strain and the dominant circulating strain was measured by , the fraction of amino acids in the dominant epitope region of HA1 that differ between the vaccine and circulating strain [13]. We additionally considered several alternative definitions of antigenic distance. The first is , the fraction of amino acid substitutions in the entire set of all five epitope regions. The second is , the fraction of amino acid substitutions in the entire HA1 sequence. The third is , introduced in this study, which is the fraction of amino acid substitutions in the two epitopes with the highest individual amino acid substitution fractions. The model, Yamagata or Victoria, used in these calculations was that of the lineage to which the vaccine strain belongs for the influenza season under consideration. If there was a lineage mismatch when the vaccine strain was Victoria, the gap to which amino acid site 163 mapped was considered as a amino acid site substitution. If there was a lineage mismatch when the vaccine strain was Yamagata, amino acid site 163 of the dominant strain, which mapped to a gap on the vaccine, was excluded from the substitution computation.
2.6 Estimation of Vaccine Effectiveness
Vaccine effectiveness data were collected from the epidemiological literature. Data were collected from mostly healthy adults, typically aged 18–65. Epidemiological studies of influenza B are less common than those of influenza A, so studies with ideal experimental design are fewer in number. In roughly half of the studies used here, there was a minority of subjects in the range of 13% to 30% with conditions such as pregnancy, cardiovascular disease, diabetes, or body mass index of 40 kg/m2 or greater. Interestingly, in all studies, the fraction of subjects testing positive for influenza B was higher in the subjects without comorbidity than in the subjects with comorbidity. All data on infections are from laboratory-confirmed samples, e.g. by RT-PCR or the HI test. Studies focusing on elderly people and children were excluded to avoid noise caused by the response of an immature immune system in children or the immunosenescence phenomenon in elder people. Only studies that used an inactivated vaccine, such as trivalent inactivated vaccine (TIV), were considered, to decrease bias caused by differences of vaccine type. The epidemiological data were grouped by season. For each study, the vaccine effectiveness was calculated from [13]
| (1) |
where is the rate at which unvaccinated people are infected with influenza, and is the rate at which vaccinated people are infected with influenza, with and , where the total number of vaccinated subjects is , the total number of unvaccinated subjects is , the number of influenza B cases among the vaccinated subjects is , and the number of influenza B cases among the unvaccinated subjects is . Binomial statistics were assumed to calculate the error bars for the estimated effectiveness [13]: , where and . For seasons that contained studies, we used the average of the effectiveness values, and the standard error was where is the standard error of the th study.
2.7 Sequence Clustering Analysis
To gain a geometric understanding of historical influenza B evolution, we clustered the Influenza Virus Database HA1 sequences from the years 1960 to 2014. The multidimensional scaling method was used to reduce the sequences from 348 amino acid dimensions to the 3 or 4 dimensions that best reproduce the Hamming distances between all sequences [26]. Details of this dimensional reduction are provided in the Supplemental Information.
3 Results
3.1 Epitope Determination
The composition of the five epitope regions in the Victoria and Yamagata models were determined (Table 1). Note that amino acid site 163 in the Victoria model (B/Brisbane/60/2008) corresponds to a gap in the Yamagata model (B/Yamanashi/166/1998). Thus, amino acid site number , , in the Victoria model corresponds to amino acid site number in the Yamagata model. In this table, the six amino acid sites that were added to the epitope by the entropy criterion are shown in red. Additionally, the eight amino acid sites that were added to the epitope by both the entropy criterion and RSA are shown in red as well as in bold style. In epitopes A, B, and D there are two added high-entropy surface amino acid sites each. In epitope C and E, there is one amino acid site added to each epitope region.
In the Victoria model, there are 22 amino acids in epitope A, 25 in epitope B, 23 in epitope C, 40 in epitope D and 25 in epitope E. In the Yamagata model, epitope sizes of A, C, D, and E are the same as in the Victoria model, while epitope B is 24 amino acids due to the gap.
3.2 Lineage Model Chosen
The main difference between the Victoria and Yamagata lineages is the gap of amino acid site 163 (Victoria numbering). This gap cannot be ignored because it is on epitope B, while the nearby amino acid sites 160 to 165 are also on epitope B. We used the methods described in Section 2.5 to estimate the vaccine effectiveness from several sequence-based measures of antigenic distance. When the vaccine lineage is Yamagata, amino acid site 163 (Victoria numbering) is eliminated from the antigenic distance calculation.
3.3 Vaccine Effectiveness Correlates with Antigenic Distance
The influenza B vaccine effectiveness values calculated by Eq. 1 from epidemiological studies are listed in Table Acknowledgments. This table also presents the antigenic distances calculated from the epitopes defined above between the vaccine strain and the dominant circulating strain. Three additional measures of distance are also listed: , , and . Figure Acknowledgments represents how vaccine effectiveness declines with antigenic distance. A linear least squares fit shows that .
From this equation, the antigenic distance at which vaccine effectiveness declines to zero is . Using the size of each epitope and the frequency with which each epitope is dominant from Table Acknowledgments, we calculated the average number of amino acid substitutions to which this value of corresponds (see Table S3), 19 for the metric. The number of substitutions at which the expected vaccine effectiveness declines to zero according to the linear least squares fits for the other three measures of antigenic distance are also displayed in this table.
A further sensitivity analysis was performed, limiting the data to laboratory genetically confirmed samples, such as by RT-PCR. There were 19 out of 25 data points meeting this requirement. The linear least squares fit using only those data is , and . This result is quite similar to that of Figure Acknowledgmentsa, thus demonstrating limited sensitivity to such a data restriction. Since RT-PCR was lacking mostly in the early years, 1979-1988, and a relatively small fraction of the population was vaccinated in those years, the bias stemming from HI is expected to be relatively small.
3.4 Dynamics of Influenza B Evolution
Multidimensional scaling was used to reduce the dimensions to the three most informative dimensions. Figure Acknowledgmentsa shows the evolution of influenza B from 1960 to 2013. Numbers of sequences per year are shown in Table S2. The left cluster and older points belong to the Victoria lineage, and the two clusters on the right are from the Yamagata lineage. This Figure illustrates that the influenza B strain split into the two Victoria and Yamagata lineages in the 1980s, both of which started to co-circulate from that time. Figure Acknowledgmentsa also suggests that the initial Yamagata lineage from the 1980s gave way to a distinct daughter lineage around 2000. Note that the third dimension is necessary to resolve this splitting of the Yamagata lineage. Analysis of the phylogenetic tree is consistent with the clustering result shown in Figs. Acknowledgments and Acknowledgments.
Because of the small difference in the eigenvalue associated with the third dimension and the fourth dimension, we also reduced the dimensions to a 4D space. Figure Acknowledgmentsb shows the evolution, while the color coding represents the fourth dimension. This Figure shows that the Yamagata strain jumped out and back in the fourth dimension in the late 90s.
Two contour graphs were obtained from the Gaussian kernel density estimation. The results are shown in Figure Acknowledgments. Figure Acknowledgmentsa is the - axis projection, and Figure Acknowledgmentsb is the - projection. Several representative influenza B sequences are indicated. From Figure Acknowledgments, we can measure the distance between peaks, the evident clusters in density estimation. We measured the average distance between the major cluster transitions, shown as the dark lines in Figure Acknowledgments. The average number of substitutions is approximately 12. We also measured the full width at half maximum for the major clusters. We find a width of approximately 6 substitutions. The corresponding peak-peak distance and cluster width for H3N2 are 6 and 3 amino acids, respectively. [27]
3.5 Distribution of Epitopes and High-Entropy Residues
Figure 1a reveals the HA1 domain of influenza B (PDB ID:4FQM). This structure is for the Victoria-like lineage. The structure for the Yamagata-like lineage is visually indistinguishable. The five epitopes are represented as five space-filling regions with distinct colors. The epitope amino acid sites are on the surface of HA1. Figure 1b shows the 8 amino acid sites added to the epitope region because of both high seasonal-average entropy and large RSA. These additional amino acid sites are color coded according to the five epitopes, as in Figure 1a. Figure S2 shows the average seasonal entropy of each amino acid in sequence of the HA1 domain. Each amino acid site is color coded according to the five epitopes.
3.6 Dispersed Dominant Epitope in Each Season
The dominant epitope varies by season. Table S4 describes the fractional change of each epitope in each season, sorted according to magnitude. By definition, the first column is . Epitope B was most frequently dominant (7 seasons), although A was also quite frequently dominant (6 seasons). Epitope C always had the least fractional change. The next most dominant epitope also varies by seasons: it could be A, B, D, or E. Note that the dominant and next most dominant epitopes could have similar fractional changes in amino acids, such as in 2012-2013 (b) and 2011-2012 (b).
3.7 Evolution of Influenza B
In this study, we used dimensional reduction to characterize the evolution of influenza B. Phylogenetic trees are consistent with these results. We constructed a neighbor joining tree and a maximum likelihood tree based on the same sequence set for which we performed dimensional reduction. In these trees the Yamagata lineages and Victoria lineages are divided into two branches in the tree, originating from sequences obtained in the 1980s. These trees are very dense, however, and are hard to use to distinguish distances between clusters. Thus, we provide a simplified phylogenetic tree in Figure S1. We can see the Yamagata and Victoria branches in Figure S1. The distances among each cluster and sub-cluster in the dimensionally reduced space are clearer than what the trees can provide. The dimensionally reduced space is an optimal representation of relative distances, unlike the phylogenetic trees that are constrained to a tree topology.
We further analyzed the distance among peaks in our Gaussian kernel density estimation. Based on Figure Acknowledgments, the average distance between major peaks in the same lineage is approximately 12 amino acid sites. In this analysis, peaks in Victoria lineage and peaks in Yamagata lineage were measured separately. Influenza B strains in the early years belonged to the Victoria lineage and then separated to two lineages in the 1980s. There is a small transitional peak in between these two lineage clusters The distance between these two lineages is approximately twice the average distance of 12 amino acid sites.
4 Discussion
4.1 Antigenic Distance at which Vaccine Effectiveness is Zero
The number of substitutions at which vaccine effectiveness is predicted to decline to zero is shown in Table S3. For the estimate, vaccine effectiveness decays to zero at roughly 19 substitutions. This result of the estimate is the closest to the average distance observed between the evolving strain clusters in the dimensional reduction analysis, 12 amino acid sites. Thus, we chose as our metric for antigenic distance. In a previous study of H3 in influenza A [27], the average distance between consecutive H3 clusters was 6 amino acid sites, and the average substitution number when vaccine effectiveness decreases to zero was approximately 4. It appears influenza clusters emerge at just enough distance to evade prior immunity, whether induced by prior infection or vaccination in the human population.
4.2 Lower Selective Pressure Compared to Influenza A
Influenza A has high selection pressure, high mutant rate, and distinct dominant epitopes in each season [21, 22, 25]. Influenza A is generally more common than influenza B. Influenza B can, however, predominate in certain regions in each influenza season [6, 28]. Since influenza A is widely predominant, it may be under more selective pressure to evolve. The influenza A vaccine commonly contains one lineage from A/H1N1 and one from A/H3N2 [6]. These vaccines cause antibodies bind to the virus in a specific manner and stimulate the evolution of the dominant epitope. Vaccine and prior immune history are likely the reasons for the distinct dominant epitopes in influenza A.
Unlike influenza A, the dominant epitopes of influenza B are not clear, and the high-entropy amino acid sites are dispersed. These results indicate that selective pressure of influenza B may be more dispersed on the protein surface. For certain regions of the influenza B epitopes, the selective pressure may relatively be low, and antibody binding may be in a more random pattern. These results explain why in some seasons, the second most dominant epitope often has a similar fraction of amino acid substitutions as the dominant epitope.
5 Conclusion
In this paper we have considered how influenza B vaccine effectiveness depends on antigenic distance. We have defined a measure of antigenic distance for influenza B, . This measure is defined as the fraction of amino acid site substitutions between the vaccine and circulating virus lineage in the dominant epitope region of HA1 [13]. This measure correlates well with influenza B vaccine effectiveness in humans. We find that new, emergent strains of influenza B tend to occur at large values of , for which immune recognition will be minimal. In other words, influenza B evolves to escape immune recognition due to prior infection or vaccination in the human population.
This measure of antigenic distance provides a novel tool for prediction of vaccine effectiveness and may be used in the context of annual influenza vaccine design. The dimensional reduction technique illustrated here can be used to identify incipient dominant strains. In conjunction with other available data, such as ferret animal data, the measure can be used to estimate whether a new vaccine strain will be required, by measuring the antigenic distance between the existing vaccine strain and the incipient strain. The measure applies to both the Victoria and Yamagata lineages. The measure of antigenic distance may be used, again in conjunction with other available data, to select which vaccine strain in each lineage would be predicted to be most protective against the distribution of predicted or observed circulating viral strains. It is also possible to perform this prediction on a geographically localized scale, predicting vaccines optimal for different parts of the world. The measure of antigenic distance may also be used to select among egg-viable, “like” strains for those predicted to be most antigenically similar to the desired vaccine strain. These capabilities complement existing analysis of sequence and animal model datasets.
Acknowledgments
Competing Financial Interests Authors declare no competing financial interests.
Correspondence Correspondence should be addressed to MWD (mwdeem@rice.edu).
| Epitope | Residue | |
|---|---|---|
| A | 121 122 123 125 126 134 135 136 137 139 141 142 144 | |
| 146 147 148 149 150 151 155 157 177 | ||
| B | 127 129 133 160 161 162 163 164 165 166 168 172 174 | |
| 196 197 198 199 200 202 203 204 206 207 208 209 | ||
| Victoria model | C | 34 35 36 37 38 39 40 289 291 292 293 294 309 315 |
| 317 318 320 321 323 324 325 326 327 | ||
| D | 93 101 102 116 120 176 179 180 182 183 184 185 186 | |
| 187 188 190 212 214 218 219 220 223 224 225 226 | ||
| 227 228 229 230 233 242 243 244 245 246 254 255 | ||
| 256 257 258 | ||
| E | 42 44 48 56 58 59 63 71 73 75 77 78 79 80 83 84 85 | |
| 88 89 91 108 273 276 277 280 | ||
| A | 121 122 123 125 126 134 135 136 137 139 141 142 144 | |
| 146 147 148 149 150 151 155 157 176 | ||
| B | 127 129 133 160 161 162 163 164 165 167 171 173 195 | |
| 196 197 198 199 201 202 203 205 206 207 208 | ||
| Yamagata model | C | 34 35 36 37 38 39 40 288 290 291 292 293 308 314 |
| 316 317 319 320 322 323 324 325 326 | ||
| D | 93 101 102 116 120 175 178 179 181 182 183 184 185 | |
| 186 187 189 211 213 217 218 219 222 223 224 | ||
| 225 226 227 228 229 232 241 242 243 244 245 253 254 | ||
| 255 256 257 | ||
| E | 42 44 48 56 58 59 63 71 73 75 77 78 79 80 83 84 85 | |
| 88 89 91 108 272 275 276 279 |
Residues in epitopes A, B, C, D, and E of influenza B. The results for both the Victoria model (B/Brisbane/60/2008 numbering) and the Yamagata model (B/Yamanashi/166/1998 numbering) are shown. The six amino acid sites that were added to the epitope by the entropy criterion are shown in red. The eight amino acid sites that were added to the epitope by both the entropy criterion and relative accessible surface area (RSA) are shown in red bold.
Vaccine strains, dominant circulating strains, vaccine effectiveness, and antigenic distances Season Vaccine Dominant VE Dominant Strain Strain Epitope 2012-2013 (a) B/Wisconsin/1/2010[Y] (AET22022) B/Wisconsin/1/2010[Y] (AET22022) 0.619 [29, 30] 0.047 - 0 0 0 0 0 1 2012-2013 (b) B/Wisconsin/1/2010[Y] (AET22022) B/Massachusetts/2/2012[Y] (AGL06036) 0.518 [31, 32] 0.084 B 0.083 0.082 0.052 0.014 2[33] 2 2012-2013 (c) B/Wisconsin/1/2010[Y] (AET22022) B/Brisbane/60/2008[V] (ACN29380) 0.569 [30] 0.086 A 0.364 0.348 0.201 0.095 5.68[34, 35] 55.16 2011-2012 (a) B/Brisbane/60/2008[V] (ACN29380) B/Bangladesh/3333/2007[Y] (AFH58304) 0.460 [36] 0.322 B 0.400 0.383 0.215 0.101 6[37, 38] 64 2011-2012 (b) B/Brisbane/60/2008[V] (ACN29380) B/Wisconsin/01/2010[Y] (AET22022) 0.170 [39] 0.172 A 0.364 0.362 0.207 0.098 5.85[34, 35] 55.16 2011-2012 (c) B/Brisbane/60/2008[V] (ACN29380) B/Brisbane/60/2008[V] (ACN29380) 0.799 [40, 39] 0.110 - 0 0 0 0 0 1 2011 B/Brisbane/60/2008[V] (ACN29380) B/Brisbane/60/2008[V] (ACN29380) 0.728 [41, 42] 0.241 - 0 0 0 0 0 1 2010 B/Brisbane/60/2008[V] (ACN29380) B/Brisbane/60/2008[V] (ACN29380) 0.710 [41] 0.146 - 0 0 0 0 0 1 2008-2009 B/Florida/04/2006[Y] (ACA33493) B/Brisbane/60/2008[V] (ACN29380) 0.507 [43] 0.213 A 0.364 0.348 0.209 0.098 8.50[37, 38] 109.26 2008 B/Florida/04/2006[Y] (ACA33493) B/Florida/04/2006[Y] (ACA33493) 0.662 [44, 42] 0.261 - 0 0 0 0 0 1 2007-2008 B/Malaysia/2506/2004[V] (ACF54235) B/Florida/04/2006[Y] (ACA33493) 0.400 [45, 46, 47] 0.377 B 0.400 0.383 0.222 0.104[48] 5 32 2006-2007 B/Malaysia/2506/2004[V] (ACF54235) B/Shanghai/361/2002[Y] (CAH04474) 0.160 [49] 0.394 A 0.364 0.362 0.200 0.095 4[48] 32 2005-2006 (a) B/Shanghai/361/2002[Y] (CAH04474) B/Malaysia/2506/2004[V] (ACF54235) 0.281 [50] 0.333 A 0.364 0.348 0.194 0.092 6[48] 32 2005-2006 (b) B/Jiangsu/10/2003[Y] (ACF54191) B/Hong Kong/330/2001[V] (AAT69436) 0.216 [51] 0.267 A 0.455 0.413 0.224 0.104 7[52, 53] 122.51 1987-1988 B/Ann Arbor/1/86[V] (AAB16995) B/Victoria/2/87[V] (P22092) 0.458 [54] 0.217 B 0.120 0.092 0.052 0.023 2[55] 2 1985-1986 B/USSR/100/83[V] (P09766) B/Ann Arbor/1/86[V] (ABF21280) 0.562 [54] 0.096 B 0.280 0.185 0.111 0.058 0[55] 2 1983-1984 B/Singapore/222/79[V] (P03463) B/USSR/100/83[V] (P09766) 0.656 [54] 0.130 B 0.120 0.062 0.030 0.017 2[28] 2.83 1979-1980 B/Hong Kong/5/72[V] (ABF21280) B/Singapore/222/79[V] (P03463) 0.528 [56] 0.205 B 0.120 0.106 0.052 0.029 2[57] 2.45
Identities and accession numbers of vaccine strain and dominant circulating strain, with corresponding experimental vaccine effectiveness and standard error. The values of , , , , and ferret HI and data are listed. Whether the strain is Victoria [V] or Yamagata [Y] is indicated. Vaccine effectiveness is taken from epidemiological studies cited for each influenza season, and antigenic distances are predicted by the method. Most of these data are obtained from the Northern Hemisphere (seasons in “year1-year2” format). Three seasons from Southern Hemisphere (2011, 2010, 2008) are also listed.
Vaccine effectiveness declines with antigenic distances
a) ![[Uncaptioned image]](/html/1610.03915/assets/x1.png) b)
b) ![[Uncaptioned image]](/html/1610.03915/assets/x2.png)
c) ![[Uncaptioned image]](/html/1610.03915/assets/x3.png) d)
d) ![[Uncaptioned image]](/html/1610.03915/assets/x4.png) e)
e) ![[Uncaptioned image]](/html/1610.03915/assets/x5.png)
Measures of antigenic distance. Correlation of vaccine effectiveness in humans with a) , b) two standard distances extracted from ferret animal model data [13, 22], c) , d) , and e) . Linear least squares fit of each chart are : , ; : , ; : , ; : , ; : , ; and : , .
3D and 4D Dimensional reduction results
![[Uncaptioned image]](/html/1610.03915/assets/x6.png)
Dimensional reduction of all influenza B HA1 sequences from Homo sapiens, obtained from Influenza Virus Database of NCBI [14]. Data were collected from year 1960 to 2014. Unit of axes are inverse length of HA1 sequence, 348 amino acids. a) 3D dimensional reduction. Also highlighted are 18 representative influenza B strains. The format of lineage names is {strain}/{sequence-number}/{collection-date}. The collection years are indicated by the color bar. b) 4D Dimensional reduction. The fourth dimension in the 4D figure is indicated by the color bar.
Contour map
![[Uncaptioned image]](/html/1610.03915/assets/x7.png)
The a) - and b) - projection of contour maps of sequence clustering. The 18 representative lineages shown in Figure Acknowledgments are labeled. Measured distances between the major cluster transitions are shown as solid lines.
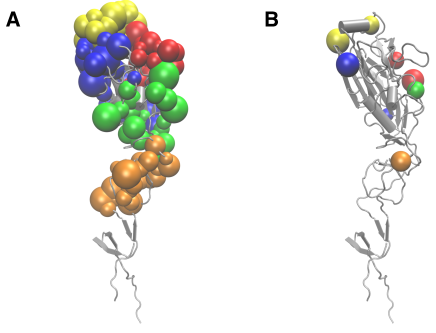
a: Three dimensional structure of influenza B, HA1 domain (Victoria lineage, model 4FQM) with five epitopes. Epitopes are shown in space filling representation with different colors corresponding to the five epitopes: epitope A (red), epitope B (yellow), epitope C (orange), epitope D (blue), epitope E (green), and non-epitope region (silver). b: Three dimensional structure of influenza B, HA1 domain (Victoria lineage) with the 8 high-entropy amino acid sites newly added to the epitope region: amino acid site 122 and 126 to epitope A, 166 and 209 to epitope B, 40 to epitope C, 233 and 255 to epitope D, and 73 to epitope E. Here the Victoria numbering is used.
References
References
- [1] C. B. Bridges, S. A. Harper, K. Fukuda, T. M. Uyeki, N. J. Cox, J. A. Singleton, Prevention and control of influenza. Recommendations of the Advisory Committee on Immunization Practices (ACIP), MMWR. Recommendations and reports: Morbidity and Mortality Weekly Report. Recommendations and reports/Centers for Disease Control 52 (RR-8) (2003) 1–34.
- [2] W. W. Thompson, D. K. Shay, E. Weintraub, L. Brammer, N. Cox, L. J. Anderson, K. Fukuda, Mortality associated with influenza and respiratory syncytial virus in the United States, JAMA 289 (2) (2003) 179–186.
- [3] R. B. Belshe, The need for quadrivalent vaccine against seasonal influenza, Vaccine 28 (2010) D45–D53.
- [4] G. Ada, P. Jones, The immune response to influenza infection, Springer, 1986.
- [5] J. J. Skehel, D. C. Wiley, Receptor binding and membrane fusion in virus entry: the influenza hemagglutinin, Annual Review of Biochemistry 69 (1) (2000) 531–569.
- [6] World Health Organization, WHO recommendations on the composition of influenza virus vaccines, http://www.who.int/influenza/vaccines/virus/recommendations/en/.
- [7] L. K, P. Khatri, M. Kamdadt, T. B. Kepler, A two-tiered model for simulating the ecological and evolutionary dynamics of rapidly evolving viruses, with an application to influenza, J. Roy. Soc. Inter. 7 (2010) 1257–1274.
- [8] S. Su, S. Chaves, A. Perez, T. D’Mello, P. Kirley, K. Yousey-Hindes, M. Farley, M. Harris, R. Sharangpani, R. Lynfield, et al., Comparing clinical characteristics between hospitalized adults with laboratory-confirmed influenza A and B virus infection., Clinical Infectious Diseases: an official publication of the Infectious Diseases Society of America 59 (2) (2014) 252.
- [9] S. A. Irving, D. C. Patel, B. A. Kieke, J. G. Donahue, M. F. Vandermause, D. K. Shay, E. A. Belongia, Comparison of clinical features and outcomes of medically attended influenza A and influenza B in a defined population over four seasons: 2004–2005 through 2007–2008, Influenza and other Respiratory viruses 6 (1) (2012) 37–43.
- [10] P. A. Rota, T. R. Wallis, M. W. Harmon, J. S. Rota, A. P. Kendal, K. Nerome, Cocirculation of two distinct evolutionary lineages of influenza type B virus since 1983, Virology 175 (1) (1990) 59–68.
- [11] J. A. McCullers, T. Saito, A. R. Iverson, Multiple genotypes of influenza B virus circulated between 1979 and 2003, Journal of Virology 78 (23) (2004) 12817–12828.
- [12] R. Dolin, The quadrivalent approach to influenza vaccination, Journal of Infectious Diseases (2013) jit264.
- [13] V. Gupta, D. J. Earl, M. W. Deem, Quantifying influenza vaccine efficacy and antigenic distance, Vaccine 24 (18) (2006) 3881–3888.
- [14] Y. Bao, P. Bolotov, D. Dernovoy, B. Kiryutin, L. Zaslavsky, T. Tatusova, J. Ostell, D. Lipman, The influenza virus resource at the National Center for Biotechnology Information, Journal of Virology 82 (2) (2008) 596–601.
- [15] K. Tamura, G. Stecher, D. Peterson, A. Filipski, S. Kumar, Mega6: molecular evolutionary genetics analysis version 6.0, Molecular Biology and Evolution 30 (12) (2013) 2725–2729.
- [16] A. Löytynoja, N. Goldman, webPRANK: A phylogeny-aware multiple sequence aligner with interactive alignment browser, BMC Bioinformatics 11 (1) (2010) 579.
- [17] I. A. Wilson, N. J. Cox, Structural basis of immune recognition of influenza virus hemagglutinin, Annual Review of Immunology 8 (1) (1990) 737–787.
- [18] I. A. Wilson, J. J. Skehel, D. C. Wiley, Structure of the haemagglutinin membrane glycoprotein of influenza virus at 3 Å resolution, Nature 289 (5796) (1981) 366–373.
- [19] G. M. Air, M. C. Els, L. E. Brown, W. G. Laver, R. G. Webster, Location of antigenic sites on the three-dimensional structure of the influenza N2 virus neuraminidase, Virology 145 (1985) 237–248.
- [20] C. Macken, H. Lu, J. Goodman, L. Boykin, The value of a database in surveillance and vaccine selection, in: International Congress Series, Vol. 1219, Elsevier, 2001, pp. 103–106.
- [21] M. W. Deem, K. Pan, The epitope regions of H1-subtype influenza A, with application to vaccine efficacy, Protein Engineering Design and Selection 22 (9) (2009) 543–546.
- [22] K. Pan, K. C. Subieta, M. W. Deem, A novel sequence-based antigenic distance measure for H1N1, with application to vaccine effectiveness and the selection of vaccine strains, Protein Engineering Design and Selection 24 (3) (2011) 291–299.
- [23] K. Pan, M. W. Deem, Quantifying selection and diversity in viruses by entropy methods, with application to the hemagglutinin of H3N2 influenza, J. R. Soc. Interface 7 (2011) 1644–1653.
- [24] A. G. Meyer, C. O. Wilke, Geometric constraints dominate the antigenic evolution of influenza H3N2 hemagglutinin, PLoS Pathogens 11 (2015) e1004940.
- [25] L. Xi, M. W. Deem, Influenza evolution and H3N2 vaccine effectiveness, with application to the 2014/2015 season arXiv:1510.00488.
- [26] J. C. Gower, Multivariate analysis and multidimensional geometry, Journal of the Royal Statistical Society. Series D (The Statistician) 17 (1).
- [27] J. He, M. W. Deem, Low-dimensional clustering detects incipient dominant influenza strain clusters, Protein Engineering, Design & Selection 23 (12) (2010) 935–946.
- [28] A. J. Hay, V. Gregory, A. R. Douglas, Y. P. Lin, The evolution of human influenza viruses, Philos Trans R Soc Lond B Biol Sci 356 (1416) (2001) 1861–70.
- [29] C. for Disease Control, Interim adjusted estimates of seasonal influenza vaccine effectiveness-United States, February 2013., MMWR. Morbidity and Mortality Weekly Report 62 (7) (2013) 119.
- [30] H. Q. McLean, M. G. Thompson, M. E. Sundaram, B. A. Kieke, M. Gaglani, K. Murthy, P. A. Piedra, R. K. Zimmerman, M. P. Nowalk, J. M. Raviotta, et al., Influenza vaccine effectiveness in the United States during 2012–2013: Variable protection by age and virus type, Journal of Infectious Diseases 211 (10) (2015) 1529–1540.
- [31] J. McMenamin, N. Andrews, C. Robertson, D. Fleming, H. Durnall, B. Von Wissmann, J. Ellis, A. Lackenby, S. Cottrell, B. Smyth, et al., Effectiveness of seasonal 2012/13 vaccine in preventing laboratory-confirmed influenza infection in primary care in the United Kingdom: Mid-season analysis 2012/13, EuroSurveill 18 (5) (2013) 1–5.
- [32] E. Kissling, M. Valenciano, U. Buchholz, A. Larrauri, J. Cohen, B. Nunes, J. Rogalska, D. Pitigoi, I. Paradowska-Stankiewicz, J. Reuss, et al., Influenza vaccine effectiveness estimates in Europe in a season with three influenza type/subtypes circulating: the I-MOVE multicentre case-control study, influenza season 2012/13.
- [33] I. G. Barr, C. Russell, T. G. Besselaar, N. J. Cox, R. S. Daniels, R. Donis, O. G. Engelhardt, G. Grohmann, S. Itamura, A. Kelso, et al., WHO recommendations for the viruses used in the 2013–2014 northern hemisphere influenza vaccine: Epidemiology, antigenic and genetic characteristics of influenza A (H1N1) pdm09, A (H3N2) and B influenza viruses collected from October 2012 to January 2013, Vaccine 32 (37) (2014) 4713–4725.
- [34] Z. Ran, H. Shen, Y. Lang, E. A. Kolb, N. Turan, L. Zhu, J. Ma, B. Bawa, Q. Liu, H. Liu, et al., Domestic pigs are susceptible to infection with influenza B viruses, Journal of Virology 89 (9) (2015) 4818–4826.
- [35] Y. Lin, Y. Gu, S. A. Wharton, L. Whittaker, V. Gregory, X. Li, S. Metin, N. Cattle, R. S. Daniels, A. J. Hay, et al., Optimisation of a micro-neutralisation assay and its application in antigenic characterisation of influenza viruses, Influenza and other Respiratory Viruses 9 (6) (2015) 331–340.
- [36] J. Castilla, I. Martinez-Baz, V. Martinez-Artola, G. Reina, F. Pozo, M. Garcia Cenoz, M. Guevara, J. Moran, F. Irisarri, M. Arriazu, et al., Decline in influenza vaccine effectiveness with time after vaccination, Navarre, Spain, season 2011/12, EuroSurveill 18 (5) (2013) 20388.
- [37] I. G. Barr, J. McCauley, N. Cox, R. Daniels, O. G. Engelhardt, K. Fukuda, G. Grohmann, A. Hay, A. Kelso, A. Klimov, et al., Epidemiological, antigenic and genetic characteristics of seasonal influenza A (H1N1), A (H3N2) and B influenza viruses: basis for the WHO recommendation on the composition of influenza vaccines for use in the 2009–2010 northern hemisphere season, Vaccine 28 (5) (2010) 1156–1167.
- [38] L. K. Yves Thomas, in: Influenza virus surveillance in Switzerland, Season 2011 – 2012, National Reference Centre of Influenza, University of Geneva Hospitals.
- [39] D. M. Skowronski, N. Z. Janjua, S. Sabaiduc, G. De Serres, A.-L. Winter, J. B. Gubbay, J. A. Dickinson, K. Fonseca, H. Charest, N. Bastien, et al., Influenza A/subtype and B/lineage effectiveness estimates for the 2011–2012 trivalent vaccine: cross-season and cross-lineage protection with unchanged vaccine, The Journal of Infectious Diseases 210 (1) (2014) 126–137.
- [40] R. Pebody, N. Andrews, J. McMenamin, H. Durnall, J. Ellis, C. Thompson, C. Robertson, S. Cottrell, B. Smyth, M. Zambon, et al., Vaccine effectiveness of 2011/12 trivalent seasonal influenza vaccine in preventing laboratory-confirmed influenza in primary care in the United Kingdom: evidence of waning intra-seasonal protection, EuroSurveill 18 (5).
- [41] A. Levy, S. G. Sullivan, S. S. Tempone, K. L. Wong, A. K. Regan, G. K. Dowse, P. V. Effler, D. W. Smith, Influenza vaccine effectiveness estimates for western Australia during a period of vaccine and virus strain stability, 2010 to 2012, Vaccine 32 (47) (2014) 6312–6318.
- [42] H. A. Kelly, S. G. Sullivan, K. A. Grant, J. E. Fielding, Moderate influenza vaccine effectiveness with variable effectiveness by match between circulating and vaccine strains in Australian adults aged 20–64 years, 2007–2011, Influenza and other Respiratory Viruses 7 (5) (2013) 729–737.
- [43] P. N. Barrett, G. Berezuk, S. Fritsch, G. Aichinger, M. K. Hart, W. El-Amin, O. Kistner, H. J. Ehrlich, Efficacy, safety, and immunogenicity of a vero-cell-culture-derived trivalent influenza vaccine: a multicentre, double-blind, randomised, placebo-controlled trial, The Lancet 377 (9767) (2011) 751–759.
- [44] J. E. Fielding, K. A. Grant, G. Papadakis, H. A. Kelly, Estimation of type-and subtype-specific influenza vaccine effectiveness in Victoria, Australia using a test negative case control method, 2007-2008, BMC Infectious Diseases 11 (1) (2011) 170.
- [45] S. Frey, T. Vesikari, A. Szymczakiewicz-Multanowska, M. Lattanzi, A. Izu, N. Groth, S. Holmes, Clinical efficacy of cell culture-derived and egg-derived inactivated subunit influenza vaccines in healthy adults, Clinical Infectious Diseases 51 (9) (2010) 997–1004.
- [46] A. S. Monto, S. E. Ohmit, J. G. Petrie, E. Johnson, R. Truscon, E. Teich, J. Rotthoff, M. Boulton, J. C. Victor, Comparative efficacy of inactivated and live attenuated influenza vaccines, New England Journal of Medicine 361 (13) (2009) 1260–1267.
- [47] J. J. Treanor, H. El Sahly, J. King, I. Graham, R. Izikson, R. Kohberger, P. Patriarca, M. Cox, Protective efficacy of a trivalent recombinant hemagglutinin protein vaccine (flublok®) against influenza in healthy adults: A randomized, placebo-controlled trial, Vaccine 29 (44) (2011) 7733–7739.
- [48] N. Cox, A. Balish, L. Brammer, K. Fukuda, H. Hall, A. Klimov, S. Lindstrom, J. Mabry, G. Perez-Oronoz, A. Postema, M. Shaw, C. Smith, K. Subbarao, T. Wallis, X. Xijan, in: Information for the Vaccines and Related Biological Products Advisory Committee, CBER, FDA, WHO Collaborating Center for Surveillance Epidemiology and Control of Influenza, Centers for Disease Control, 2008.
- [49] D. M. Skowronski, G. De Serres, J. Dickinson, M. Petric, A. Mak, K. Fonseca, T. L. Kwindt, T. Chan, N. Bastien, H. Charest, et al., Component-specific effectiveness of trivalent influenza vaccine as monitored through a sentinel surveillance network in Canada, 2006–2007, Journal of Infectious Diseases 199 (2) (2009) 168–179.
- [50] D. Skowronski, C. Masaro, T. Kwindt, A. Mak, M. Petric, Y. Li, R. Sebastian, M. Chong, T. Tam, G. De Serres, Estimating vaccine effectiveness against laboratory-confirmed influenza using a sentinel physician network: Results from the 2005–2006 season of dual A and B vaccine mismatch in Canada, Vaccine 25 (15) (2007) 2842–2851.
- [51] J. Beran, V. Wertzova, K. Honegr, E. Kaliskova, M. Havlickova, J. Havlik, H. Jirincova, P. Van Belle, V. Jain, B. Innis, et al., Challenge of conducting a placebo-controlled randomized efficacy study for influenza vaccine in a season with low attack rate and a mismatched vaccine B strain: A concrete example, BMC Infectious Diseases 9 (1) (2009) 2.
- [52] World Health Organization, in: Recommended composition of influenza virus vaccines for use in the 2006 influenza season, 2006.
- [53] N. Cox, A. Balish, L. Brammer, K. Fukuda, H. Hall, A. Klimov, S. Lindstrom, J. Mabry, G. Perez-Oronoz, A. Postema, M. Shaw, C. Smith, K. Subbarao, T. Wallis, X. Xijan, in: Information for the Vaccines and Related Biological Products Advisory Committee, CBER, FDA, WHO Collaborating Center for Surveillance Epidemiology and Control of Influenza, Centers for Disease Control, 2004.
- [54] W. A. Keitel, T. R. Cate, R. B. Couch, L. L. Huggins, K. R. Hess, Efficacy of repeated annual immunization with inactivated influenza virus vaccines over a five year period, Vaccine 15 (10) (1997) 1114–1122.
- [55] C. for Disease Control, Update on influenza activity–United States and worldwide, with recommendations for influenza vaccine composition for the 1988-89 season., MMWR. Morbidity and Mortality Weekly Report 37 (15) (1988) 241.
- [56] H. M. Foy, I. Allan, J. M. Blumhagen, M. K. Cooney, C. Hall, J. P. Fox, A/USSR and B/Hong Kong vaccine: field experiences during an A/Brazil and an influenza B epidemic, JAMA 245 (17) (1981) 1736–1740.
- [57] C. for Disease Control, Antigenic analysis of influenza B viruses, MMWR. Morbidity and Mortality Weekly Report 29 (5) (1980) 58.