A Resolved Near-Infrared Image of The Inner Cavity in The GM Aur Transitional Disk111Based on IRCS and HiCIAO data collected at Subaru Telescope, operated by the National Astronomical Observatory of Japan.
Abstract
We present high-contrast -band polarized intensity (PI) images of the transitional disk around the young solar-like star GM Aur. The near-infrared direct imaging of the disk was derived by polarimetric differential imaging using the Subaru 8.2 m Telescope and HiCIAO. An angular resolution and an inner working angle of and , respectively, were obtained. We clearly resolved a large inner cavity, with a measured radius of 182 au, which is smaller than that of a submillimeter interferometric image (28 au). This discrepancy in the cavity radii at near-infrared and submillimeter wavelengths may be caused by a 3–4 planet about 20 au away from the star, near the edge of the cavity. The presence of a near-infrared inner cavity is a strong constraint on hypotheses for inner cavity formation in a transitional disk. A dust filtration mechanism has been proposed to explain the large cavity in the submillimeter image, but our results suggest that this mechanism must be combined with an additional process. We found that the PI slope of the outer disk is significantly different from the intensity slope obtained from HST/NICMOS, and this difference may indicate the grain growth process in the disk.
=1 \fullcollaborationNameThe SEEDS team
1 Introduction
The presence of circumstellar disks was predicted as an inevitable consequence of angular momentum conservation during gravitational collapse in star formation, and circumstellar disks are now considered to be the initial phase of planetary evolution. Typical disks exhibit continuous infrared excess above the stellar emission, but some disks have deficits of near- and mid-infrared excesses and show nearly photospheric emission, while having substantial excesses at the far-infrared and beyond (Strom et al., 1989). Spectral energy distribution (SED) modeling studies by the Infrared Spectrograph (IRS; Houck et al., 2004) and the (ISO; Kessler et al., 1996) suggest that a spectral dent in the near infrared can be explained as being due to optically thin inner cavities with radii of 10 au or more in optically thick disks (Calvet et al., 2005; D’Alessio et al., 2005). Such disks are referred to as transitional disks, and have become central to understanding the evolutionary transition between protoplanetary and debris disks. The inside-out disk clearing in transitional disks must occur over a very short time scale ( 10 Myr), since transitional disks only appear around young stellar objects with ages of 1–10 Myr. Also, the small frequency of transitional disks may reflect the fact that not all disks experience inner disk clearing at young ages (Muzerolle et al., 2010). However, it is not well understood which physical mechanisms drive the disk clearing process.
One promising clearing mechanism is dust filtration by outer edge of a planet-induced gap (Rice et al., 2006; Zhu et al., 2012). This mechanism was proposed to explain the dust dynamics and gas dynamics in the disk. Since the radial density and the pressure gradient of the gas are negative at the outer edge of a planet-induced gap, dust particles drift outward by gaining angular momentum from the gas. When drifting dust particles overcome the coupling with the gas, they stay at the outer edge of the gap while the gas falls into the star through the gap. This process acts like a dust filter, and it depletes the inner dust disk to the radius of the planet-induced gap, producing a dustless inner cavity. It should be noted that this mechanism is effective only if the dust particles are large enough to have significant drift velocities. Zhu et al. (2012) showed that particles larger than 0.01–0.1 mm can be filtered by a gap. Dong et al. (2012a) also suggested that the dust filtration effect is a promising mechanism for explaining why there is no sign of cavities in their near-infrared scattered light images for many objects confirmed to have large central cavities by submillimeter continuum emission. Consequently, dust filtration can explain the large-dust-depleted inner cavities seen in submillimeter observations, but cannot readily explain the small-dust-depleted inner cavities seen in near-infrared observations.
A few objects show different cavity sizes between near-infrared and submillimeter wavelengths. SAO 206462 shows a smaller cavity size at near-infrared wavelengths (28 au; Garufi et al., 2013) than at submillimeter wavelengths (39–46 au; Brown et al., 2009; Andrews et al., 2011). Mayama et al. (2012) also reported that RX J160421.7-213028 has a smaller cavity size at 1.6 m polarized intensity (PI) images (63 au) than in the 880 m continuum emission (72 au; Mathews et al., 2012). Garufi et al. (2013) proposed tidal interactions with planetary companions as an explanation for the observed diversity of cavity sizes. Different radial distributions of micron- and millimeter-size particles is thus key to investigating the dynamics of dust clearing in transitional disks. While modeling analysis based on SED is important, the spatial distribution of gas and various sizes dust in the disk must be evaluated by high-resolution direct imaging observations at multiple wavelengths to determine the physical mechanisms occurring at transitional phases.
In this paper, we present the results of the first high-contrast near-infrared (1.6 m) polarization imaging conducted on the transition disk associated with the young T Tauri star GM Aur by the Subaru 8.2 m Telescope at MaunaKea, Hawaii. GM Aur (K5, 0.84, 1–10 Myr old Simon et al., 2000; Hartmann, 2003) is located in the Taurus–Auriga molecular cloud, 140 pc away, initially revealed to have a rotating gaseous disk with an inner cavity (Koerner et al., 1993). Andrews et al. (2011), analyzing submillimeter (880 m) interferometric images, derived the presence of a large inner cavity with a radius of 28 au. However, Hornbeck et al. (2016), examining visible wavelength (0.54 m) imaging data, reported a non-detection of the cavity. Our goal is to undertake a quantitative analysis of the spatial structure including the inner cavity to discuss the different aspects of the dust distribution than those already described in previous studies on the GM Aur disk.
The High Contrast Instrument for the Subaru Next Generation Adaptive Optics (HiCIAO; Tamura et al., 2006) provides high-resolution and high-contrast images, and has resolved more of the inner side of the disk than previous near-infrared HST/NICMOS observations. The results are different from the latest submillimeter observations regarding the cavity radius, and this morphological difference at different wavelengths may be interpreted as the result of physical interactions between the disk and unseen planets.
2 OBSERVATIONS AND DATA REDUCTION
Near-infrared (1.6m) linear polarimetric differential images (PDI) of the GM Aur disk were obtained using the HiCIAO on the Subaru Telescope on the night of 2010 December 2. We used a double Wollaston prism to split the incident light into four 55″channels, two each of o- and e-ray sets (qPDI) to reduce the saturated radius under the expected inner cavity size (, 20 au at 140 pc). The imaging scale of HiCIAO in the qPDI mode is 9.5 mas per pixel. We obtained 18 data sets (four angular positions of the half-wave plate; 0°, 45°, 225 and 675 for one data set, to obtain full polarization coverage with minimal artifacts) with 8 s exposure for each frame. The total integration time was 576 s. This observation was carried out as part of the SEEDS (Strategic Explorations of Exoplanets and Disks with Subaru; Tamura et al., 2009) project.
The Image Reduction and Analysis Facility (IRAF)222The IRAF is distributed by the National Optical Astronomy Observatory, which is operated by the Association of Universities for Research in Astronomy under a cooperative agreement with the National Science Foundation. with a custom script pipeline (Hashimoto et al., 2011) was used for polarimetric data reduction in the standard manner of infrared image reduction. After bias subtraction and bad pixel correction, we obtained , , , and images from e- and o-ray images at each angular position of the half-wave plate. The PI was given by .
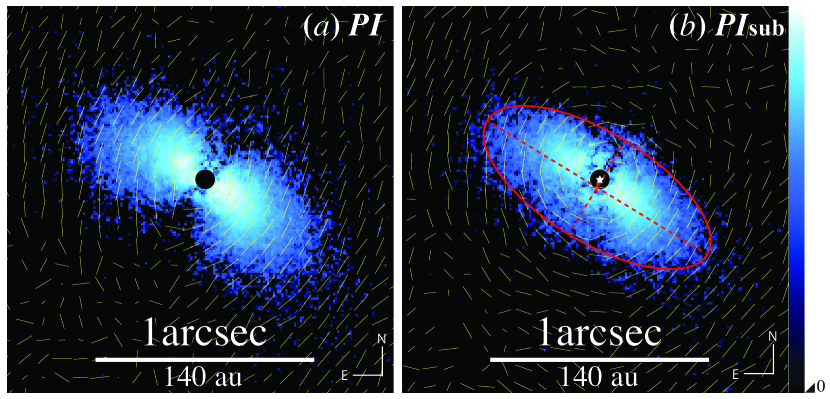
Although a disk-like structure is visible in the PI image, the polarization vectors show a tendency to align toward the minor axis of the disk (Figure 1()), not in circular symmetry, as expected from the Fresnel reflection. This is considered to be a residual stellar halo in the obtained images, because the standard reduction procedure cannot perfectly remove the convolved stellar point spread function. To obtain a more accurate disk-origin PI, we first computed the polarization halo by calculating the average polarization strength (1.270.05) and the average polarization angle (150505) from the unsaturated Stokes I, Q, and U images. By subtracting the polarization halo model from the Stokes Q and U images, we obtained the halo-subtracted Stokes parameters, and . The final halo-subtracted polarized intensity () is computed via =. Figure 1() is the resultant image with polarization vectors, which exhibit circular symmetry.
-band angular differential images (ADI; Marois et al., 2006) were also obtained using the HiCIAO with 22 minutes of exposure time on 2011 December 22, to survey the presence of planets. The ADI data reduction was conducted with the LOCI algorithm (Locally Optimized Combination of Images; Lafreniére et al., 2007). In the LOCI process, each of the initial images is divided into concentric ring subsections, and the optimized background reference is then calculated for each subsection separately based on the counterpart subsection of the other images. The individual reference image is constructed from these locally optimized data for each individual initial image. This LOCI data reduction was conducted as part of a comprehensive study on the SEEDS high-contrast imaging survey of exoplanets, and detailed parameters are described in Uyama et al. (2016).
3 RESULTS
The final H-band PI image of the GM Aur disk with a software mask (40 mas) is shown in Figure 1(). The symmetric and elliptical disk structure is resolved. We fitted elliptical isophotes on the resultant images to measure the inclinations and position angles (PAs) of the disk. The elliptical fitting results are shown in Table 1, and overlaid on the image. We found a significant offset between the disk center and the location of the central star of 38 mas at a PA of 252°, which is roughly along the minor axis. This offset indicates that the southeast side is inclined toward us (e.g., Dong et al., 2012b).
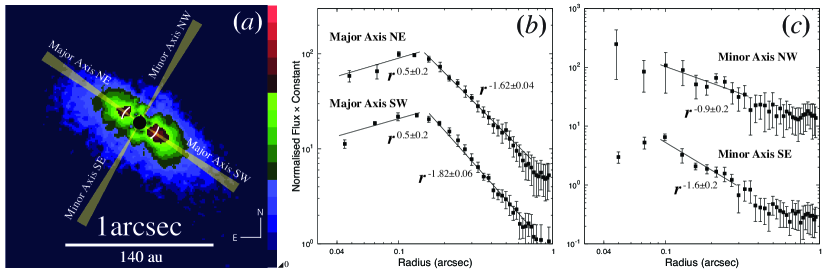
Figure 2 shows contour map image and radial PI profiles along the major and minor axes. We fitted a power law to each slope and found a clear evidence of an inner cavity with a radius of 18 au. This is the first detection of a cavity in the GM Aur disk at near-infrared wavelengths, and the cavity radius is smaller than the results of observations at submillimeter wavelengths of 28 au (Andrews et al., 2011). However, previous detailed modeling by Espaillat et al. (2010) employed an inner cavity of 20 au that is in good agreement with our result.
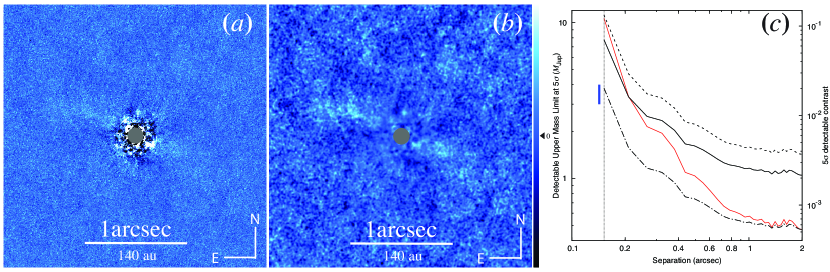
The results of ADI/LOCI analysis on GM Aur are shown in Figure 3. No significant point source is seen in the ADI/LOCI image (Figure 3()). The signal-to-noise map (Figure 3()) shows that black and white patterns around the mask in the resultant image are just speckle noises. Figure 3() shows the companion mass limit that we could detect at 5 from the resultant image. The mass was converted from the contrast by assuming the COND evolutionary model (Baraffe et al., 2003). We also took into account the self-subtraction effect of the LOCI algorithm (See Section 3 in Uyama et al., 2016). The detectable mass limit is only a few MJup; therefore, the presence of companions with the masses of typical brown dwarfs is excluded around GM Aur.
4 DISCUSSION
4.1 Different Brightness Slope: Polarization and Non-polarization
The PI profiles of the outer disk along the two major axes (Figure 2) are well fitted to a power law with power indices of 1.620.04 and 1.820.06 for the northeast and southwest axes, respectively, which indicates a flared disk surface (a flat disk is expected to have a steeper profile, e.g., Whitney & Hartmann, 1992). We found that the power indices of the minor axes, 1.6, are not consistent with those of the radial brightness intensity () profiles obtained from HST/NICMOS observations (Schneider et al., 2003), namely a power index of 3.5 for a F160W band filter. Since the wavelength difference between the HiCIAO H-band filter (1.3–1.9 m) and the NICMOS F160W band filter (1.4–1.8 m) is negligible for surface brightness comparison, the power index difference between PI and profiles indicate a change in polarization efficiency at different radii. The polarization efficiency is determined by many variables such as the composition of particle shapes and sizes, multiple scattering, and changes in scattering angle by flared surfaces (e.g., Whitney & Wolff, 2002; Perrin et al., 2009). Some of the physical parameters mentioned above increase the polarization efficiency as the radius increases. Therefore, the power index difference between PI and profiles may be a sign of various grain growth process at different radii. To obtain more robust explanation for polarization efficiency variance with radius, multi-band observations (e.g., Pérez et al., 2013) and detailed model comparison (e.g., Min et al., 2012) must be conducted.
4.2 Imaging Diagnostics: Cavity Edge Radius and Planet Mass
Recent imaging observations of disks have revealed spatial differentiation in the grain sizes in transitional disks, since observations at different wavelengths trace different grain sizes, showing different spatial structures of the disks (a missing cavity at near-infrared imaging; Dong et al., 2012a). Zhu et al. (2012) and Pinilla et al. (2012) suggested that the dust filtration effect by planet-induced cavity edges may cause dust particles at different radii to have different grain sizes. de Juan Ovelar et al. (2013) performed 2-dimensional hydrodynamical and dust evolution models combined with instrument simulations of VLT/SPHERE-ZIMPOL (0.65 m), Subaru/HiCIAO (1.6 m), and ALMA (850 m). Their results provide a simple mass estimating function using the ratio of SPHERE ZIMPOL -band cavity edge radius to ALMA Band 7 peak radius, and it allows predictions to be made for emitted/scattered light spatial images at different wavelengths for several cases of planet masses and locations.
To estimate possible planet masses in the GM Aur disk with cavity sizes at near-infrared (this work) and submillimeter wavelengths (28 au; Andrews et al., 2011), we assumed that (1) an 18 au radius cavity seen in a HiCIAO infrared polarized intensity image is induced by a planet at 20 au separation from the central star, that (2) the cavity edge radius seen in ZIMPOL can be replaced with that seen in HiCIAO, since ZIMPOL and HiCIAO polarized intensity images trace similar dust particle sizes (1–10m in general) (de Juan Ovelar et al., 2013), and (3) HiCIAIO can resolve a thin gap and an inner disk with the radius of 20 au or less (e.g., Akiyama et al., 2015). Therefore, it should be noted that this is only a rough estimation. Consequently, we obtained 3–4 as the mass of a possible planet at 20 au separation. The possible planet could not be detected in the ADI/LOCI resultant image due to a larger inner working angle and higher detectable mass limit near the central star (Figure 3()). Even if we had obtained sufficient contrast to detect the planet, the optically thick inner edge of the disk would have concealed the planet under the dust. Therefore, to reveal the planet inside the dust, an additional method may be necessary, such as direct detection of H emission from the gas accreting onto the protoplanet (e.g., LkCa 15; Sallum et al., 2015).
4.3 Origin of the Inner cavity
To explain the near-infrared deficit in SED, which is indicative of an inner cavity in the disk, a number of physical mechanisms have been suggested, such as photoevaporation, grain growth, disk wind by magnetorotational instability, and gravitational interactions between disks and planets. However, to date, none of the suggested mechanisms have clearly explained the formation of an infrared inner cavity in transitional disks, including the GM Aur disk.
Photoevaporation is a dominant mechanism when the mass accretion rate is sufficiently low. However, the high mass accretion rate of the GM Aur disk (410-9-110-8; Espaillat et al., 2007; Ingleby et al., 2015) requires a substantial supply of material from a massive outer disk (0.16; Hughes et al., 2009). Grain growth (e.g., Birnstiel et al., 2009) should proceed without reducing the gas density, but Dutrey et al. (2008) revealed the presence of a large gas cavity in the GM Aur disk from a lack of CO line emission. Furthermore, without an additional process, it cannot explain the depletion of small dust in transitional disks due to continuous replenishing of small dust via fragmentation (Birnstiel et al., 2009). Inside-out evacuation via disk wind (Chiang & Murray-Clay, 2007) cannot be reconciled with the silicate emission at 10m in the IRS spectrum of GM Aur (Calvet et al., 2005), which indicates the existence of 0.02 lunar masses of m-size dust in the inner region within 5 au (Calvet et al., 2005). We note that this faint inner disk is outside of our scope. Rosenfeld et al. (2014) proposed that radial flow of gas with near free-fall velocity can explain the dust depletion at inner cavities that survive even for a relatively high mass accretion rate from the outer disk (fast radial flows model). However, this scenario has not resolved how gas in the disk cavity efficiently shed its angular momentum. A Puffed-up inner disk can produce a cavity-like shape by self-shadowing (e.g., Garufi et al., 2014), but it is not consistent with the optically thin inner disk of GM Aur.
A dust filtration effect (Rice et al., 2006) by a planet-induced gap is the most likely mechanism to explain the inner cavity in the GM Aur transitional disk (Hughes et al., 2009). Recently, Zhu et al. (2012) found that the gap outer edge near a 6 planet can only filter particles that are 0.1 mm and larger, and proposed that the dust filtration+grain growth scenario can explain the strong near-infrared deficit in SED of the GM Aur disk. However, those scenarios commonly have difficulties explaining the lack of micron-size particles in the central region, which we have reported in this work. Therefore, although dust filtration and grain growth may play key roles in inner disk clearing, there must be an additional factor, such as the presence of multiple planets (Dong et al., 2015).
5 CONCLUSION
We have presented a spatially resolved image of the GM Aur transitional disk at near-infrared wavelengths, obtained using Subaru/HiCIAO, and have revealed a large inner cavity, which is seen for the first time at these wavelengths. The measured cavity radius of 18 au is significantly smaller than that of the latest measurement at submillimeter wavelengths of 28 au (Andrews et al., 2011). This discrepancy in cavity size may be caused by a planet embedded in the cavity, the mass of which has been estimated at 3–4 with some assumptions. We also suggested various grain growth process at different radii based on the difference between PI and radial profiles.
The physical mechanisms of a large inner cavity surrounded by a massive outer disk are still not well understood. In particular, the mechanism for clearing a near-infrared cavity in a transitional disk has not yet been determined. For a submillimeter inner cavity, a dust filtration mechanism is the most likely hypothesis. However, our discovery of a near-infrared inner cavity suggests that the dust filtration effect should be combined with an additional disk clearing processes, or that micron-size particles are not coupled well with the accreting gas for some reason. High-resolution imaging observations by ALMA will be important for verifying the dust filtration scenario by tracing the gas flow in the near-infrared cavity in the GM Aur disk.
We are grateful to the referee for providing useful comments that led to an improved version of this letter. M.T. and J.C. are supported by a Grant-in-Aid for Scientific Research (No.15H02063) and by the U.S. National Science Foundation under award#1009203, respectively.
| Parameter | Outer EdgeaaThe positions where the flux becomes noise level were obtained first from radial profiles at position angles every 10°. Then least-squares estimation elliptical fitting with five free geometric parameters was conducted using the IRAF package stsdas.analysis. | Inner EdgebbBased on the flux peaks in the radial profiles. The elliptical fitting was not available at the inner edge because the number of peak points was insufficient to fit with a small error. |
|---|---|---|
| Radius of semi-major axis (au) | ||
| Position angle of semi-major axis (°)ccCounterclockwise from the north axis. | ||
| Inclination (°)ddDerived from the ellipticity. The inclination of a face-on disk is 0°. | - | |
| Geometric center offset (mas)ee(R.A., decl.). The origin of the coordinates corresponds to the position of the central star. | (,) | (,) |
References
- Akiyama et al. (2015) Akiyama, E., Muto, T., Kusakabe, N., Kataoka, A., Hashimoto, J., Tsukagoshi, T., Kwon, J., Kudo, T., et al. 2015, ApJ, 802, L17
- Andrews et al. (2011) Andrews, S. M., Wilner, D. J., Espaillat, C., Hughes, A. M., Dullemond, C. P., McClure, M. K., Qi, C., & Brown, J. M. 2011, ApJ, 732, 42
- Baraffe et al. (2003) Baraffe, I., Chabrier, G., Barman, T. S., Allard, F., & Hauschildt, P. H. 2003, A&A, 402, 701
- Birnstiel et al. (2009) Birnstiel, T., Dullemond, C. P., & Brauer, F. 2009, A&A, 503, L5
- Brown et al. (2009) Brown, J. M., Blake, G. A., Qi, C., Dullemond, C. P., Wilner, D. J., & Williams, J. P. 2009, ApJ, 704, 496
- Calvet et al. (2005) Calvet, N., D’Alessio, P., Watson, D. M., Franco-Hernández, R., Furlan, E., Green, J., Sutter, P. M., Forrest, W. J., et al. 2005, ApJ, 630, L185
- Chiang & Murray-Clay (2007) Chiang, E., & Murray-Clay, R. 2007, Nature Physics, 3, 604
- D’Alessio et al. (2005) D’Alessio, P., Hartmann, L., Calvet, N., et al. 2005, ApJ, 621, 461
- de Juan Ovelar et al. (2013) de Juan Ovelar, M., Min, M., Dominik, C., Thalmann, C., Pinilla, P., Benisty, M., & Birnstiel, T. 2013, A&A, 560, A111
- Dong et al. (2015) Dong, R., Zhu, Z., & Whitney, B. 2015, ApJ, 809, 93
- Dong et al. (2012a) Dong, R., Rafikov, R., Zhu, Z., Hartmann, L., Whitney, B., Brandt, T., Muto, T., Hashimoto, J., et al. 2012a, ApJ, 750, 161
- Dong et al. (2012b) Dong, R., Hashimoto, J., Rafikov, R., Zhu, Z., Whitney, B., Kudo, T., Muto, T., Brandt, T., et al. 2012b, ApJ, 760, 111
- Dutrey et al. (2008) Dutrey, A., Guilloteau, S., Piétu, V., Chapillon, E., Gueth, F., Henning, T., Launhardt, R., Pavlyuchenkov, Y., et al. 2008, A&A, 490, L15
- Espaillat et al. (2007) Espaillat, C., Calvet, N., D’Alessio, P., Hernández, J., Qi, C., Hartmann, L., Furlan, E., & Watson, D. M. 2007, ApJ, 670, L135
- Espaillat et al. (2010) Espaillat, C., D’Alessio, P., Hernández, J., Nagel, E., Luhman, K. L., Watson, D. M., Calvet, N., Muzerolle, J., et al. 2010, ApJ, 717, 441
- Garufi et al. (2013) Garufi, A., Quanz, S. P., Avenhaus, H., Buenzli, E., Dominik, C., Meru, F., Meyer, M. R., Pinilla, P., et al. 2013, A&A, 560, A105
- Garufi et al. (2014) Garufi, A., Quanz, S. P., Schmid, H. M., Avenhaus, H., Buenzli, E., & Wolf, S. 2014, A&A, 568, A40
- Hartmann (2003) Hartmann, L. 2003, ApJ, 585, 398
- Hashimoto et al. (2011) Hashimoto, J., Tamura, M., Muto, T., Kudo, T., Fukagawa, M., Fukue, T., Goto, M., Grady, C. A., et al. 2011, ApJ, 729, L17
- Hornbeck et al. (2016) Hornbeck, J., Swearingen, J., Grady, C., Williger, G., Broan, A., Sitko, M., Wisniewski, J., et al. 2016, ApJ, 829, 65
- Houck et al. (2004) Houck, J. R., Roellig, T. L., van Cleve, J., Forrest, W. J., Herter, T., Lawrence, C. R., Matthews, K., Reitsema, H. J., et al. 2004, ApJS, 154, 18
- Hughes et al. (2009) Hughes, A. M., Andrews, S. M., Espaillat, C., Wilner, D. J., Calvet, N., D’Alessio, P., Qi, C., Williams, J. P., et al. 2009, ApJ, 698, 131
- Ingleby et al. (2015) Ingleby, L., Espaillat, C., Calvet, N., Sitko, M., Russell, R., & Champney, E. 2015, ApJ, 805, 149
- Kessler et al. (1996) Kessler, M. F., Steinz, J. A., Anderegg, M. E., Clavel, J., Drechsel, G., Estaria, P., Faelker, J., Riedinger, J. R., et al. 1996, A&A, 315, L27
- Koerner et al. (1993) Koerner, D. W., Sargent, A. I., & Beckwith, S. V. W. 1993, Icarus, 106, 2
- Lafreniére et al. (2007) Lafreniére, D., Marois, C., Doyon, R., Nadeau, D., & Artigau, É. 2007, ApJ, 660, 770
- Marois et al. (2006) Marois, C., Lafreniére, D., Doyon, R., Macintosh, B., & Nadeau, D. 2006, ApJ, 641, 556
- Mayama et al. (2012) Mayama, S., Hashimoto, J., Muto, T., Tsukagoshi, T., Kusakabe, N., Kuzuhara, M., Takahashi, Y., Kudo, T., et al. 2012, ApJ, 760, L26
- Mathews et al. (2012) Mathews, G. S., Williams, J. P., & Ménard, F. 2012, ApJ, 753, 59
- Min et al. (2012) Min, M., Canovas, H., Mulders, G. D., & Keller, C. U. 2012, A&A, 537, A75
- Murakawa (2010) Murakawa, K. 2010, A&A, 518, A63
- Muzerolle et al. (2010) Muzerolle, J., Allen, L. E., Megeath, S. T., Hernandez, J., & Gutermuth, R. A. 2010, ApJ, 708, 1107
- Pérez et al. (2013) Pérez, L. M., Carpenter, J. M., Chandler, C. J., Isella, A., Andrews, S. M., Ricci, L., Calvet, N., Corder, S. A., et al. 2012, ApJ, 760, L17
- Perrin et al. (2009) Perrin, M. D., Schneider, G., Duchene, G., Pinte, C., Grady, C. A., Wisniewski, J. P., & Hines, D. C. 2009, ApJ, 707, L132
- Pinilla et al. (2012) Pinilla, P., Benisty, M., & Birnstiel, T. 2012, A&A, 545, A81
- Rice et al. (2006) Rice, W. K. M., Armitage, P. J., Wood, K., & Lodato, G. 2006, Monthly Notices of the Royal Astronomical Society, 373, 1619
- Rosenfeld et al. (2014) Rosenfeld, K. A., Chiang, E., & Andrews, S. M. 2014, ApJ, 782, 62
- Sallum et al. (2015) Sallum, S., Follette, K. B., Eisner, J. A., Close, L. M., Hinz, P., Kratter, K., Males, J., Skemer, A., et al. 2015, Nature, 527, 342
- Schneider et al. (2003) Schneider, G., Wood, K., Silverstone, M. D., Hines, D. C., Koerner, D. W., Whitney, B. A., Bjorkman, J. E., & Lowrance, P. J. 2003, AJ, 125, 1467
- Simon et al. (2000) Simon, M., Dutrey, A., & Guilloteau, S. 2000, ApJ, 545, 1034
- Strom et al. (1989) Strom, K. M., Strom, S. E., Edwards, S., Cabrit, S., & Skrutskie, M. F. 1989, Astronomical Journal (ISSN 0004-6256), 97, 1451
- Tamura et al. (2006) Tamura, M., Hodapp, K., Takami, H., Abe, L., Suto, H., Guyon, O., Jacobson, S., Kandori, R., et al. 2006, Proc. SPIE 6269, 62690V
- Tamura et al. (2009) Tamura, M. 2009, AIP Conf. Proc, 1158, 11
- Uyama et al. (2016) Uyama, T., Hashimoto, J., Kuzuhara, M., Mayama, S., Akiyama, E., Kudo, T., Kusakabe, N., Abe, L., et al. 2016, arXiv.org, Vol. 1604, arXiv:1604.04697v1
- Whitney & Hartmann (1992) Whitney, B. A., & Hartmann, L. 1992, ApJ, 395, 529
- Whitney & Wolff (2002) Whitney, B. A., & Wolff, M. J. 2002, ApJ, 574, 205
- Zhu et al. (2012) Zhu, Z., Nelson, R. P., Dong, R., Espaillat, C., & Hartmann, L. 2012, ApJ, 755, 6