Radio observations of the tidal disruption event XMMSL1 J074085
Abstract
We present radio observations of the tidal disruption event candidate (TDE) XMMSL1 J074085 spanning 592 to 875 d post X-ray discovery. We detect radio emission that fades from an initial peak flux density at 1.6 GHz of mJy to mJy suggesting an association with the TDE. This makes XMMSL1 J074085 at Mpc the nearest TDE with detected radio emission to date and only the fifth TDE with radio emission overall. The observed radio luminosity rules out a powerful relativistic jet like that seen in the relativistic TDE Swift J1644+57. Instead we infer from an equipartition analysis that the radio emission most likely arises from a non-relativistic outflow similar to that seen in the nearby TDE ASASSN-14li, with a velocity of about km s-1 and a kinetic energy of about erg, expanding into a medium with a density of about cm-3. Alternatively, the radio emission could arise from a weak initially-relativistic but decelerated jet with an energy of erg, or (for an extreme disruption geometry) from the unbound debris. The radio data for XMMSL1 J074085 continues to support the previous suggestion of a bimodal distribution of common non-relativistic isotropic outflows and rare relativistic jets in TDEs (in analogy with the relation between Type Ib/c supernovae and long-duration gamma-ray bursts). The radio data also provide a new measurement of the circumnuclear density on a sub-parsec scale around an extragalactic supermassive black hole.
1 Introduction
In recent decades bright flares in the nuclei of several dozen previously-quiescent galaxies have been interpreted as transient accretion onto supermassive black holes (SMBHs) caused by the tidal disruption of a star (Rees, 1988; Komossa, 2015). The primary predicted observational signature of these tidal disruption events (TDEs) is transient thermal emission from the newly-formed accretion disk, peaking at extreme ultraviolet (UV) wavelengths. Detailed multi-wavelength follow-up of TDE candidates in recent years has revealed soft X-rays, UV, and optical emission that point to a more complicated picture, including likely reprocessing of the disk emission by outflows (recent review by Komossa 2015). Additionally, three TDEs have been discovered to launch relativistic jets, detected on-axis in -rays, hard X-rays, and in two cases radio (e.g. Bloom et al. 2011; Burrows et al. 2011; Levan et al. 2011; Zauderer et al. 2011; Cenko et al. 2012; Brown et al. 2015). Swift J164449.3+573451 (hereafter Sw J1644+57) is the prototypical jetted TDE and is still observable in the radio band more than five years after discovery. Observations of Sw J1644+57 have enabled new insights into the formation, evolution, and cessation of relativistic jets from SMBHs and have provided the first picture of the circumnuclear density profile of a quiescent galaxy on sub-parsec scales (Zauderer et al., 2011; Berger et al., 2012; Zauderer et al., 2013). Radio observations of TDEs also provide an independent measurement of the event energy, the size of the emitting region, and the magnetic field strength (e.g. Zauderer et al. 2011; Berger et al. 2012; Zauderer et al. 2013; Alexander et al. 2016; van Velzen et al. 2016b; Lei et al. 2016).
We expect mass ejection and therefore radio emission due to interaction with circumnuclear matter for most, if not all TDEs, as theoretical models predict that the initial fallback rate for most events should be super-Eddington (Strubbe & Quataert, 2009; van Velzen et al., 2011; Giannios & Metzger, 2011; Guillochon & Ramirez-Ruiz, 2013). However, only four TDEs with associated radio emission have been published to date: two jetted events discovered by Swift (Sw J1644+57 and Sw J2058+0516), IGR J1258+0134, claimed to have an off-axis relativistic jet (Irwin et al., 2015; Lei et al., 2016), and ASASSN-14li, which produced less luminous radio emission arising from a non-relativistic outflow (Alexander et al., 2016; van Velzen et al., 2016b). Radio upper limits for an additional 15 events rule out Sw J1644+57-like jets in most cases, but cannot rule out slower, non-relativistic outflows as seen in ASASSN-14li (Komossa, 2002; Bower et al., 2013; van Velzen et al., 2013; Chornock et al., 2014; Arcavi et al., 2014). Building on this effort, we have begun a systematic effort to obtain radio observations of nearby TDE candidates, for which even non-relativistic outflows should be detectable with current facilities.
On 2014 April 1 UT, the XMM-Newton X-ray satellite detected a flare from the nucleus of the nearby (; Mpc) quiescent galaxy 2MASX 074007858539307 as part of the XMM-Newton slew survey (Saxton et al., 2008). The flare (hereafter XMMSL1 J074085) was discovered to extend from the hard X-ray band through the UV, with minimal variability in the optical, and consists of both thermal and non-thermal components (Saxton et al., 2016). It reached a peak bolometric luminosity of erg s-1 before decreasing by a factor of 70 in the X-rays and 12 in the UV over d and was interpreted by Saxton et al. (2016) as a TDE. The X-ray variability constrains the SMBH mass to be M⊙, consistent with this interpretation (Saxton et al., 2016). The host galaxy exhibits no current star formation or AGN activity, and its optical spectrum is consistent with a burst of star formation Gyr ago, placing it within the rare category of post-starburst galaxies seemingly favored by recent TDE candidates (Arcavi et al., 2014; French et al., 2016). Motivated by an exploratory radio detection consistent with the nucleus of the host galaxy (Saxton et al., 2016), we undertook a radio monitoring campaign of XMMSL1 J074085 to determine if the radio emission is associated with the TDE. Here we present the results and analysis of this campaign.
This paper is structured as follows. In Section 2, we present our radio observations of XMMSL1 J074085, spanning d after discovery. In Section 3, we outline possible models for the radio emission. We then use a Markov Chain Monte Carlo (MCMC) analysis to constrain the physical properties of the outflow launched by the TDE, as well as the circumnuclear density. We compare these results to those obtained for other TDEs with radio emission in Section 4, and present our conclusions in Section 5.
2 Radio Observations
| UT Date | stat ISS | Config- | ||
|---|---|---|---|---|
| (days) | (GHz) | (mJy) | uration | |
| 2015 Nov 14 | 592 | 5.5 | 0.58 0.01 0.22 | 6A |
| 2015 Nov 14 | 592 | 9.0 | 0.38 0.01 0.04 | 6A |
| 2015 Dec 1 | 609 | 1.5 | 1.19 0.06 0.18 | 1.5A |
| 2015 Dec 1 | 609 | 2.1 | 1.02 0.04 0.19 | 1.5A |
| 2015 Dec 1 | 609 | 2.7 | 0.87 0.04 0.19 | 1.5A |
| 2015 Dec 1 | 609 | 18.0 | 0.13 0.03 0.005 | 1.5A |
| 2016 May 9 | 769 | 1.7 | 0.89 0.09 0.14 | 6A |
| 2016 May 9 | 769 | 2.1 | 0.63 0.04 0.12 | 6A |
| 2016 May 9 | 769 | 2.8 | 0.54 0.05 0.12 | 6A |
| 2016 May 9 | 769 | 5.5 | 0.40 0.01 0.15 | 6A |
| 2016 May 9 | 769 | 9.0 | 0.25 0.01 0.02 | 6A |
| 2016 Aug 23 | 875 | 1.6 | 0.65 0.06 0.10 | 6C |
| 2016 Aug 23 | 875 | 2.1 | 0.58 0.03 0.11 | 6C |
| 2016 Aug 23 | 875 | 2.7 | 0.55 0.03 0.12 | 6C |
| 2016 Aug 23 | 875 | 5.5 | 0.42 0.02 0.16 | 6C |
| 2016 Aug 23 | 875 | 9.0 | 0.23 0.02 0.02 | 6C |
Notes. All values of are relative to 2014 April 1 UT, the discovery date in X-rays. The flux values are given with associated statistical uncertainties from fitting a point source model to the imaged data and the additional flux variation expected from interstellar scintillation (ISS). The ATCA telescope configuration is given in the rightmost column. Our December 2015 observation only used five antennas, as CA03 was unavailable.
We observed the position of XMMSL1 J074085 with the Australia Telescope Compact Array (ATCA) beginning on 2015 November 14 UT, 592 d after the initial X-ray discovery. In our initial observation, we detected a source at 19, ( in each coordinate) at 5.5 GHz and 9.0 GHz. This is consistent with the Swift UVOT position (43, , 90% confidence radius ), the X-ray position, and the nucleus of the host galaxy (Saxton et al., 2016). Further observations on 2015 December 1 UT resulted in additional detections at 2.1 GHz and 18 GHz. We observed the source twice more under program C3106 on 2016 May 9 UT and 2016 August 23 UT (see Table 1).
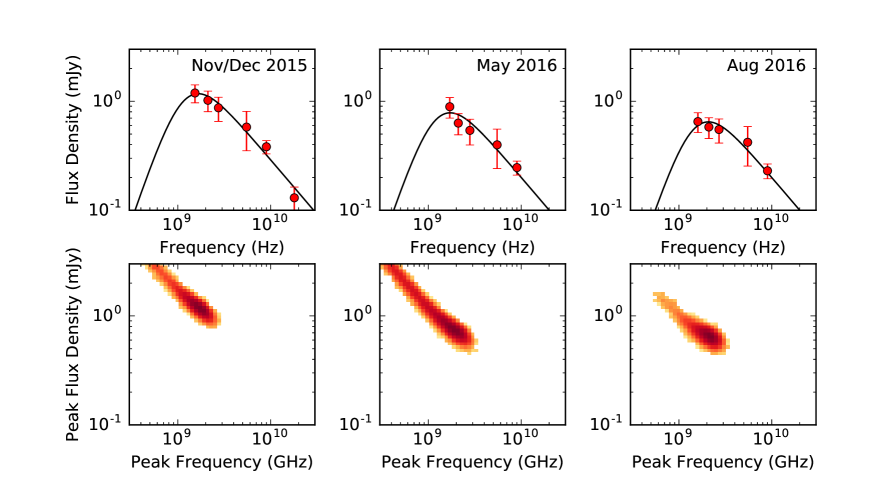
We analyzed the data using the Miriad package (Sault et al., 1995). The data were flagged for RFI and calibrated using PKSB1934638 as the primary flux calibrator (with assumed flux densities of 12.58 Jy at 2.1 GHz, 4.97 Jy at 5.5 GHz, 2.70 Jy at 9 GHz, and 1.11 Jy at 18 GHz) and PKSB0454810 as the gain and phase calibrator. All calibrations were performed with the 2 GHz observing bands split into 8 bins. After initial imaging, phase-only self-calibration was used to correct for atmospheric phase errors on timescales of a few minutes. We used multi-frequency synthesis in imaging and deconvolution and split the lower band into 3 sub-bands for imaging, centered at roughly 1.6 GHz, 2.1 GHz, and 2.7 GHz (the effective mean frequency of each sub-band varied slightly between epochs due to transient RFI). At the lowest frequencies the entire primary beam was imaged to account for sidelobes of other sources in the field. Source fluxes were determined by fitting the point source response (gaussian clean beam) to the cleaned images. The later epochs exhibit clear fading relative to the initial observations (Figure 1 top panels, Table 1).
We investigated the consistency of the self-calibration across epochs by measuring the flux of a background object visible in each image, J073933.59853954.3. There is no catalogued optical or radio source at this position, but a faint point-like source is detected in archival WISE observations obtained at a mean epoch of 2010 March 16. This object has a color of mag, inconsistent with an AGN (Stern et al., 2012), and shows no signs of infrared variability. We find that the radio flux of this second source changes by up to 10% between epochs at all frequencies. These variations are 2-3 times larger than the image rms noise at 5.5 GHz and 9.0 GHz. Although it is possible that these changes are due to intrinsic variability of this source, we conservatively add an additional 10% uncertainty to all flux densities in our modeling to account for possible calibration uncertainties.
The location of XMMSL1 J074085 was also observed on 12 January 1998 and 24 October 1998 as part of the Sydney University Molonglo Sky Survey (SUMSS; Mauch et al. 2003). No source was detected in a by combined image centered on the radio position down to a limit of 4.3 mJy at 843 MHz. If we assume no self-absorption and use a single power law to extrapolate our observed ATCA spectral energy distributions to 843 MHz, we find that even with this conservative assumption the source would have not been detected during any of our observations. The SUMSS limit therefore places only a very weak upper bound on the pre-flare radio variability of the source.
2.1 Interstellar Scintillation
Compact radio sources viewed through the interstellar medium (ISM) are observed to undergo random flux variations on timescales of hours to days. This effect, called interstellar scintillation, is caused by small-scale inhomogeneities in the ISM and can be significant at low radio frequencies. Using the NE2001 Galactic free electron energy density model (Cordes & Lazio, 2002), we find that the transition between strong and weak scintillation along our line of sight to XMMSL1 J074085 occurs at GHz. Using the method of Walker (1998) and Goodman & Narayan (2006), we approximate the rms and typical timescale of the flux variations expected for a source of angular size 50 as.111We choose 50 as as a conservative estimate of the source size based on an initial fit to our epoch 1 observations that ignores any scintillation uncertainty; our subsequent analysis shows that including scintillation increases the uncertainty on our size estimate, but results in a similar value. See Section 3.2.2. This size scale is comparable to the Fresnel scale at GHz and the source can be treated as point-like below this frequency. In both the strong and the weak regimes, a point source will exhibit the strongest and most rapid flux variations. If the emitting region is larger than 50 as, then scintillation effects will be further suppressed.
From this model, we find that our 18 GHz observation is unlikely to be significantly affected by scintillation, with flux variations of and a timescale that is much shorter than our observation. Below 13 GHz, we expect both diffractive and refractive scintillation. Our observations are not sensitive to diffractive scintillation, which would require narrower bandwidths and shorter integration times to resolve (Walker, 1998), but refractive scintillation is a broadband process and the timescales of the estimated flux variations are longer than our integration times. We estimate expected flux variations of % between epochs, depending on the frequency (Table 1). This makes scintillation the dominant source of uncertainty in our measurements at low frequencies and we add the predicted scintillation variations in quadrature with the statistical and calibration uncertainties for all of our modeling.
3 Possible Origins of the Radio Emission
3.1 Steady-State Processes
We first consider whether the observed radio emission could be due to processes in the host galaxy unrelated to the TDE. The observed decline to % of the original flux density over nine months is inconsistent with star formation. Furthermore, as discussed in Saxton et al. (2016), archival observations of the host galaxy reveal that it has little ongoing star formation activity and exhibited no signs of pre-TDE AGN activity. The host’s optical spectrum showed no emission lines and archival GALEX observations restrict the current star formation rate to M⊙ yr-1 (Saxton et al., 2016). This star formation rate implies a radio flux density of mJy at 1.5 GHz (Condon et al., 2002), which is a factor of 20 less than the flux density we observe in the last epoch. We therefore conclude that star formation contributes negligibly to the radio emission at all times probed by our observations.
The flux decline rate is roughly consistent with the behavior of the radio AGN samples studied by Hovatta et al. (2008) and Nieppola et al. (2009), who found that typical radio AGN flares took years to decline back to quiescent flux levels. Each of our radio epochs can be fit by a single power law, . This spectral index is somewhat steeper than the typical flare spectra observed by Hovatta et al. (2008), who found , but it is within the range of radio spectral indices observed in nearby Seyfert galaxies (Ho & Ulvestad, 2001). The primary argument against an AGN origin for the radio emission thus comes from observations of the host at other wavelengths. Optical spectra of the host taken both before and after the TDE discovery showed none of the characteristic AGN emission lines and allowed Saxton et al. (2016) to place an upper limit of erg s-1 cm-2 on the flux of the [OIII]5007 line, which when combined with X-ray observations shows that the ratio of the galaxy is atypical for an AGN. The archival WISE galaxy colors are also consistent with a non-active galaxy (Stern et al., 2012; Saxton et al., 2016). We therefore conclude that all of the observed radio emission is associated with the TDE.
3.2 Synchrotron Emission Model
Our radio observations of XMMSL1 J074085 are broadly consistent with optically thin synchrotron emission. Below, we consider three possible scenarios for the origin of this emission in the context of a TDE. In all three scenarios, a blastwave generated by outflowing material accelerates the ambient electrons into a power law distribution for , where is the electron Lorentz factor, is the minimum Lorentz factor of the distribution, and is the power law index. We follow the equipartition formalism outlined in Barniol Duran et al. (2013), which can be applied to both relativistic and non-relativistic outflows. This allows us to estimate the outflow energy () and the radius of the emitting region () by assuming that the the electron and magnetic field energy densities are near equipartition (Pacholczyk, 1970; Scott & Readhead, 1977; Chevalier, 1998). We can then derive a number of other useful quantities, including the pre-existing circumnuclear density (), the magnetic field strength (), the outflow velocity (, or when scaled to ), and the outflow mass ().
We note that this analysis relies on being able to identify a spectral peak (), which corresponds to either the synchrotron frequency of electrons at () or the self-absorption frequency (), depending on the outflow parameters. For late-time observations like those considered here, we generically expect and therefore that . This is true for both non-relativistic and initially relativistic outflows. If we assume , as expected for a non-relativistic outflow (Barniol Duran et al., 2013), we find that a Markov Chain Monte Carlo (MCMC) fitting technique can identify (Figure 1). This is possible because our data exhibit spectral flattening at low frequencies, allowing us to constrain the peak frequency even though the actual peak is near or just below the lower edge of our observing band. However, due to the additional uncertainty generated by scintillation, we cannot entirely rule out the possibility that is below our observing band for all three epochs (note the tail to low frequencies in all three epochs in the distributions shown in row 2 of Figure 1). If , as expected for a relativistic outflow, the constraint on weakens further.
If the peak frequency has passed below the range of our observations, then we can still make progress by setting upper limits on and lower limits on the flux density of the peak (). Since the outflow expands over time, we expect to evolve to lower frequencies, so the most constraining limit comes from the first epoch. The MCMC modeling gives GHz and mJy for this observation (Figure 1). For each of the models considered below, we therefore take GHz and mJy at a time days and make no attempt to discuss the time variation of these quantities.
3.2.1 Relativistic Jet
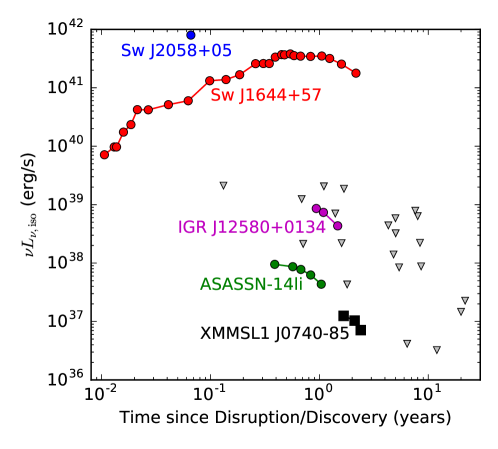
We first consider the possibility that the radio emission is caused by a relativistic jet launched during the phase of peak accretion onto the SMBH (assumed to coincide with the X-ray discovery date). The observed emission is orders of magnitude less luminous ( erg s-1 at 5.5 GHz) than the on-axis relativistic jet seen in Sw J1644+57 at a similar time ( erg s-1 at 5.8 GHz), so any jet in XMMSL1 J074085 must be much weaker (Figure 2). For any reasonable combination of parameters, an initially relativistic jet would have decelerated to non-relativistic velocities by the time of our first epoch (Nakar & Piran, 2011). The subsequent evolution of a decelerated jet is indistinguishable from that of a spherical, mildly-relativistic outflow, regardless of the initial orientation of the jet axis relative to our line of sight (Nakar & Piran, 2011). For all observing frequencies , the light curve peaks at the deceleration time, days, where is the jet energy in units of erg and is the density of the surrounding medium in units of cm-3. At times , the flux density at is given by , where mJy is the flux at (Nakar & Piran, 2011). Here, and are the fraction of the total energy carried by the electrons and by the magnetic field, respectively, and is the distance to the source in units of cm.
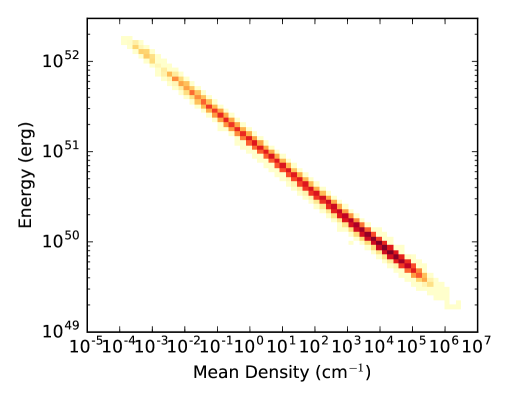
We observe a broadband flux decline throughout our observations, which implies that in this scenario days and days) mJy. By comparing the theoretical light curve to our observed light curve between epochs 1 and 3 we find . We assume that the system is in equipartition with and (Barniol Duran et al., 2013). This minimizes the total energy of the system. We can then use the above expressions for , , and together with the output of our MCMC run with to determine the energy and circumnuclear density required to satisfy our observations. The resulting distribution of allowed energies and densities is shown in Figure 3. We find that with 95% confidence, the energy of the jet is between erg and erg and the density is between 0.03 cm-3 and cm-3. The median density, cm-3, is comparable to recent results that suggest typical densities in TDE host galaxies are cm-3 at a distance of cm (Zauderer et al., 2011; Berger et al., 2012; Alexander et al., 2016; Generozov et al., 2016). The median energy, erg, is 100 times weaker than the erg jet seen in Sw J1644+57 (Berger et al., 2012).
3.2.2 Non-relativistic Outflow
We next model the radio emission as a non-relativistic outflow, using the same method applied to our radio observations of ASASSN-14li (Alexander et al., 2016). The primary model that we consider is a spherical outflow launched at the time of the X-ray discovery. This model is motivated by theoretical simulations that show a wind is expected during even mildly super-Eddington accretion, while jet formation may require more extreme conditions (Strubbe & Quataert, 2009; De Colle et al., 2012; Tchekhovskoy et al., 2014; Kelley et al., 2014). We also consider a mildly collimated outflow with an angular cross-sectional area of . We follow previous work (Barniol Duran et al., 2013; Alexander et al., 2016) and assume equipartition with , , and kinetic energy dominated by protons. We also assume that the emission peaks at the self-absorption frequency, synchrotron and Compton cooling are unimportant at our observing frequencies, and the emission emanates from a shell with a thickness of of the blastwave radius.
For GHz and mJy, we find that in the spherical case the outflow has a radius cm and an energy erg. This implies an average expansion velocity of km s-1 and an outflow mass of M⊙. We find that the average ambient density within is cm-3, which means that the outflow has swept up an amount of material that is a negligible fraction of its total mass. We therefore expect that the outflow has not yet decelerated. Finally, we infer a moderate magnetic field strength G. This is an order of magnitude lower than the magnetic field strength inferred for Sw J1644+57 at early times (Zauderer et al., 2011). If the peak frequency of the radio spectral energy distribution is below our observing range in the first epoch, then the inferred values of , , , and can be treated as lower limits while and can be treated as upper limits.
The mildly collimated outflow model gives similar results. The radius and velocity inferred are somewhat larger, cm and km s-1, but this is still consistent with a non-relativistic treatment. The energy and mass of the outflow are somewhat lower, erg and M⊙, as are the average ambient density, cm-3, and the magnetic field strength, G. For both models, these properties are similar to those of the non-relativistic outflow found in ASSASN-14li (Alexander et al., 2016), which would make XMMSL1 J074085 the second known TDE with this less energetic type of outflow.
3.2.3 Unbound Debris
When a star is tidally disrupted, approximately half of the debris will ultimately accrete onto the black hole, while the rest is unbound (Rees, 1988). We consider whether the observed emission could be due to the interaction between the unbound debris and the circumnuclear medium (Khokhlov & Melia, 1996). We expect the velocity of the unbound debris to be km s-1, so a non-relativistic model similar to that considered in the previous section is appropriate. However, the size of the emitting region will be much smaller, as simulations have shown that the unbound debris stream is expected to be initially self-gravitating for all but the most extreme event geometries (Kochanek, 1994; Guillochon et al., 2014; Coughlin & Nixon, 2015). In this case, the solid angle subtended by the unbound debris will decrease as the stream leaves the vicinity of the SMBH and will only begin homologous expansion at a distance of cm. At this distance, the stream will cover a solid angle of steradians (Guillochon et al., 2015) and any radio emission produced will be orders of magnitude too faint to explain our observed radio emission.
For non self-gravitating streams, (created by events in which the disrupted star’s closest point of approach to the SMBH is of the tidal radius), the solid angle subtended by the stream is determined by the spread in velocity of the unbound debris and is roughly 0.2 steradians for a non-spinning M⊙ black hole (Strubbe & Quataert, 2009). For spinning black holes, the velocity spread may increase or decrease by up to a factor of 2 (Kesden, 2012). Streams with a low radiative efficiency may also be non self-gravitating; Krolik et al. (2016) suggested that a bow shock between the unbound debris and the ambient medium could heat the stream beyond its ability to cool, increasing the size of the emitting region enough to explain the radio emission of ASASSN-14li. However, this model requires a high circumnuclear density and is sensitive to the velocity distribution of the unbound debris. Repeating our non-relativistic analysis from the previous section for a solid angle of 0.2 steradians (), we find that XMMSL1 J074085’s radio emission can be explained by outflowing material at a radius of with an average velocity km s-1 interacting with a circumnuclear medium with an average density of cm-3. Since the inferred mass is small, M⊙, this means that we are not observing radio emission from the entire unbound debris stream. This could be plausible if we are only seeing the fastest-moving material at the leading edge of the unbound debris stream (as suggested for ASASSN-14li by Krolik et al. 2016), but due to the rarity of such close star-SMBH encounters, we consider emission from a non self-gravitating unbound debris stream to be a less likely explanation for the radio emission.
4 Discussion
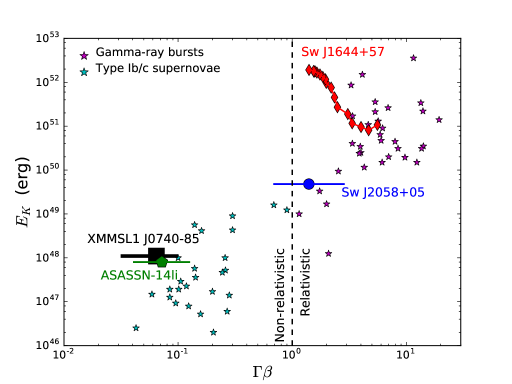
Our observations make XMMSL1 J074085 the fifth TDE with detected radio emission. Even with such a small sample size, it is clear that there is a wide diversity in the radio properties of TDEs (Figure 2). The clearest distinction is between TDEs that produce luminous relativistic jets, like Sw J1644+57 and Sw J2058+05, and TDEs that produce much weaker emission, like ASASSN-14li (Figure 4). The recent TDE candidate IGR J12580+0134 has a radio luminosity between these two extremes, but could have launched an off-axis jet as powerful as Sw J1644+57 (Irwin et al., 2015; Lei et al., 2016). Complicating the analysis of this event, the host of IGR J12580+0134 is a known AGN and had a pre-flare radio luminosity times fainter than the peak luminosity reached during the flare (Irwin et al., 2015). Even the most variable AGN rarely undergo flux changes of this magnitude at 6 GHz, but further study may be needed to disentangle the TDE from other AGN activity. We attempt no further analysis of IGR J12580+0134 in this paper.
Our radio observations of XMMSL1 J074085 are unable to directly distinguish between a decelerated weak relativistic jet and a non-relativistic outflow model, but they do require any jet in XMMSL1 J074085 to be much less energetic than the jet seen in Sw J1644+57. The similar energy scales inferred from the radio observations imply that XMMSL1 J074085 has more in common with ASASSN-14li than with the relativistic events, which may suggest that the non-relativistic outflow model considered here is more appropriate than a jet. Furthermore, while the relativistic Swift events were highly super-Eddington, the peak accretion rate inferred from X-ray observations of XMMSL1 J074085 is mildly sub-Eddington (Saxton et al., 2016). This is also similar to ASASSN-14li, where modeling of the X-ray, UV, and optical emission showed that this event was at most only mildly super-Eddington (Miller et al., 2015; Holoien et al., 2016; Alexander et al., 2016).
Extreme jetted TDEs exhibit -ray emission and relativistic outflows with a large kinetic energy, but they represent at most a few percent of the overall TDE volumetric rate (Mimica et al., 2015). On the other hand, events like XMMSL1 J074085 and ASASSN-14li exhibit less energetic outflows and appear to represent the bulk of the TDE population (Alexander et al., 2016). Published upper limits on radio emission from 15 archival events can rule out Sw J1644+57-like jets in many cases (Komossa, 2002; Bower et al., 2013; van Velzen et al., 2013; Chornock et al., 2014; Arcavi et al., 2014), but the discovery of XMMSL1 J074085 reinforces the idea that many of the more distant literature TDEs could have also produced radio emission at a luminosity too low to be detectable with current facilities (Figure 2). The TDE sample, although small, appears to trace the same relation seen in LGRBs and Type Ib/c SNe (Figure 4). The LGRBs exhibit relativistic outflows with erg, while Type Ib/c SNe have non-relativistic outflows with erg. In addition, LGRBs represent of the Type Ib/c SN rate (Wanderman & Piran, 2010).
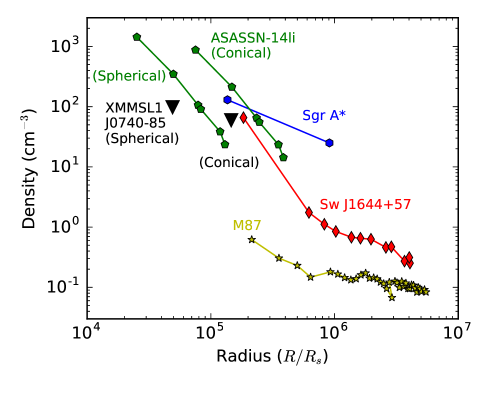
Radio observations of TDEs are also rapidly becoming a vital tool to study the population of quiescent SMBHs in nearby galaxies, as they probe the density around SMBHs at otherwise unresolvable parsec and sub-parsec scales. Comparable resolution has been recently achieved for ASASSN-14li using infrared observations of the dust emission from the host nucleus, which reveal a light echo from the flare (Lu et al., 2016; van Velzen et al., 2016a), but otherwise is only directly measurable for the SMBH in our own galaxy, Sagittarius A* (Baganoff et al., 2003), and for the M⊙ SMBH in M87 if we scale by the black hole’s Schwarzschild radius (, where is the black hole mass). We show the density inferred from our non-relativistic outflow model of XMMSL1 J074085 in comparison with the circumnuclear density profiles derived from other TDE radio observations in Figure 5. We see that for a range of plausible outflow geometries, the density at the core of XMMSL1 J074085’s host galaxy is comparable to that seen around ASASSN-14li, Sw J1644+57, and Sgr A* when scaled by the Schwarzschild radius (and therefore by the mass) of each SMBH.
5 Conclusions
We have analyzed radio emission localized to the nucleus of the host galaxy of the TDE candidate XMMSL1 J074085 (Saxton et al., 2016). We find that the radio emission is consistent with a non-relativistic outflow that has similar properties to the outflow discovered in ASASSN-14li (Alexander et al., 2016), making XMMSL1 J074085 only the second TDE known to produce radio emission of this type. Other explanations such as a weak initially-relativistic jet or emission from the unbound debris generated by a deeply penetrating tidal encounter are also possible, but less likely. A strong relativistic jet like that seen in Sw J1644+57 is ruled out. Our radio observations of XMMSL1 J074085 point to the importance of TDE radio studies, but also highlight the importance of early observations to constrain the overall energy scale while the ambient density is still high enough for the self-absorption peak to be visible in the radio band.
With an ever-increasing number of optical, X-ray, and radio surveys slated to discover tens to hundreds of new TDEs per year over the coming decades, we expect to discover radio emission from many more jetted and non-jetted TDEs. An event with the radio luminosity of XMMSL1 J074085 ( erg s-1 Hz-1 at 5.5 GHz) can already be detected out to a distance of Mpc with a single ATCA observation and Mpc with a one-hour VLA observation. Our observations of XMMSL1 J074085 are an important step towards more fully characterizing outflows in TDEs and the detailed properties of the circumnuclear environments of SMBHs.
References
- Alexander et al. (2016) Alexander, K. D., Berger, E., Guillochon, J., Zauderer, B. A., & Williams, P. K. G. 2016, ApJ, 819, L25
- Arcavi et al. (2014) Arcavi, I., Gal-Yam, A., Sullivan, M., et al. 2014, ApJ, 793, 38
- Astropy Collaboration et al. (2013) Astropy Collaboration, Robitaille, T. P., Tollerud, E. J., et al. 2013, A&A, 558, A33
- Baganoff et al. (2003) Baganoff, F. K., Maeda, Y., Morris, M., et al. 2003, ApJ, 591, 891
- Barniol Duran et al. (2013) Barniol Duran, R., Nakar, E., & Piran, T. 2013, ApJ, 772, 78
- Berger et al. (2012) Berger, E., Zauderer, A., Pooley, G. G., et al. 2012, ApJ, 748, 36
- Bloom et al. (2011) Bloom, J. S., Giannios, D., Metzger, B. D., et al. 2011, Science, 333, 203
- Bower et al. (2013) Bower, G. C., Metzger, B. D., Cenko, S. B., Silverman, J. M., & Bloom, J. S. 2013, ApJ, 763, 84
- Brown et al. (2015) Brown, G. C., Levan, A. J., Stanway, E. R., et al. 2015, MNRAS, 452, 4297
- Burrows et al. (2011) Burrows, D. N., Kennea, J. A., Ghisellini, G., et al. 2011, Nature, 476, 421
- Cenko et al. (2012) Cenko, S. B., Krimm, H. A., Horesh, A., et al. 2012, ApJ, 753, 77
- Chevalier (1998) Chevalier, R. A. 1998, ApJ, 499, 810
- Chornock et al. (2014) Chornock, R., Berger, E., Gezari, S., et al. 2014, ApJ, 780, 44
- Condon et al. (2002) Condon, J. J., Cotton, W. D., & Broderick, J. J. 2002, AJ, 124, 675
- Cordes & Lazio (2002) Cordes, J. M., & Lazio, T. J. W. 2002, ArXiv Astrophysics e-prints, astro-ph/0207156
- Coughlin & Nixon (2015) Coughlin, E. R., & Nixon, C. 2015, ApJ, 808, L11
- De Colle et al. (2012) De Colle, F., Guillochon, J., Naiman, J., & Ramirez-Ruiz, E. 2012, ApJ, 760, 103
- French et al. (2016) French, K. D., Arcavi, I., & Zabludoff, A. 2016, ApJ, 818, L21
- Generozov et al. (2016) Generozov, A., Mimica, P., Metzger, B. D., et al. 2016, ArXiv e-prints, arXiv:1605.08437
- Giannios & Metzger (2011) Giannios, D., & Metzger, B. D. 2011, MNRAS, 416, 2102
- Goodman & Narayan (2006) Goodman, J., & Narayan, R. 2006, ApJ, 636, 510
- Guillochon et al. (2014) Guillochon, J., Manukian, H., & Ramirez-Ruiz, E. 2014, ApJ, 783, 23
- Guillochon et al. (2015) Guillochon, J., McCourt, M., Chen, X., Johnson, M. D., & Berger, E. 2015, ArXiv e-prints, arXiv:1509.08916
- Guillochon & Ramirez-Ruiz (2013) Guillochon, J., & Ramirez-Ruiz, E. 2013, ApJ, 767, 25
- Ho & Ulvestad (2001) Ho, L. C., & Ulvestad, J. S. 2001, The Astrophysical Journal Supplement Series, 133, 77
- Holoien et al. (2016) Holoien, T. W.-S., Kochanek, C. S., Prieto, J. L., et al. 2016, MNRAS, 455, 2918
- Hovatta et al. (2008) Hovatta, T., Nieppola, E., Tornikoski, M., et al. 2008, A&A, 485, 51
- Hunter (2007) Hunter, J. D. 2007, Computing In Science & Engineering, 9, 90
- Irwin et al. (2015) Irwin, J. A., Henriksen, R. N., Krause, M., et al. 2015, ApJ, 809, 172
- Jones et al. (2001–) Jones, E., Oliphant, T., Peterson, P., et al. 2001–, SciPy: Open source scientific tools for Python, , , [Online; accessed 2017-02-07]
- Kelley et al. (2014) Kelley, L. Z., Tchekhovskoy, A., & Narayan, R. 2014, MNRAS, 445, 3919
- Kesden (2012) Kesden, M. 2012, Phys. Rev. D, 86, 064026
- Khokhlov & Melia (1996) Khokhlov, A., & Melia, F. 1996, ApJ, 457, L61
- Kochanek (1994) Kochanek, C. S. 1994, ApJ, 422, 508
- Komossa (2002) Komossa, S. 2002, in Reviews in Modern Astronomy, Vol. 15, Reviews in Modern Astronomy, ed. R. E. Schielicke, 27
- Komossa (2015) Komossa, S. 2015, Journal of High Energy Astrophysics, 7, 148
- Krolik et al. (2016) Krolik, J., Piran, T., Svirski, G., & Cheng, R. M. 2016, ApJ, 827, 127
- Lei et al. (2016) Lei, W.-H., Yuan, Q., Zhang, B., & Wang, D. 2016, ApJ, 816, 20
- Levan et al. (2011) Levan, A. J., Tanvir, N. R., Cenko, S. B., et al. 2011, Science, 333, 199
- Lu et al. (2016) Lu, W., Kumar, P., & Evans, N. J. 2016, MNRAS, 458, 575
- Margutti et al. (2014) Margutti, R., Milisavljevic, D., Soderberg, A. M., et al. 2014, ApJ, 797, 107
- Mauch et al. (2003) Mauch, T., Murphy, T., Buttery, H. J., et al. 2003, MNRAS, 342, 1117
- Miller et al. (2015) Miller, J. M., Kaastra, J. S., Miller, M. C., et al. 2015, Nature, 526, 542
- Mimica et al. (2015) Mimica, P., Giannios, D., Metzger, B. D., & Aloy, M. A. 2015, MNRAS, 450, 2824
- Nakar & Piran (2011) Nakar, E., & Piran, T. 2011, Nature, 478, 82
- Nieppola et al. (2009) Nieppola, E., Hovatta, T., Tornikoski, M., et al. 2009, The Astronomical Journal, 137, 5022
- Pacholczyk (1970) Pacholczyk, A. G. 1970, Radio astrophysics. Nonthermal processes in galactic and extragalactic sources
- Rees (1988) Rees, M. J. 1988, Nature, 333, 523
- Russell et al. (2015) Russell, H. R., Fabian, A. C., McNamara, B. R., & Broderick, A. E. 2015, MNRAS, 451, 588
- Sault et al. (1995) Sault, R. J., Teuben, P. J., & Wright, M. C. H. 1995, in Astronomical Society of the Pacific Conference Series, Vol. 77, Astronomical Data Analysis Software and Systems IV, ed. R. A. Shaw, H. E. Payne, & J. J. E. Hayes, 433
- Saxton et al. (2008) Saxton, R. D., Read, A. M., Esquej, P., et al. 2008, A&A, 480, 611
- Saxton et al. (2016) Saxton, R. D., Read, A. M., Komossa, S., et al. 2016, A&A, arXiv:1610.01788
- Scott & Readhead (1977) Scott, M. A., & Readhead, A. C. S. 1977, MNRAS, 180, 539
- Stern et al. (2012) Stern, D., Assef, R. J., Benford, D. J., et al. 2012, ApJ, 753, 30
- Strubbe & Quataert (2009) Strubbe, L. E., & Quataert, E. 2009, MNRAS, 400, 2070
- Tchekhovskoy et al. (2014) Tchekhovskoy, A., Metzger, B. D., Giannios, D., & Kelley, L. Z. 2014, MNRAS, 437, 2744
- van der Walt et al. (2011) van der Walt, S., Colbert, S. C., & Varoquaux, G. 2011, Computing in Science & Engineering, 13, 22
- van Velzen et al. (2013) van Velzen, S., Frail, D. A., Körding, E., & Falcke, H. 2013, A&A, 552, A5
- van Velzen et al. (2011) van Velzen, S., Körding, E., & Falcke, H. 2011, MNRAS, 417, L51
- van Velzen et al. (2016a) van Velzen, S., Mendez, A. J., Krolik, J. H., & Gorjian, V. 2016a, ApJ, 829, 19
- van Velzen et al. (2016b) van Velzen, S., Anderson, G. E., Stone, N. C., et al. 2016b, Science, 351, 62
- Walker (1998) Walker, M. A. 1998, MNRAS, 294, 307
- Wanderman & Piran (2010) Wanderman, D., & Piran, T. 2010, MNRAS, 406, 1944
- Zauderer et al. (2013) Zauderer, B. A., Berger, E., Margutti, R., et al. 2013, ApJ, 767, 152
- Zauderer et al. (2011) Zauderer, B. A., Berger, E., Soderberg, A. M., et al. 2011, Nature, 476, 425