Study of the performance of the NA62 Small-Angle Calorimeter at the DANE Linac
Abstract
The measurement of with 10% precision by the NA62 experiment requires extreme background suppression. The Small Angle Calorimeter aims to provide an efficient veto for photons flying at angles down to zero with respect to the kaon flight direction. The initial prototype was upgraded and tested at the Beam Test Facility of the DANE Linac at Frascati. The energy resolution and the efficiency were measured and are presented.
1 Introduction
The NA62 experiment at CERN SPS aims to measure the branching ratio of the decay with % precision [1]. The extremely small Standard Model (SM) prediction, [2], sets state-of-the-art requirements for the experimental setup and analysis technique. To reject the background from kaon decay modes with photons in the final state a complex photon veto system consisting of Large Angle Vetoes (LAV), a Liquid Krypton Calorimeter (LKr), an Intermediate Ring Calorimeter (IRC), and a Small Angle Calorimeter (SAC) is used. The charged kaon beam is transported in vacuum till the end of the experimental complex where a dipole magnet deflects it outside the acceptance of the Small Angle Calorimeter. The location of the SAC, downstream of the experimental setup on the axis of the charged beam before deflection makes it exposed to photons with energy above 5 GeV [1].
2 The Small-Angle calorimeter
A prototype of the Small Angle Calorimeter was constructed and tested at CERN during a 2006 test run [3]. It consisted of 70 lead plates and 70 scintillator plates, each with thickness of 1.5 mm (Fig. 1).
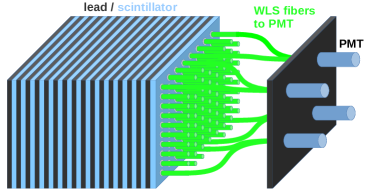
The light was collected by Kuraray 1 mm Y-11(250)MSJ Wave-Length Shifting (WLS) fibers and was read out by four FEU-84 photomultipliers (PMT). Since the scintillator plates are monolithic the four readout channels are optically connected and the SAC should be thought as a single channel detector, where the emitted light due to a single particle is shared among the four PMTs. More details can be found elsewhere [3].
In 2012 a degradation of the PMT performance was noticed. The total collected charge for muons from cosmic rays was an order of magnitude smaller than the expected. The origin for this effect was traced back to possible improper storage conditions. In addition, new estimates of the particle rate expected at the SAC ( MHz) required improvement of the double pulse separation. This could be achieved by using fast PMTs and/or changing the WLS fibers. It was decided to upgrade the prototype by changing the photomultipliers to 25 mm Hamamatsu R6427 [4], which provide ns signal risetime.
The upgraded prototype was shipped to the Frascati Beam Test Facility (BTF) to test its performance.
3 Test beam setup
The Beam Test Facility of the DANE linac at Frascati is a dedicated beam line able to deliver electrons or positrons in a separate hall. The beam can be used for detector testing purposes and/or study of physics phenomena at the energy scale of O(100) MeV. The BTF can deliver up to 50 bunches of per second with energy in the range from 100 MeV up to 840 MeV for and 550 MeV for [5]. Once per second a bunch is sent to a beam monitor for feedback. The bunch length was adjusted to be 10 ns. An important feature of the facility is the possibility to vary the beam intensity from particles down to a single particle per bunch. The latter is extremely important for detector efficiency and energy resolution measurements. The typical size of the beam spot was of the order of 1 cm2 or less.
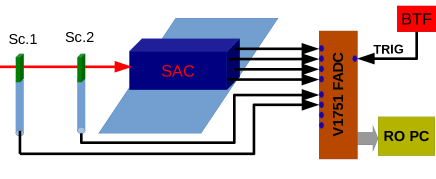
During the study of the response of the SAC the BTF was operated in electron mode and the average number of particles per single bunch was kept close to one. The SAC was placed on a movable table and was adjusted so that the BTF beam impinged on the detector close to its center. Two paddles (Sc.1 and Sc.2) made of plastic scintillator with a thickness of 10 mm were placed in front of the SAC, as shown schematically in Fig. 2. The same paddles had also been used during the measurement of the efficiency of the Large Angle Veto prototypes for the NA62 experiment [6]. The SAC PMTs were operated at 900 V, corresponding to a gain . The four channels of the SAC and the signals from the scintillator paddles were fed into a CAEN V1751 FADC [7]. The digitizer was operated in sampling mode, providing 10 bit amplitude measurement of the input signal amplitude at 1 GS per second. The trigger was based on an external signal from the BTF which allowed to record the waveforms of all the readout channels for every single bunch. The lack of online event selection diminished the possible bias due to inefficiency of a triggering system. The data was transferred to a readout PC through optical fibers.
The digitizer readout of the signals from Sc.1 and Sc.2 provided the possibility to select events with a single electron, based on the signal amplitude and the collected charge by the paddle PMTs.
The results presented use the data from 684759 bunches collected during the test run in the summer of 2013. The energy of the beam was set to 606 MeV and the detector performance was stable during the data taking.
4 Energy resolution
The offline data contained the recorded waveforms of readout signals in a window of 1024 ns. The data from one BTF bunch was written as a single event. The typical signal from the PMTs was contained within 40 ns, with a maximum positioned at about 330 ns from the start of the readout window. For each recorded event the individual PMT charges were obtained by integrating the recorded waveforms after pedestal subtraction. The pedestal was determined on event by event basis using the amplitude measuments preceeding the trigger, to compensate for possible pedestal fluctuations. The total charge in the SAC was calculated as the sum of the charges in the four PMTs.
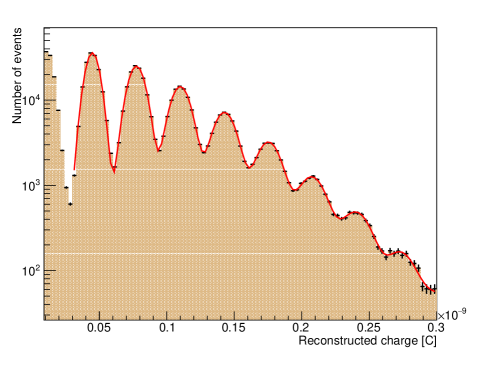
The reconstructed charge distribution is shown with points in Fig. 3. The peaks correspond to 1,2, …, n electrons impinging the detector. A fit to the collected charge with the sum of gaussians plus a constant was performed,
| (1) |
where the is the charge corresponding to electrons in the detector, is the charge resolution and are normalization factors. All the parameters were left free, resulting in a 25 parameter fit, shown with red line in Fig. 3. The data and the model exhibit good agreement.
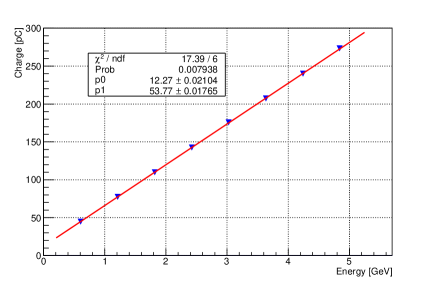
The center of each of the gaussians allows to calibrate the relation between the collected charge and the deposited energy, as shown in Fig. 5. The response of the detector was verified to respect the linearity up to 4 GeV.
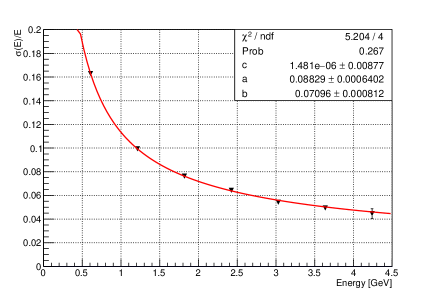
The dependence of the width of the gaussians normalized to the peak position (i.e. the energy resolution, ) as a function of the deposited energy is shown in Fig. 5. It was parametrized, as
| (2) |
where the energy is measured in GeV. The free parameters were determined by fitting the points in Fig. 5, to obtain = (8.8 0.1)%, = (7.1 0.1)%, and = (0 1)%.
5 Efficiency measurement
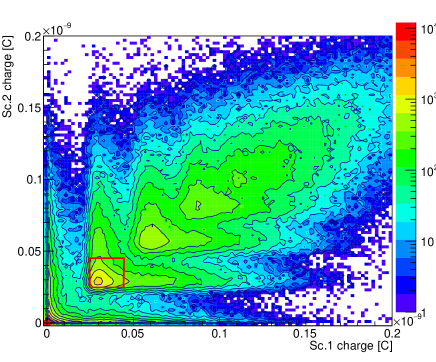
The average number of the electrons per bunch was chosen to be close to 1. However, in the individual bunches the actual number of electrons varied from 0 to 10. To control the electron multiplicity, the signals from the two scintillator paddles were used. The collected charge for each of them was reconstructed on an event by event basis in the same way as was done for the SAC PMTs.
The reconstructed charge in Sc.1 versus the reconstructed charge in Sc.2 is shown in Fig. 7. The islands of events with high population with equal charge in Sc.1 and Sc.2 correspond to the same number of electrons traversing both scintillators. A rectangular region, shown in red in Fig. 7 and defined as 25 pC (Sc.1), (Sc.2) 45 pC, was used to tag single-electron events.
Out of the total sample, 33493 events were selected as single-electron candidates. Their reconstructed charge in the SAC is shown as the filled histogram in Fig. 7. A deposit of a 606 MeV energy in the SAC corresponded to 45 pC collected charge. Most of the events cluster under the single electron peak; however some of them exhibit lower deposited energy.
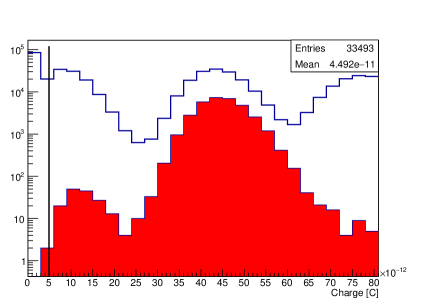
The number of events with reconstructed charge below 20 pC (on the left of the one electron peak) was 161. By assuming that all they are undetected in SAC events, the inefficiency for detecting 606 MeV electrons computes as . All tagged events exhibit reconstructed charge that is above the pedestal, which peaks at zero as can be seen in Fig. 7. The pedestal is defined as the reconstructed charge when no electron hits the SAC. Setting a tentative cut of 5 pC as a minimal detectable charge, no event was found inefficient. This results in an estimation of the inefficiency of the SAC to detect 606 MeV electrons of , at 90% confidence level. The origin of the events between 5 pC and 20 pC was traced back to the impure tagging and the fact that there was no additional shielding employed to protect both the tagging paddles and the SAC itself. Low energy photons and scraping/escaping low energy electrons could therefore reach the tagging paddles and the SAC and contaminate the event sample used for the efficiency estimation. The measured value of is thus interpreted as an upper limit on the SAC inefficiency to detect 606 MeV electrons.
6 Conclusion
The upgraded Small Angle Calorimeter for the NA62 experiment was tested at the Frascati BTF. The detector showed good linearity in response to the deposited energy. The energy resolution was measured to be , with in GeV, with a constant term consistent with zero. In addition, the inefficiency for detecting 600 MeV particles was determined to be less than , where the limit on the method comes from accidental activity in the BTF experimental hall. Currently, the SAC is part of the NA62 experimental complex and serves as an efficient photon veto.
Acknowledgements
We warmly thank the BTF team, P. Valente, B. Buonomo, and L. Foggetta, for the excellent support and the useful discussions during the data taking. We would like also to thank L. Litov for the permission to work with the SAC prototype.
References
- [1] NA62 collaboration, NA62: Technical Design Document, NA62-10-07, http://cds.cern.ch/record/1404985.
- [2] A. J. Buras, D. Buttazzo, J. Girrbach-Noe and R. Knegjens, JHEP 1511 (2015) 033.
- [3] M. Dyulendarova et. al, Meetings in Physics, (2008).
- [4] Hamamatsu photomultiplier tubes R6427, R7056, TPMH1187E04, (1999).
- [5] A. Ghigo et al., Nucl. Instrum. Meth. A 515 (2003) 524.
- [6] F. Ambrosino et al., 2007 IEEE Nuclear Science Symposium Conf. Record, Honolulu, pp. N05-6, arXiv:0711.3398.
- [7] CAEN Mod. 1751, Technical Information Manual, 00105/08:V1751x.MUTx/14 (2015)