revtex4-1Repair the float
All-optical hyperpolarization of electron and nuclear spins in diamond
Abstract
Low thermal polarization of nuclear spins is a primary sensitivity limitation for nuclear magnetic resonance. Here we demonstrate optically pumped (microwave-free) nuclear spin polarization of and in -doped diamond. polarization enhancements up to above thermal equilibrium are observed in the paramagnetic system . Nuclear spin polarization is shown to diffuse to bulk with NMR enhancements of at room temperature and at , enabling a route to microwave-free high-sensitivity NMR study of biological samples in ambient conditions.
pacs:
76.30-v, 76.70.DxThe enhancement of nuclear polarization is of great importance to nuclear magnetic resonance (NMR) experiments, where the primary sensitivity limit is caused by the small thermal population differences of nuclear spin levels. The development of a general nuclear hyperpolarization technique at arbitrary fields would enable measurement of biomolecules and reaction dynamics that were not accessible by present techniques, while decreasing routine NMR measurement times by orders of magnitude Griffin and Prisner (2010). Several approaches to dynamic nuclear polarization (DNP) processes have been demonstrated that enhance nuclear spin polarization; however, the majority are limited to specific fields Jacques et al. (2009); Fischer et al. (2013); Wang et al. (2013); Falk et al. (2015), low temperatures Lee et al. (2016); Kaplan et al. (2015), specific molecules Tateishi et al. (2014), or require microwave irradiation of the sample Tateishi et al. (2014); King et al. (2015). Low temperature is particularly problematic for liquid-state biological samples, where freezing leads to loss of spectral resolution Siemer et al. (2012). Recently, microwave-free optically-pumped DNP (OPDNP) of a diamond containing a high concentration of the negatively-charged nitrogen vacancy center () has been demonstrated Scott et al. (2016); however, the electron-nuclear transfer mechanism is not well-understood.
In this Letter we demonstrate the electronic spin polarization of two paramagnetic nitrogen centers, (substitutional nitrogen [Fig. 1(a)]) and (vacancy with three nearest-neighbor N [Fig. 1(c)]), in a -doped synthetic diamond with an concentration of . Upon illumination, and nuclei proximal to the defect centers are spin polarized, with polarization enhancement of over thermal equilibrium observed. Nuclear spin polarization is shown to diffuse to the bulk , leading to microwave-free OPDNP enhancements of at room temperature and at . We propose a possible spin polarization mechanism supported by ab initio calculations.
Sample – The sample was grown by the high temperature high temperature (HPHT) method described in Green et al. (2015), with approximate concentrations of and
. The sample was treated with high energy () electron irradiation and HPHT annealing at to produce , and N-N nearest-neighbor pairs. See Supplemental Material for further detail 111See Supplemental Material at http://abc for sample details, EPR spectra with differently-oriented magnetic fields, and model details including energy level structures for and ..
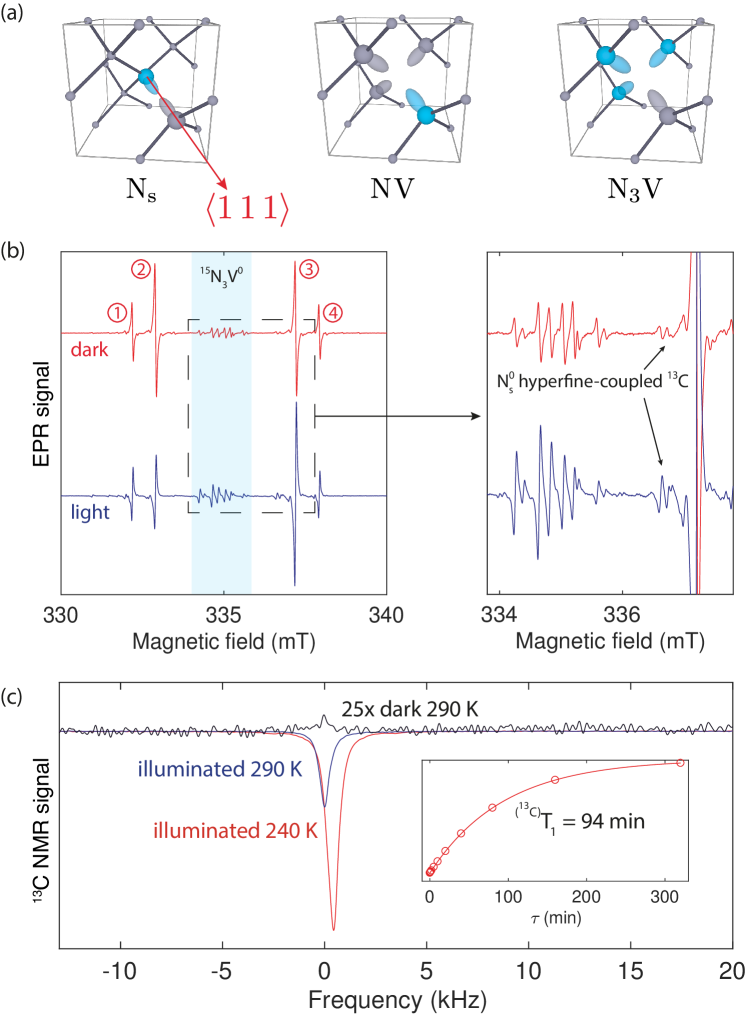
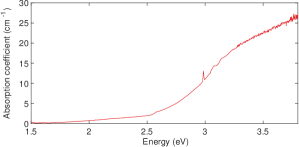
Results – and centers in diamond each possess a \hkl<111> symmetry axis [Fig. 1(a)], and thus have four symmetry-related orientations. Both centers are in the ground state (GS). The use of () during synthesis greatly simplifies the electron paramagnetic resonance (EPR) spectra [Fig. 1(b)] compared to () due to the lack of nuclear quadrupole interactions van Wyk and Loubser (1993); Green et al. (2017).
At temperatures below approximately , in-situ optical illumination results in electron spin polarization of both paramagnetic centers in field-parallel and non-field-parallel orientations [Fig. 1(b)]. The constituent nuclei are spin polarized, as are proximal ( abundance). The spin polarization mechanism is orientation-dependent Note (1), and most efficient with (symmetry axis of one orientation).
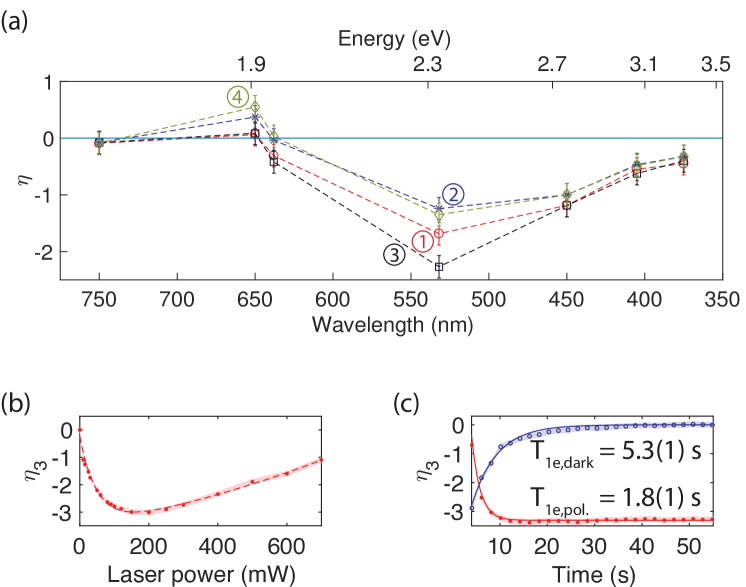
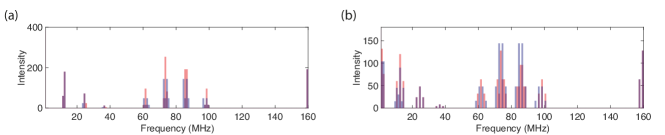
EPR enhancements up to a factor of were measured using at () and a sample temperature of . The polarization excitation mechanism is highly broadband, with electron and nuclear enhancements measured for () [Fig. 2(a)]. As the optical power is increased, the polarization saturates before decreasing [Fig 2(b)]: it is postulated that this decrease can be accounted for primarily by a mixture of sample heating and photoionization of .
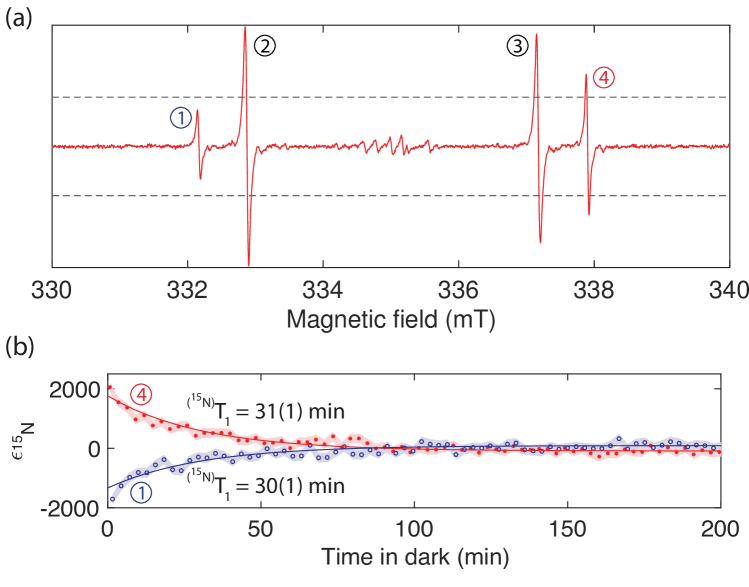
nuclear polarization persists after optical excitation is removed, and is strongest in the field-parallel orientation where , are eigenstates of the spin system [Fig 3]. The difference in relaxation timescales for the electron and nuclei allows the spin to be indirectly read-out using the electron. Immediately following the removal of illumination the ratio of observed nuclear polarization to thermal equilibrium, , was measured as , corresponding to of electron thermal polarization: sequential measurement of the spectrum reveals a nuclear lifetime .
Single-shot NMR measurements collected with the sample under in-situ optical illumination at () indicate that the nuclear spin polarization extends beyond the local nuclei and into the bulk [Fig.1(c)]. The characteristic time for this process is , too slow for an electronic process, and hence is proposed to be mediated by nuclear spin diffusion from the polarized shell around the paramagnetic centers. Bulk OPDNP enhancements of were measured at room temperature, and at , leading to experimental speed-up factors of and , respectively. An additional factor of 2 is gained by the reduction in spin-lattice relaxation to .
Discussion – Two distinct processes can be identified in this sample under illumination: the generation of (electron and nuclear) spin polarization; and the transfer of that polarization out to bulk nuclei. Initially we will not consider how the spin polarization is generated, and simply deal with its transfer to bulk nuclei. Our EPR measurements demonstrate electronic polarization occurring at and on timescales orders of magnitude faster than the bulk nuclear polarization: we therefore presume that these centers are the source of the polarization.
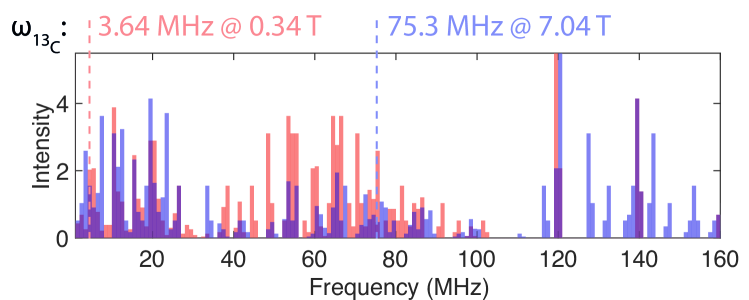
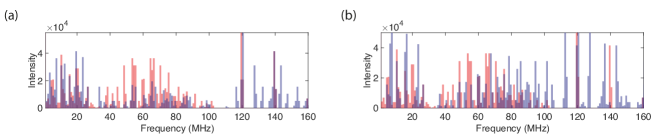
Several mechanisms exist to transfer polarization from electrons to nuclei, though the typical mechanisms encountered in solids (the solid, cross, and thermal effects Hu et al. (2011); Reynhardt and High (1998), and Hartmann-Hahn resonance Knowles et al. (2016)) require microwave driving of the electron spin(s) — absent in our experiments. We observe nuclear spin polarization at both and , and therefore assume that no resonance coupling of the nuclear and electron spins is required for polarization transfer from electron to nuclei. EPR measurements indicate high levels of nuclear polarization local to the paramagnetic center (within three lattice spacings); however, these nuclei cannot efficiently couple to bulk nuclei due to the local field induced by the electron. Electron spin polarization may be transferred to bulk nuclei via a three-spin electron-electron-nucleus exchange process (i.e. in the basis ), with the condition that the difference of the electron resonance frequencies must equal the nuclear Larmor frequency . At and , and , respectively. The spin Hamiltonian values for and Green et al. (2017) are such that a large number of frequencies between and are generated at both field strengths [Fig 4], facilitating polarization transfer out to bulk nuclei. Net bulk polarization will proceed by resonant spin diffusion. This process is sensitive only to the spin Hamiltonian parameters of the interacting defects, and provides a generic route for polarization transfer within dielectric solids.
The above model is sensitive to both the spatial proximity of paramagnetic centers, and also to the spin Hamiltonian parameters of the centers (i.e. the ‘type’ of center). Statistical modeling of relative positions at the present concentrations indicates that between and of defect center pairs have a separation of (see Note (1) for an exploration of model sensitivity to defect center orientation and separation, and magnetic field strength), corresponding to dipolar coupling frequencies of . This distribution of dipolar couplings will yield a population of centers which are difficult to observe in EPR but will generate additional resonance frequencies (and hence ), increasing the probability of meeting the polarization transfer matching condition . Additionally, the small difference in -values between the two defects means these conditions will be met for a large range (approx. to ) of magnetic field strengths.
We turn our attention now to the initial generation of the polarization itself. There have been several reports of OPDNP in diamond, however we are aware of only two reports (from the same group) that study all-optical diamond DNP King et al. (2010); Scott et al. (2016): in both cases the effect is attributed to polarization transfer from . The concentration in the present sample is below EPR detection limits (), even when measured under illuminated (spin-polarized) conditions. Optically-pumped measurements of four other samples, both - and -doped with a range of concentrations [see Table I in Note (1) for details] failed to exhibit any detectable electron spin polarization: thus we do not attribute the present mechanism to and must instead consider the other defects present.
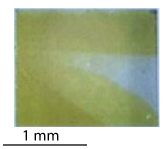
The accepted electronic structure of Note (1) places only one level (of symmetry) in the band gap: thermoconductivity measurements give the ionization threshold at , whereas photoionization is subject to a substantial Stokes shift and starts at approximately Heremans et al. (2009); Isberg et al. (2006). Similarly, the GS of has only one hole (also symmetry), with the excited state transition at Walker (1979). Additional transitions at and are associated with : density functional theory (DFT) studies of suggest they arise from an additional hydrogenic-type state ( + ), yielding another state and potentially enabling high-spin () states Jones et al. (1997). Nevertheless, we expect the optical threshold for to be greater than , contrary to the observed here [Fig. 2(a)]: these limitations preclude the typical internal singlet-triplet intersystem crossing and level anticrossing polarization mechanisms observed in diamond and SiC Delaney et al. (2010); Ivády et al. (2015); Falk et al. (2015). Both (including Felton et al. (2009)) and have been studied extensively under optical excitation Davies et al. (1978); Felton et al. (2008), and no spin polarization of either system has been reported. The other high-abundance defects in this sample (, ) have no reported optical transitions below ; and the optical absorption spectrum of this sample contains only and Note (1).
The simultaneous observation of spin polarization in two well-characterized, optically non-spin polarizable defects suggests a common mechanism. The data allow us to place constraints on such a mechanism: we suppose the same mechanism is responsible for polarization at both and , and therefore is relatively insensitive to magnetic field-strength. Additionally, the mechanism must be capable of spin polarizing electrons and nuclei in multiple systems simultaneously.
Optical illumination at is sufficient to ionize , whereby centers can capture the carriers and become negatively charged, Green et al. (2017). Optical absorption measurements of this sample and concentrations both increase under illumination, suggesting the reverse charge transfer process. This is supported by our DFT calculations (see Note (1) for method details), which predict the adiabatic acceptor level of at below the conduction band minimum (CBM). Under illumination, the sample is therefore in a metastable equilibrium .
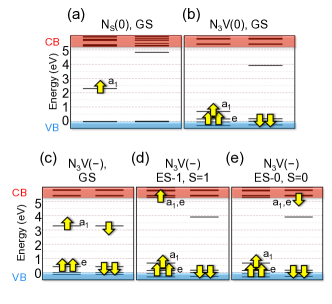
Further ab initio calculations indicate that the CBM states split near the defect due to the perturbation potential of the defect. We find that the excited state of is a bound exciton and includes resonant conduction band states [Fig. 5(a)]. The calculated radiative lifetime of the singlet is about three times longer than that of , thus these states provide a route for differential decay processes. The () can couple to the () excited state by transverse spin-orbit coupling [Fig. 5(b)]. The corresponding spin substates of and are also coupled by transverse spin-orbit coupling.
Upon applying an on-axis (positive) external magnetic field the and states will be slightly and polarized, respectively, due to the asymmetry of the spin-orbit coupling between the different spin states. The asymmetry, and thus the spin polarization, increases with the magnetic field strength (see Note (1) for the parameters used in the calculation). Due to the transverse spin-orbit coupling and the differential decay from the singlet states, the state has a longer lifetime than the state. As a consequence of a possible thermal ionization of the excited state, the electron spin is left spin-up polarized on and a spin-polarized carrier is ejected into the conduction band that can be captured by a proximate defect, thus spin-polarized will form [Fig. 5(c)].
Conclusion – Our results show that optical pumping can induce electron and nuclear polarization in two paramagnetic systems in diamond with very low concentration. NMR measurements with in-situ illumination show that the nuclear polarization diffuses out to the bulk , leading to OPDNP enhancements of up to at . The two systems involved, and , have only states accessible, and hence the standard internal triplet intersystem crossing or level anticrossing mechanisms for solid-state polarization Ivády et al. (2015); Falk et al. (2015) cannot be responsible here. Our DFT calculations have indicated the presence of a previously-unidentified high-spin state in the excited state of . Furthermore, it may be possible for this state emit a spin-polarized current, spin-polarizing proximal defects. Electron spin polarization is transferred to bulk nuclei by anisotropic three-spin exchange, with a large set of frequencies generated by the interaction between and . Our study implies that engineered synthetic nanodiamonds with concentrations designed to maximize the bulk nuclear polarization would provide a general platform for optical hyperpolarization of a target sample, enabling study of new biological and dynamical systems without the requirement for sample shuttling, low temperature or microwave irradiation.
The authors thank H. Fedder, M. W. Doherty, M. W. Dale and C. J. Wedge for helpful discussions. We acknowledge funding from the Engineering and Physical Sciences Research Council (EP/M013243/1 and EP/J500045/1), the Gemological Institute of America, and the EU Commission (FP7 DIADEMS project No. 611143). We thank De Beers Technologies for provision of samples.
References
- Griffin and Prisner (2010) R. G. Griffin and T. F. Prisner, Phys. Chem. Chem. Phys. 12, 5737 (2010).
- Jacques et al. (2009) V. Jacques, P. Neumann, J. Beck, M. Markham, D. Twitchen, J. Meijer, F. Kaiser, G. Balasubramanian, F. Jelezko, and J. Wrachtrup, Phys. Rev. Lett. 102, 057403 (2009).
- Fischer et al. (2013) R. Fischer, C. O. Bretschneider, P. London, D. Budker, D. Gershoni, and L. Frydman, Phys. Rev. Lett. 111, 057601 (2013).
- Wang et al. (2013) H.-J. Wang, C. S. Shin, C. E. Avalos, S. J. Seltzer, D. Budker, A. Pines, and V. S. Bajaj, Nat. Commun. 4, 1940 (2013).
- Falk et al. (2015) A. L. Falk, P. V. Klimov, V. Ivády, K. Szász, D. J. Christle, W. F. Koehl, Á. Gali, and D. D. Awschalom, Phys. Rev. Lett. 114, 247603 (2015).
- Lee et al. (2016) D. Lee, E. Bouleau, P. Saint-Bonnet, S. Hediger, and G. De Paëpe, J. Magn. Reson. 264, 116 (2016).
- Kaplan et al. (2015) M. Kaplan, A. Cukkemane, G. C. P. van Zundert, S. Narasimhan, M. Daniëls, D. Mance, G. Waksman, A. M. J. J. Bonvin, R. Fronzes, G. E. Folkers, and M. Baldus, Nat. Methods 12, 649 (2015).
- Tateishi et al. (2014) K. Tateishi, M. Negoro, S. Nishida, A. Kagawa, Y. Morita, and M. Kitagawa, Proc. Natl. Acad. Sci. U. S. A. 111, 7527 (2014).
- King et al. (2015) J. P. King, K. Jeong, C. C. Vassiliou, C. S. Shin, R. H. Page, C. E. Avalos, H.-J. Wang, and A. Pines, Nat. Commun. 6, 8965 (2015).
- Siemer et al. (2012) A. B. Siemer, K. Y. Huang, and A. E. McDermott, PLoS One 7, e47242 (2012).
- Scott et al. (2016) E. Scott, M. Drake, and J. A. Reimer, J. Magn. Reson. 264, 154 (2016).
- Green et al. (2015) B. L. Green, M. W. Dale, M. E. Newton, and D. Fisher, Phys. Rev. B 92, 165204 (2015).
- Note (1) See Supplemental Material at http://abc for sample details, EPR spectra with differently-oriented magnetic fields, and model details including energy level structures for and .
- van Wyk and Loubser (1993) J. A. van Wyk and J. H. N. Loubser, J. Phys. Condens. Matter 5, 3019 (1993).
- Green et al. (2017) B. L. Green, B. G. Breeze, and M. E. Newton, (2017), arXiv:1702.02959 .
- Hu et al. (2011) K.-N. Hu, G. T. Debelouchina, A. A. Smith, and R. G. Griffin, J. Chem. Phys. 134, 125105 (2011).
- Reynhardt and High (1998) E. C. Reynhardt and G. L. High, J. Chem. Phys. 109, 4090 (1998).
- Knowles et al. (2016) H. S. Knowles, D. M. Kara, and M. Atatüre, Phys. Rev. Lett. 117, 1 (2016), arXiv:1605.07552 .
- King et al. (2010) J. P. King, P. J. Coles, and J. A. Reimer, Phys. Rev. B 81, 073201 (2010).
- Heremans et al. (2009) F. J. Heremans, G. D. Fuchs, C. F. Wang, R. Hanson, and D. D. Awschalom, Appl. Phys. Lett. 94, 152102 (2009).
- Isberg et al. (2006) J. Isberg, A. Tajani, and D. J. Twitchen, Phys. Rev. B 73, 245207 (2006).
- Walker (1979) J. Walker, Reports Prog. Phys. 42, 1605 (1979).
- Jones et al. (1997) R. Jones, J. Goss, P. Briddon, and S. Öberg, Phys. Rev. B 56, R1654 (1997).
- Delaney et al. (2010) P. Delaney, J. C. Greer, and J. A. Larsson, Nano Lett. 10, 610 (2010).
- Ivády et al. (2015) V. Ivády, K. Szász, A. L. Falk, P. V. Klimov, D. J. Christle, E. Janzén, I. A. Abrikosov, D. D. Awschalom, and A. Gali, Phys. Rev. B 92, 1 (2015).
- Felton et al. (2009) S. Felton, A. M. Edmonds, M. E. Newton, P. M. Martineau, D. Fisher, D. J. Twitchen, and J. M. Baker, Phys. Rev. B 79, 075203 (2009).
- Davies et al. (1978) G. Davies, C. Welbourn, and J. H. N. Loubser, Diam. Res. , 23 (1978).
- Felton et al. (2008) S. Felton, A. M. Edmonds, M. E. Newton, P. M. Martineau, D. Fisher, and D. J. Twitchen, Phys. Rev. B 77, 081201 (2008).
All-optical hyperpolarization of electron and nuclear spins in diamond: Supplemental Material
I Production of
The -enriched sample (figure S1) used for EPR and optical studies was grown using the technique described in Green et al. (2015). Post-synthesis, the sample contained mean substitutional nitrogen concentrations of and , respectively. The sample was neutron irradiated to a dose of and subsequently annealed under a non-oxidizing atmosphere for at , before finally being annealed under high pressure at a nominal temperature of for . This processing regime generated a total concentration of and substitutional nitrogen concentrations of and , respectively. The sample was polished in order to remove the seed crystal and to provide a flat reference face (within of \hkl<110>). Inhomogeneities in the uptake of nitrogen during growth are visible in the sample when viewed under a microscope (figure S1).
| Sample | Enrichment | Defect concentration (ppm) | ||||||
| : | NMR measured? | |||||||
| 1 | 5 : | 95 | 25 | <0.01 | 1.6 | 40 | 15 | Y |
| 2 | 5 : | 95 | 125 | N | ||||
| 3 | 5 : | 95 | 120 | 10 | Y | |||
| 4 | 15 : | 85 | 38 | N | ||||
| 5 | 100 : | 0 | 2 | 0 | 30 | Y | ||
Of the five samples measured under the same EPR conditions, three (including the primary sample) were grown simultaneously in the same reaction volume, and hence have the same nitrogen isotopic enrichment (see Table S1): of these, one was measured as-grown, and the other was electron irradiated and annealed to produce before measurements. Samples 4 & 5 were HPHT-grown and natural, respectively.
II EPR of and
Both and are common defects in diamond and have been studied extensively in EPR. The parameters used to generate the frequencies for the spin diffusion model, and for fitting of data for extraction of polarization levels are given in table S2.
III Orientation-dependence of spin polarization
The effect of the observed spin polarization depended strongly on the orientation of the external magnetic field . The effect was strongest with , where all detectable paramagnetic species exhibited both electronic and nuclear spin polarization; and was weakest for , where nuclear polarization was detectable on the and hyperfines of and the primary hyperfines of (see figure S2). Contrast with the “dark” spectrum from [Fig. 1] of main text.
IV The model
IV.1 Electronic structure of &
Due to its role both as one of the most abundant impurities in diamond and its potential as a donor, the electronic structure of has been studied extensively (figure S3). It is well-established from thermoconductivity measurements that the ground state lies approximately below the band gap Farrer (1969). Photoconductivity measurements report cut-on thresholds at approximately Heremans et al. (2009); Isberg et al. (2006). There is some suggestion that may also possess an acceptor level, but the transition energy is approximately and hence cannot be the intrinsic source of the observed spin polarization Jones et al. (2009); Atumi (2014).
The electronic structure of is not definitively known. In the neutral charge state, the ground state and excited state characters ( and , respectively) have been experimentally verified via optical characterization of the N3 transition Runciman (1965); Crowther and Dean (1967) and EPR of the ground state Davies et al. (1978); van Wyk (1982); van Wyk and Loubser (1993). Some confusion has arisen due to the presence of additional optical transitions (N2, N4) which appear to arise at the same center Davies et al. (1978). The N2 transition was associated with by correlation with N3 transition intensity over an order of magnitude in intensity Davies et al. (1978); however, the absorption cross-section is small in comparison to the N3 transition, leading to suggestions that it may arise from a forbidden dipole transition ( in symmetry). It is not clear how to generate these states in the “vacancy-cage” electronic model (explicitly treating only those orbits directly pointing into the vacancy) typically used to treat vacancy-type defects in diamond Coulson and Kearsley (1957); Coulson and Larkins (1971). More recent theoretical analysis suggested the presence of an additional one-electron level outside the vacancy, weakly bound to defect center Jones et al. (1997): the weak N2 transition is then explained by the difference in wavefunction localization between the ground and excited states (see figure S3(b)). Recent experimental results suggest that the N2 and N3 transitions may not correlate in all circumstances Fisher and Fitch (2016). If correct, the additional one-electron level would enable the generation of high-spin states (), which are prohibited in the pure vacancy-cage model. In any case, we note that the threshold energy for the first excited state (N2 () or N3 ()) is too high to explain the optical dependence of the spin polarization behavior (see main text).
Our study of the electronic structure of places the additional state in the conduction band rather than the gap (see next section for methods). The calculated zero-phonon-line (ZPL) of transition is , close to the experimental data at , associated with N3 center. We found optical transitions, that might be observable in absorption, only at higher energies than N3 ZPL energy.
IV.2 Ab initio calculations
Theoretical calculations were performed by using density functional theory (DFT). A 512-atom supercell diamond with of plane-wave cutoff energy and -point sampling of the Brillouin zone was used in the calculations. We applied HSE06Heyd et al. (2003) hybrid density functional which is capable of providing accurate bandgap and defect levels in diamond within to experimentDeák et al. (2010). The electronic transition (zero-phonon line energy) was calculated by the constrained DFT approachGali et al. (2009). The imaginary part of the frequency dependent dielectric matrix which represents the absorption spectrum without excitonic effects were calculated without including local field effectGajdoš et al. (2006). The defect’s charge transition level, i.e. , can be determined by the defect formation energies of the neutral and negatively charged states Zhang and Northrup (1991). The finite-size effects of supercells associated with electrostatic interactions were corrected using the scheme developed by Freysoldt et al.Freysoldt et al. (2009, 2011). We calculated the zero-field splitting parameters associated with the electron spin dipole-dipole interaction using our house-build codeBodrog and Gali (2014); Ivády et al. (2014). In the calculation of the hyperfine coupling constants, the core spin polarization within the frozen valence approximation is taken into accountYazyev et al. (2005); Szász et al. (2013).
IV.3 Model Hamiltonian approach
| Crystal field splitting () | |
| Zero-field splitting in () | |
| Zero-field splitting in () | |
| Spin-spin coupling in () | |
| Axial spin-orbit coupling strength () | |
| Transverse spin-orbit coupling strength () |
In order to describe the triplet excited states of , we used the following model Hamiltonian
| (S1) |
where
| (S2) |
defines the crystal field splitting between the and states whereas
| (S3) |
accounts for the Zeeman splitting of the spin states, where and are the electron -factor and the Bohr magneton, respectively, is the external magnetic field, and is the spin vector operator. Next,
| (S4) |
describes the spin-spin interaction in the state whereas
| (S5) |
describes the spin-spin interactions in the state, where and are the Pauli matrices in the basis of orbital states and of Doherty et al. (2013). Finally,
| (S6) |
describes the spin-orbit interaction in the state, where is the corresponding Pauli matrix in the basis of orbital states and , and
| (S7) |
accounts for the spin-orbit coupling between and states, where , , and and are the eigenstates of and , respectively. Parameters used in the above described model Hamiltonian are given in Table S3. The spin-spin interaction parameters and the – gap were obtained by our ab initio calculations, while the spin-orbit coupling strengths were chosen to be comparable with the known parameters of Batalov et al. (2009).
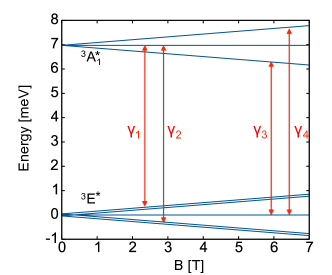
Magnetic field dependence of the eigenstates of our model Hamiltonian is depicted in Fig. S4, where the allowed spin-orbit couplings between and related eigenstates are shown by red arrows. Note that the spin-orbit coupling of the states largely depends on the gap of and . By applying an external magnetic field, the gaps of different spin-orbit coupled pairs vary, thus the mixing of the states varies too. In order to understand the effect of different coupling strengths caused by an applied magnetic field, we consider the state mixing in related branch. For positive magnetic fields, the highest energy state is a mixture of and . The larger the magnetic field is, the smaller the coupling strength , so the mixing of the states is less pronounced. In other words, the state becomes more like with a defined spin projection of . The lowest related state is a mixture of and . For increasing positive magnetic fields the spin-orbit mixing () increases, thus the state loses its character. Using similar arguments, it can be shown that the becomes more like with increasing magnetic field. As a consequence of all of these effects, the becomes slightly polarized. Inverse effects cause slight polarization of . The above described static polarization process depends linearly on the magnetic field strength as long as .
Differential decay process from and can result in different lifetime for and spin and provide a route for dynamical spin polarization processes to cool down the spins in diamond. Here, we have to consider that the triplet excited states either may be ionized or may scatter to the excited singlet states by transverse spin-orbit interaction mediated by phonons. Since the calculated energy levels lie higher than the energy levels, an spin-polarized current is expected to appear because the spin-up polarized states can be ionized with higher probability then the spin-down polarized states. If the electron decays from the excited triplet states to the ground state singlet via spin-orbit scattering and radiative decay then the applied optical pumping will repopulate the excited state singlets. According to our calculation the radiative lifetime of the singlets is about twice longer than that of the singlets. Since the transverse spin-orbit interaction links and and singlets have longer lifetime it has a higher probability that the optical pumping leads to spinpolarization induced by states. Taken as a whole, we calculate that the electron spin of will be spin-up polarized, and the spin-up polarized current will lead to a spin-up polarized neighbor defect.
IV.4 Inter-defect distances for three-spin exchange
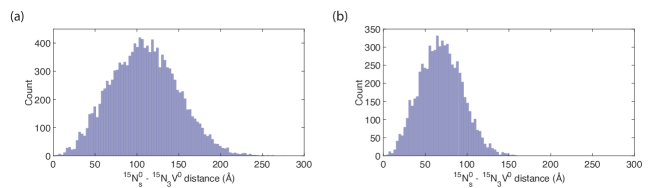
A Monte-Carlo model was constructed in order to estimate the distance between neighboring and defect centers, using the concentrations of and , respectively. The “lattice” was a cube of 1,024 conventional diamond unit cells per side — a total of possible atomic sites. Each was placed randomly in the lattice, and for each the distance to the nearest center was computed: to minimize computation time only the nearest neighbor distance was computed for each center.
Two different defect concentration regimes were computed: , , corresponding to the average distance for the ensemble concentrations measured; and , , to account for the sectors containing the highest nitrogen density (as estimated from the EPR linewidth). The results are given in figure S5.
IV.5 Coupling strengths and orientations
The spin Hamiltonian relevant to our electron-electron-nuclear three-spin system is
| (S8) |
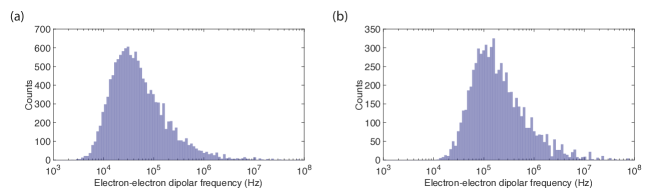
with and for electrons and nuclei, respectively. The values of and for and are given in Table S2. The value of is dependent on electron-electron separation , with the dipolar contribution (expected to be dominant over exchange at these concentrations) dependent on . Using the inter-defect distributions given in figure S5, the corresponding dipolar coupling frequency distribution is generated by
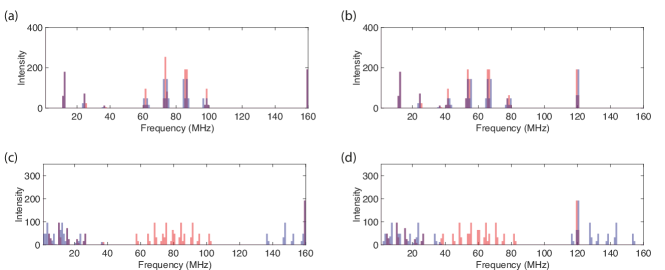
assuming that the -anisotropy is small Schweiger and Jeschke (2001). Both spatial distributions generate a range of coupling frequencies, with approximately of defect pairs in the range ( separation) for the low density distribution, and for the high density distribution (see figure S6). Approximately () of pairs in low (high) density regions have a separation of or less, where the exchange interaction becomes significant compared to dipolar couplings Kortan et al. (2016); Shul’man and Podzyarei (1967).
The spin Hamiltonian parameters for each center are anisotropic (as required by our model Jeschke (1997)), and hence the frequencies generated depends on the relative orientations of the defect pair in question. As each center has symmetry and we consider only , there are only four classes of orientation: both centers parallel to ; one of the pair parallel to ; and neither center parallel to — the frequency contribution of each case is given in figure S7. A distribution of dipolar interaction strengths will increase the generated frequencies and hence increase the likelihood that the polarization transfer matching condition (see main text) is satisfied: the effect of changing is illustrated in figure S8.
IV.6 Polarization efficiency
The efficiency of the polarization mechanism is difficult to estimate: in our measurements, polarization of population is indistinguishable from polarization of population. The sample under study is highly inhomogeneous, with at least three optically distinguishable nitrogen concentrations, and two distinct concentrations visible in EPR spectra (determined by multiple simultaneous linewidths). If the polarization mechanism is dependent on interaction between and then we expect it to occur in only the higher nitrogen sectors (upper limit of the sample). At room temperature no electron polarization is visible in the EPR spectra, and the upper limit on polarization is therefore given by the ratio of the Boltzmann polarizations : enhancements of correspond to an effective homogeneous efficiency of approximately .
V NMR measurements
The static solid state NMR measurements were completed at using a Bruker Avance III HD spectrometer. A low temperature static probe was used to produce an pulse, which was calibrated on . The diamond was mounted into a rotor with the \hkl<111> axis parallel to . The sample was held in place using the optical fiber fixed into the cap position.
VI Charge transfer correction
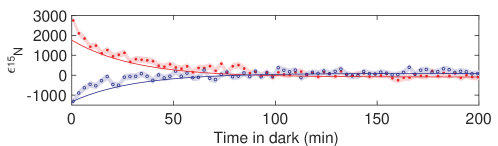
Figure 3 of the main text refers to a correction made for a slow charge transfer process. As detailed in the main text, the light excitation drives charge transfer between and (and potentially other defects). Once the light is switched off, the populations of these centers do not revert immediately back to their pre-light state: there is a fast decay as the light is switched off, and a slow component of the order of minutes. In the nuclear polarization EPR measurement (Fig. 3 of main text), this has the effect of modifying the relative polarization of each line as the experiment proceeds. Each point on the Fig. S10 represents a full EPR spectrum, with the integrated intensities of two lines extracted by fitting. The data in the main text were corrected by normalizing to the total integrated area of each spectrum (and hence population of the defect center at that point in time).
References
- Green et al. (2015) B. L. Green, M. W. Dale, M. E. Newton, and D. Fisher, Phys. Rev. B 92, 165204 (2015).
- Cox et al. (1994) A. Cox, M. E. Newton, and J. M. Baker, J. Phys. Condens. Matter 6, 551 (1994).
- Green et al. (2017) B. L. Green, B. G. Breeze, and M. E. Newton, (2017), arXiv:1702.02959 .
- Farrer (1969) R. G. Farrer, Solid State Commun. 7, 685 (1969).
- Heremans et al. (2009) F. J. Heremans, G. D. Fuchs, C. F. Wang, R. Hanson, and D. D. Awschalom, Appl. Phys. Lett. 94, 152102 (2009).
- Isberg et al. (2006) J. Isberg, A. Tajani, and D. J. Twitchen, Phys. Rev. B 73, 245207 (2006).
- Jones et al. (2009) R. Jones, J. Goss, and P. Briddon, Phys. Rev. B 80 (2009), 10.1103/PhysRevB.80.033205.
- Atumi (2014) M. K. Atumi, First principles simulations of the structure and incorporation of Point defects in diamond, Ph.D. thesis, Newcastle University (2014).
- Runciman (1965) W. A. Runciman, Proc. Phys. Soc. 86, 629 (1965).
- Crowther and Dean (1967) P. Crowther and P. Dean, J. Phys. Chem. Solids 28, 1115 (1967).
- Davies et al. (1978) G. Davies, C. Welbourn, and J. H. N. Loubser, Diam. Res. , 23 (1978).
- van Wyk (1982) J. A. van Wyk, J. Phys. C Solid State Phys. 15, L981 (1982).
- van Wyk and Loubser (1993) J. A. van Wyk and J. H. N. Loubser, J. Phys. Condens. Matter 5, 3019 (1993).
- Coulson and Kearsley (1957) C. Coulson and M. Kearsley, Proc. R. Soc. A Math. Phys. Eng. Sci. 241, 433 (1957).
- Coulson and Larkins (1971) C. Coulson and F. Larkins, J. Phys. Chem. Solids 32, 2245 (1971).
- Jones et al. (1997) R. Jones, J. Goss, P. Briddon, and S. Öberg, Phys. Rev. B 56, R1654 (1997).
- Fisher and Fitch (2016) D. Fisher and A. Fitch, in Diam. Conf. 2016, Univ. Warwick, UK (2016).
- Heyd et al. (2003) J. Heyd, G. E. Scuseria, and M. Ernzerhof, J. Chem. Phys. 118, 8207 (2003).
- Deák et al. (2010) P. Deák, B. Aradi, T. Frauenheim, E. Janzén, and A. Gali, Phys. Rev. B 81, 153203 (2010).
- Gali et al. (2009) A. Gali, E. Janzén, P. Deák, G. Kresse, and E. Kaxiras, Phys. Rev. Lett. 103, 186404 (2009).
- Gajdoš et al. (2006) M. Gajdoš, K. Hummer, G. Kresse, J. Furthmüller, and F. Bechstedt, Phys. Rev. B 73, 045112 (2006).
- Zhang and Northrup (1991) S. B. Zhang and J. E. Northrup, Physical Review Letters 67, 2339 (1991).
- Freysoldt et al. (2009) C. Freysoldt, J. Neugebauer, and C. G. Van de Walle, Phys. Rev. Lett. 102, 016402 (2009).
- Freysoldt et al. (2011) C. Freysoldt, J. Neugebauer, and C. G. Van de Walle, Phys. Status Solidi B 248, 1067 (2011).
- Bodrog and Gali (2014) Z. Bodrog and A. Gali, Journal of Physics: Condensed Matter 26, 015305 (2014).
- Ivády et al. (2014) V. Ivády, T. Simon, J. R. Maze, I. A. Abrikosov, and A. Gali, Physical Review B 90, 235205 (2014).
- Yazyev et al. (2005) O. V. Yazyev, I. Tavernelli, L. Helm, and U. Röthlisberger, Physical Review B 71, 115110 (2005).
- Szász et al. (2013) K. Szász, T. Hornos, M. Marsman, and A. Gali, Physical Review B 88, 075202 (2013).
- Doherty et al. (2013) M. W. Doherty, N. B. Manson, P. Delaney, F. Jelezko, J. Wrachtrup, and L. C. L. Hollenberg, Phys. Rep. 528, 1 (2013).
- Batalov et al. (2009) A. Batalov, V. Jacques, F. Kaiser, P. Siyushev, P. Neumann, L. J. Rogers, R. L. McMurtrie, N. B. Manson, F. Jelezko, and J. Wrachtrup, Phys. Rev. Lett. 102, 195506 (2009).
- Schweiger and Jeschke (2001) A. Schweiger and G. Jeschke, Principles of pulse electron paramagnetic resonance spectroscopy (Oxford University Press, Oxford, 2001).
- Kortan et al. (2016) V. R. Kortan, C. Şahin, and M. E. Flatté, Phys. Rev. B 93, 220402 (2016).
- Shul’man and Podzyarei (1967) L. A. Shul’man and G. A. Podzyarei, Theor. Exp. Chem. 1, 561 (1967).
- Jeschke (1997) G. Jeschke, J. Chem. Phys. 106, 10072 (1997).
- Stoll and Schweiger (2006) S. Stoll and A. Schweiger, J. Magn. Reson. 178, 42 (2006).