Gas Fraction and Depletion Time of Massive Star Forming Galaxies at z3.2: No Change in Global Star Formation Process out to
Abstract
The observed evolution of the gas fraction and its associated depletion time in main sequence (MS) galaxies provides insights on how star formation proceeds over cosmic time. We report ALMA detections of the rest-frame 300m continuum observed at 240 GHz for 45 massive (), normal star forming (), i.e. MS, galaxies at in the COSMOS field. From an empirical calibration between cold neutral, i.e. molecular and atomic, gas mass and monochromatic (rest-frame) infrared luminosity, the gas mass for this sample is derived. Combined with stellar mass and star formation rate (SFR) estimates (from MagPhys fits) we obtain a median gas fraction of and a median gas depletion time ; correction for the location on the MS will only slightly change the values. The reported uncertainties are the error on the median. Our results are fully consistent with the expected flattening of the redshift evolution from the 2-SFM (2 star formation mode) framework that empirically prescribes the evolution assuming a universal, log-linear relation between SFR and gas mass coupled to the redshift evolution of the specific star formation rate (sSFR) of main sequence galaxies. While shows only a mild dependence on location within the MS, a clear trend of increasing across the MS is observed (as known from previous studies). Further we comment on trends within the MS and (in)consistencies with other studies.
1 Introduction
Knowledge of the gas fraction and depletion time of galaxies beyond the peak epoch of cosmic star formation rate (SFR) density, i.e. at redshifts is critical to determine their main mode of star formation and the efficiency of the star formation process. The study of galaxies in this redshift range is especially interesting in the context of potential discrepancies between the relative shape of the dark matter halo gas accretion rate and the measured evolution of the specific star formation rate (sSFR). For example, comparison between observations and predictions from cosmological simulations can test how efficiently accreted gas is incorporated into the gaseous disks and converted to stars, e.g. gas fractions are fairly sensitive to the prescription used for the conversion of cold gas into stars (see recent review by Somerville & Davé, 2015).
The evolution of the gas fraction and depletion time beyond z2.5 is currently less well constrained than at lower redshifts (e.g. the recent compilation by Genzel et al., 2015), as much less objects have their cold gas fraction measured. Studies so far have focused on small samples consisting of lensed galaxies (e.g. Saintonge et al., 2013; Dessauges-Zavadsky et al., 2015) and non-lensed objects (Magdis et al., 2012; Tan et al., 2014) for direct detections. Normal star forming galaxies are observed to form a tight relation in the SFR vs. stellar mass plane that is often referred to as ’main sequence’ (MS) of star forming galaxies (Noeske et al., 2007) whose normalization is a strong function of redshift (for recent determinations at our redshift range of interest, see e.g. Tasca et al., 2015). Recently, Bethermin et al. (2015) extended the analysis to using infrared stacking and Scoville et al. (2016) presented the first direct measurements for galaxies on and off the main sequence out to . These studies provide first important constraints on the gas fraction and depletion time suggesting that star formation in main sequence galaxies, i.e. normal star forming galaxies, proceeds in a similar fashion to low redshift galaxies.
Probing the cold or molecular gas mass directly for main sequence galaxies is very challenging even in the era of ALMA, as the expected strength of the CO emission lines requires long integration times. Furthermore, ALMA can typically only access high-J transitions (CO(3-2) is the lowest transition accessible for such sources) which are more prone to excitation effects and their relation to the bulk amount of molecular gas present is less straight-forward (see, e.g., Carilli & Walter, 2013). The only possibility to quickly assemble sizable samples is to use the large bandwidth available for continuum detections and rely on the observed tight relation between cold dust mass and neutral (i.e. molecular and atomic) gas mass (e.g. Hildebrand, 1983). This gas-to-dust ratio technique can either use the full information from the infrared spectral energy distribution or rely on a direct, locally calibrated relation between the sub-mm dust continuum and the cold gas mass (e.g. Magnelli et al., 2014; Scoville et al., 2014; Groves et al., 2015). In general this method seems to lead to results that are in good agreement with CO-based gas masses (Genzel et al., 2015) and has become increasingly popular (Magdis et al., 2012; Santini et al., 2014; Magnelli et al., 2014; Scoville et al., 2014, 2016; Bethermin et al., 2015). Both methods (via CO line or dust continuum) rely on local calibrations and thus exhibit a dependency on metallicity. Therefore studies of high-redshift galaxies, particular on the low mass end, can be significantly affected by our ability to measure or statistically infer gas phase metallicities (e.g. Bethermin et al., 2015).
The sample, its properties and the data used for their determination are described in §2. The gas mass estimation and results on the gas fraction and depletion time are presented in §3 and discussed in §4. We summarize and conclude in §5. Throughout the paper we assume a cosmology with and (for ease of comparison to other work in the literature) and use a Chabrier initial mass function for the stellar mass and SFR determination.
2 Sample and Data
2.1 Sample Selection
To study the cold gas fraction and the gas depletion time at a redshift of , we selected a sample of massive star forming galaxies in the COSMOS field to be observed with ALMA. Our initial sample selection is based on the phot-z catalog of Ilbert et al. (2013) selecting all sources with good phot-z estimates () in the range , and masses determined by LePhare (Arnouts et al., 1999, 2002; Ilbert et al., 2006) with (corresponding to UltraVISTA magnitudes of (McCracken et al., 2012)). To select star-forming galaxies, we cross-matched our sample with the Muzzin et al. (2013) catalog and selected all objects with a MIPS 24m counterpart of in the Muzzin et al. (2013) catalog, and with standard rest-frame UV-optical colors expected for star forming systems (based on the (IRAC2) color versus Mz). This selection resulted in 73 sources. We added an additional 13 objects with spectroscopic redshifts in our redshift and stellar mass range from a preliminary analysis of the VIMOS Ultra Deep Survey (VUDS, Le Fevre et al., 2015) that matched our star-forming requirements, resulting in a total of 86 potential target galaxies.
For the analysis presented here we updated the photometry and redshift determination of this initial sample based on the COSMOS2015 catalog of Laigle et al. (2016). This catalog includes new imaging from the UltraVISTA DR2 release, band imaging from Hyper Suprime-Cam and deeper SPLASH data at 3.6 and 4.5m (SPitzer Large Area Survey, PI: Capak; Steinhardt et al., 2014). The photometric redshifts are determined using the template-fitting LePhare code based on the updated photometry using the fluxes computed within 3″ apertures. (Furthermore, we remeasured the MIPSm and PACSm fluxes; see §2.3 for details.)
For 22 sources of our initial sample, spectroscopic redshifts with high quality (flag % probability of being correct) exist to-date, 15 from VUDS (Le Fevre et al., 2015) and 7 sources mainly from zCOSMOS-deep (Lilly et al., 2007). For these sources we use the spectroscopic redshifts instead of the photometric ones, which are consistent in all but 2 cases. With these new redshifts, 7 of our original 86 sources have . Excluding these sources, the median redshift of our sample is with the highest redshift being .
2.2 ALMA Data
The 86 target fields were observed as part of an ALMA Cycle 2 program (2013.1.00151.S, PI Schinnerer). The observations were optimized for continuum detections at 240 GHz (corresponding to 300m rest-frame at the median sample redshift of ) using the correlator in TDM mode with the four spectral windows centered at 231 GHz, 233 GHz, 247 GHz, and 249 GHz yielding a total bandwidth of 7.5 GHz. The target fields were observed with typically 38 antennas between 25 and 30 of December 2014 for a total of 2.0min on-source integration time, with 24 fields receiving an additional 0.5min on-source time. The quasar J1010-0200 served as phase calibrator in all observations, for bandpass and flux calibration J1058+0133, J0750+1231, J0854+201, J0825+0309, J1037-295, Ganymede, and Callisto were observed. We used the calibrated data products provided by the ALMA project. The resolution and rms achieved is 1.8”1.1” (1.7”1.1”) and 66 (71) Jy/beam for the 24 (62) fields with (without) additional observing time when using natural weighting. We CLEANed all four spectral windows together using the ’mfs’ mode down to 3 without setting a CLEAN box and using up to 1,000 iterations. The final images cover an area of 39”39” with a pixel size of 0.18”, sufficient to encompass the primary beam FWHM of 23” at 240 GHz.
2.3 Stellar Mass and Star Formation Rate (SFR) Estimation
Due to the up-dated redshift information for about 25% of our objects and the better photometry available, we re-determined the stellar mass and SFR for each ALMA target. Given the expected large amounts of gas and dust present in our targets, we cannot rely on the UV emission alone to estimate the SFR due to the large, uncertain correction factors required. For all objects 24m and 100m fluxes or upper limits were extracted from the Spitzer/MIPS 24m map from Le Floc’h et al. (2009) and the Herschel/PACS 100m image from Lutz et al. (2011) using the PSF fitting method of Magnelli et al. (2013) to simultaneously search for emission associated with the position of our targets, while also accounting for the flux from all known 24m sources around it. This careful de-blending is in particular necessary for sources #26250, #26318 and #26388 as well as #226676 and #226748 which lie close together (within , but still apart at 24/100m resolution). This resulted in a significant fraction () of targets without 3 MIPSm detections irrespective of the source being ALMA detected or not. Only six sources are detected in the PACSm image above 3, half of these are detected by ALMA as well. This low detection rate is consistent with the depth of the PACSm image and the anticipated SFR of our targets.
Stellar masses and star-formation rates for the full sample are determined by fitting the available photometry within a 3” aperture (from the catalog of Laigle et al., 2016), including our measured IR+ALMA fluxes and assuming the best available redshifts, with the MagPhys code (da Cunha et al., 2008)111In particular, we use the Bruzual & Charlot (2003) stellar libraries and the latest ”high-z” version of the code available at http://www.iap.fr/magphys/magphys/MAGPHYS.html.. Non-detections by ALMA (see §3.1) are treated as upper limits. All PACSm photometry is also used as upper limits due to their low S/N ( in case of the detections) and potential confusion due to their low resolution. The MIPSm data photometry was excluded from the fitting due to the highly uncertain SEDs for star forming galaxies and potential contribution from an AGN.
Stellar masses determined with MagPhys are consistent (barring a systematic 0.2 dex offset) with LePhare-based estimates in Laigle et al. (2016) for 90% of the sample, and are independent (within uncertainty) of the inclusion of the IR+ALMA data. Both UV and IR fluxes are used for our SFR measurements. When IR+ALMA photometry is excluded, SFRs are lowered by 0-0.5 dex, indicating that significantly obscured star forming regions play a role in several of our sources. The use of the Bayesian SED fitting code MagPhys allows us to include both these buried populations as well as the uncertainty of the IR SED which is mainly constrained by the PACSm upper limits and ALMA data points. We remind the reader that the optical/NIR data also provide a constraint though the rest-frame UV-optical shape to indicate possible extinction as indicated by the small offset mentioned above between the fits with and without the inclusion of the IR+ALMA data (though extremely heavily obscured young stellar populations are only constrained by the IR SED). We verified that our average SFR is consistent with the mean and median SFR determined from the stacked IR SED (see §3.1). Moreover, the resulting average SED obtained via MagPhys agrees very well with the stacked SED. While the SFRs of individual sources will suffer from the usual (systematic) uncertainties that are unavoidable for sources with poor sampling of their rest-frame infrared to sub-mm SED, the average SFR of our sample is hence robustly determined.
We have also identified 12 possible AGN in our sample by cross-matching with the Chandra COSMOS Legacy survey (Civano et al., 2016), and through a mid-IR excess (i.e. red [4.5]-[5.8] and [5.8]-[8.0] colors, e.g. following the methodology of Lacy et al., 2007). Mid-IR excess AGN were identified via offsets in the IRAC photometry (in particular at m) compared to the fitted MagPhys SED, which could not be reproduced by any reasonable stellar SED. Two sources have clear (e.g. ) X-ray detections, while six more have weak X-ray detections, which we also classify as AGN. Seven sources have noticeable IR excesses, three of which also have X-ray detections.
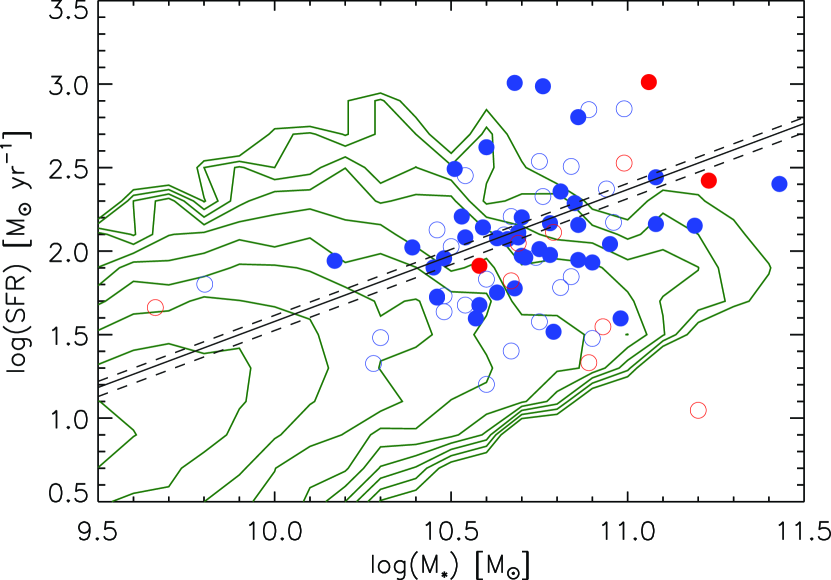
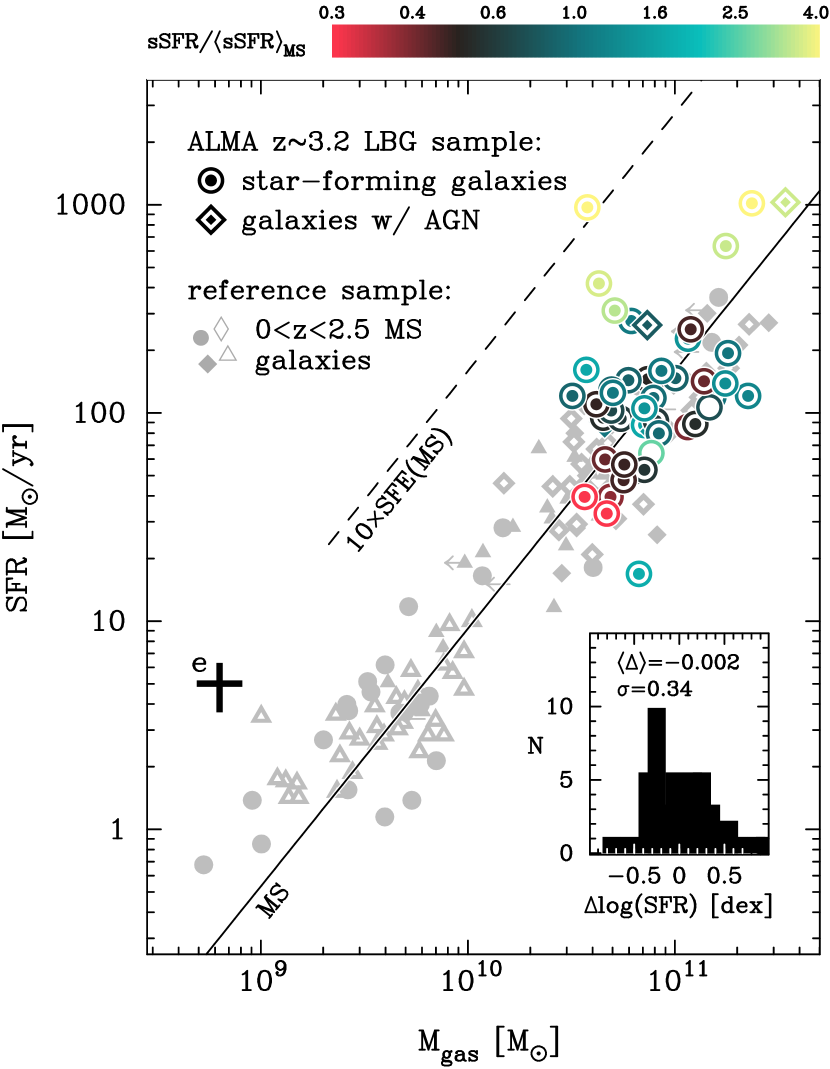
In Fig. 1 we show the location of our z3.2 sample in the SFR vs. plane with respect to the location of the ’main sequence’ of star forming galaxies at redshift (Magdis et al., 2010; Lee et al., 2010; Heinis et al., 2014; Bethermin et al., 2014; Tasca et al., 2015; Schreiber et al., 2015; Tomczak et al., 2016)222In the compilation of main sequences used by the 2-SFM framework (Sargent et al., 2014) and up-dated with recent sSFR measurements (Heinis et al., 2014; Schreiber et al., 2015; Steinhardt et al., 2014; Bethermin et al., 2014; Tasca et al., 2015), galaxies with stellar masses of (the typical mass of our sample galaxies) show no evidence for an evolution of their sSFR values for and have an average sSFR of with an rms dispersion of 0.13 dex. This is in good general agreement with other sSFR compilations (e.g. by Speagle et al., 2014). Our ALMA detections sample the main sequence at high stellar mass () and are not biased towards a particular SFR range ().
3 Results
3.1 240 GHz Continuum Detection and Gas Mass Measurements
For the detection of sources in our 86 target fields we use the source extraction software of Karim et al. (2013) that was developed for continuum source extraction in ALMA imaging data. The software automatically identifies sources at and determines the flux based on a comparison of a three (assuming an unresolved source) and six parameter (assuming a resolved source) Gauss fit in the image plane. A total of 47 of our 86 targeted sources are detected at or above 3 (for the peak), with 45 (52%) lying at a redshift of . We use the integrated fluxes from the 6 parameter fit and verified that it gives consistent results for unresolved sources. We further tested that Gaussian fits at the position of the optical/near-IR sources result in similar values. For the ease of comparison of serendipitous detections in our target fields in future work we use the values provided by the blind extraction software.
Based on the completeness tests done by Karim et al. (2013) up to 5% of our detected sources (corresponding to 2 sources) could be spurious for a full sample of blind detections. Given that we are searching at predetermined positions, the probability is even lower, as our fields contain about 350 independent beams, so the chance that a spurious source would end up in the center is about 0.3% (if there is one source per field). The typical number of sources detected per field is about 7, thus there is a 2% chance that such a source would end up at the position of our targeted objects. Therefore we are confident that all our detections are real.
To convert the observed 240 GHz flux density into a cold gas mass, we make use of the observed relation between cold dust luminosity and gas mass (similar to, e.g., Scoville et al., 2014, 2016). Recently, Groves et al. (2015) calibrated relations between mono-chromatic IR luminosities at 250, 350 and 500 m and neutral (atomic plus molecular) gas mass using high quality observations for 36 local galaxies from the KINGFISH survey (Kennicutt et al., 2011). These calibrations implicitly include the effects of metallicity through the variation within the calibration sample. The calibration between monochromatic luminosity and gas mass becomes steeper and has larger scatter at shorter IR wavelengths because of the effect of dust temperature, and its correlation with stellar mass and metallicity. Here we adopt the relations for the high-mass sample, i.e. at rest-frame 250 and 350 m (see Tab. 6 Groves et al., 2015) and linearly interpolate the coefficients to match the observed rest-frame wavelengths:
| (1) |
where
| (2) |
and
| (3) |
As discussed by Groves et al. (2015) the mono-chromatic IR luminosity relations are similar to other methods advertised such as, e.g., the calibration of the 850 luminosity by Scoville et al. (2014, 2016). We verified that gas masses derived using the Scoville et al. (2014) prescription are consistent with our results within the (systematic) uncertainties. The metallicities of high redshift galaxies are highly uncertain given the changes in the physical properties in these galaxies (see e.g. Kewley et al., 2013, 2015). Thus we assume that the metallicities of massive galaxies at our epoch of interest are broadly consistent with local objects of similar masses. However, there are suggestions that the metallicities of massive galaxies have increased since z3 to now, with suggestions of around a factor of 2 (e.g. Maiolino et al., 2008; Troncoso et al., 2014; Onodera et al., 2016). If this is the case our determinations for the gas mass of our sample are likely underestimated (by approximately 0.3 dex), as we overestimate the metallicity and hence the Dust-to-Gas ratio in our detected sample. Note that the presumably higher dust temperature for galaxies at our redshifts (e.g. Genzel et al., 2015; Bethermin et al., 2015) compared to the local sample could counteract such a systematic trend.
As a further confirmation, we also derived the average gas mass of our detected sources in the redshift range z=2.8 to 3.7 through determining the gas mass from stacking of the (Spitzer and Herschel) infrared data centered on our detected source positions. We use the methodology of Magnelli et al. (2014) as used for Genzel et al. (2015), i.e. a modified Draine & Li (2007) model is fitted to the IR data points plus the average 240 GHz ALMA flux density, providing a mean dust temperature and dust mass for the sample. The average dust mass obtained with this approach is then converted into a gas mass by applying the metallicity dependent dust-to-gas ratio for star-forming galaxies found by Leroy et al. (2011). The average metallicity of our detected sources is derived using the stellar mass-metallicity relation at their average redshift as found in Genzel et al. (2015). Comparison of the average metallicity of our detection sample based on the Genzel et al. (2015) prescription (which uses the mass-metallicity relation of Maiolino et al., 2008) yields very similar results (within dex) as more recent determinations of the mass-metallicity relation (e.g. Troncoso et al., 2014; Onodera et al., 2016).
The mean gas mass derived from the fit to the stacked infrared SED of (with a full accounting of the potential effect of the mass-metallicity relation) is remarkably similar to the mean gas mass from the mono-chromatic approach of . We take this as an indication that no strong systematic biases are present between results from these two approaches when comparing the same high-mass objects.
For the subsequent analysis we restrict the sample to objects with ALMA detections in the redshift range of z=2.8 to 3.7. These objects have a robust determination of their SFRs due to the inclusion of the ALMA fluxes, as our re-measuring of the IR photometry for all objects sometimes led to a significant change in the MIPSm flux. These 45 objects sample fairly well the SFR versus stellar mass plane (see also Fig. 1), and have a mean redshift of z=3.2, a mean stellar mass of and a mean SFR of . The average specific SFR (sSFR) of our sample is , so our sample lies close to the main sequence at the mean redshift of our sample (with a median offset of -0.04 dex, i.e. very slightly below the MS, but well within the MS scatter).
3.2 Gas Fraction and Gas Depletion Time
In the following we combine the estimates of stellar mass, SFR and gas mass for our 45 detections at to study the evolution of the gas fraction, defined as and gas depletion time, defined as . We compare our measurements to lower redshift results available from the literature as well as empirical predictions for main sequence galaxies (at our target redshift) from the 2-SFM model (Sargent et al., 2014). The 2-SFM predictions are based on (a) a log-linear, redshift-independent star-formation law (calibrated for MS galaxies) relating SFR and molecular gas mass, and (b) the observed redshift-evolution of the specific SFR of main sequence galaxies. We remind the reader that values derived for individual galaxies have significant uncertainties and might suffer from systematic uncertainties. However, given the independent cross-checks on the average properties done in §2.3 and 3.1, we expect that average trends described in the following are robust.
3.2.1 Relevance of Being on the main sequence of Star Forming Galaxies
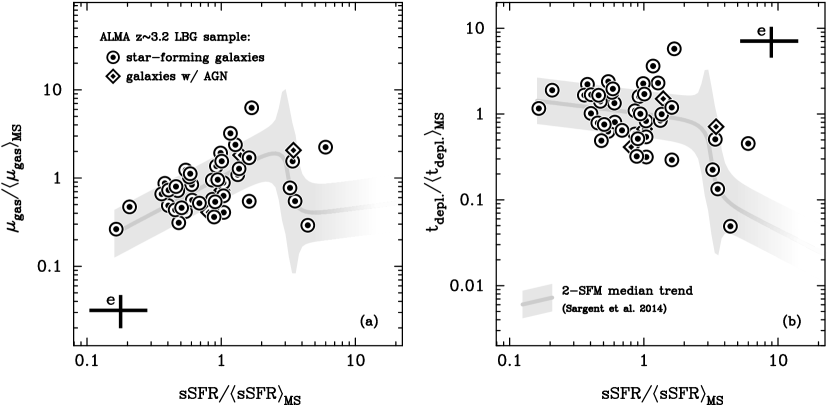
In Fig. 2 (a) we show the deviation of the measured gas fraction relative to the expected333Given the stellar mass of an average MS galaxy its SFR is determined by the sSFR-evolution of MS galaxies. The (molecular) gas mass of this galaxy is given by the trend line of the integrated relation in Fig. 5. The stellar and gas masses have then been combined to form the expected gas fraction if a ‘typical’ MS galaxy. gas fraction () of a star forming galaxy located exactly on the mean main sequence locus. Gas fractions are predicted (grey shaded areas in Fig. 2) to vary significantly as a function of offset from the main sequence. In keeping with expectations, we do see a trend in our data that galaxies below the main sequence, i.e. with lower SFR for a given stellar mass, exhibit a lower gas fraction while galaxies above the main sequence have a higher gas fraction. Over the range of specific SFR probed by our galaxies ( or from 20% to 500% of the main sequence value), their gas fractions range over 1.5 dex (from to 600% of the average main sequence value). This trend is consistent with the 2-SFM predictions, thus implying a close correlation between SFR and as observed in galaxies.
A similar plot is shown for the deviation of the depletion time relative to the average depletion of the main sequence in Fig. 2 (b). As expected from the correlation seen in Fig. 2 (a), the variation as a function of distance from the main sequence is less pronounced for sources with values less than three times the MS value. Again, the data mainly follow the predicted trend from the 2-SFM model, also for sources in the transition to the starburst regime. The scatter for and is consistent with that seen at lower redshift used to predict the 2-SFM distribution. No obvious differences in the distribution of star forming galaxies and galaxies potentially hosting an AGN can be seen for either quantity.
A clear link between and sSFR has already been reported for local and high redshift (z) galaxies (e.g. Saintonge et al., 2012; Magdis et al., 2012; Bothwell et al., 2014; Genzel et al., 2015; Dessauges-Zavadsky et al., 2015). Our data suggests that the steep trend in with sSFR reported in the literature (e.g. Saintonge et al., 2011b; Genzel et al., 2015; Dessauges-Zavadsky et al., 2015) could at least partially be due to the transition to more starburst-like objects as indicated by the 2-SFM model predictions and the distribution of our few sources. As the transition region in the 2-SFM model encompasses about 1 orders of magnitude and small errors on the sSFR determination could lead to large scatter, dedicated high quality observations will be required to further test this.
3.2.2 Time Evolution
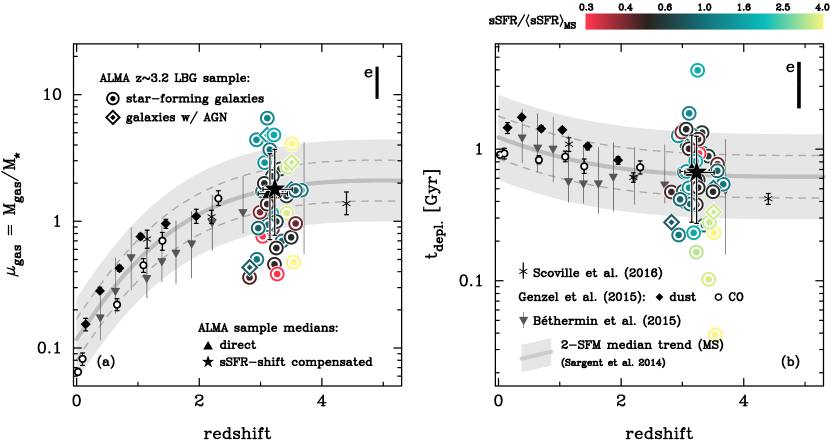
We compare the gas fraction for our sample to the predicted evolutionary trends from the 2-SFM model as well as literature values for larger samples (Genzel et al., 2015; Bethermin et al., 2015; Scoville et al., 2016) in Fig. 3 (a). Comparison to literature values from large samples shows that our results are in very good agreement with the findings of Genzel et al. (2015), and Bethermin et al. (2015). Our galaxies are also consistent with the average MS values of Scoville et al. (2016, their Tab. 2). The median value of our z=3.2 sample of (filled black triangle; uncertainties are 1 error on median) and the one compensated for the MS off-set of our sample of (filled black star; uncertainties are 1 error on median) are consistent with the expected flattening of the curve at in the 2-SFM model (Sargent et al., 2014). The data point of Scoville et al. (2016) falls slightly below the 2-SFM model line. As Scoville et al. (2016) also include non-detections in their average values (unlike Genzel et al., 2015, for the CO line measurements), this could point to a certain biasing of the results when only detections are considered (however, see the stacking data points from Bethermin et al., 2015) or be due to small number statistics (Scoville et al., 2016, include only 6 galaxies in their measurement).
Our objects show a trend of gas fraction with specific SFR (as highlighted by the symbol color used in Fig. 3 and expected from § 3.2.1) covering more than one order of magnitude at z3.2. An exception are those galaxies that lie more than above the MS and do not follow the same trend due to their significantly different or star formation efficiency () compared to MS galaxies. Our three AGN host galaxy candidates follow the overall trend of the remaining 42 galaxies.
This demonstrates how sensitive gas fraction measurements are on the range of SFRs sampled and illustrates how varying selection criteria in different studies may produce discrepant results. Sources located below the main sequence of star forming galaxies, i.e. with SFR lower than the median galaxy, will bias the gas fraction toward lower values. It also underlines the importance of a good (or at least consistent) determination of the SFR when comparing different surveys or in other words the strong relation between and SFR strongly affects the interpretation of . Our objects closest to the main sequence (color-coded dark green to black) typically lie closest to the expected value of , but they still show a significant scatter suggesting that the intrinsic gas fraction for galaxies on the main sequence has a wide distribution. (Note that some of the scatter is also due to the fact that our galaxies sample a range of stellar masses with different average gas fractions; see Fig. 4.) Larger samples are required to confirm this behavior.
Comparison of the gas depletion time of our sample to the 2-SFM model trend (Sargent et al., 2014) and literature values for larger samples is presented in Fig. 3 (b). The median direct and compensated values of our z=3.2 sample of and (uncertainties are 1 error on median) are fully consistent with the trends and values of Genzel et al. (2015) and Bethermin et al. (2015) which also follow the trend predicted by the 2-SFM model. According to data and model, may approach a plateau of for MS galaxies at . Again, the mean values of the MS galaxies from Scoville et al. (2016) are fully consistent with the other data, with the exception of the data which tends to values lower than predicted by the 2-SFM model, but still consistent within the expected scatter.
Our objects show no clear trend with specific SFR (as expected from §3.2.1) over almost two orders of magnitude at z3.2. An exception are the objects that lie more than above the main sequence that all exhibit depletion times of 300 Myr and less. It is interesting to note that our scatter is similar to that from the IR stacking analysis by Bethermin et al. (2015). This suggests that in addition to potential sample selection biases (fraction of starburst-like sources), a large intrinsic scatter could contribute to variations between different studies.
3.2.3 Trends with Stellar Mass
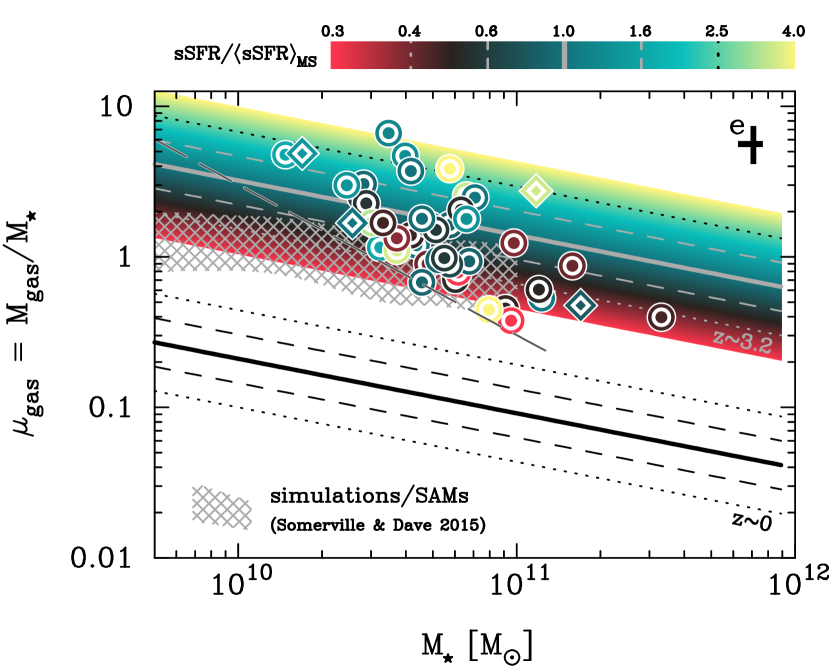
The gas fraction is slightly anti-correlated with stellar mass for our z=3.2 sample as shown in Fig. 4. Our galaxies agree well with the general predicted trend by the 2-SFM model (Sargent et al., 2014), but they reveal an apparently steeper slope of that is likely an artifact created by our detection limit (see long-dashed diagonal line in Fig. 4).
At fixed stellar mass, galaxies with high gas fractions are on average expected to correspond to MS galaxies well above the mean MS locus according to the 2-SFM framework (see colored band in background of Fig. 4). In Fig. 4 we have colored our ALMA detections according to the actual (s)SFR-offset with respect to the MS. While there is an overall, broad agreement between expected and actual location of our data in Fig. 4 (in the sense that high-sSFR galaxies lie above the average vs. trend and low-sSFR galaxies below), the fact that the color of the individual symbols and the background color scheme do not match up perfectly evidences a non-neglible scatter of the SFR vs. relation. We will discuss this further in § 4. Note that galaxies with have gas fractions similar to the average MS galaxy with identical mass due to their enhanced star formation efficiency (or lower ; see also Fig. 2). It is interesting to note that most of the galaxies are below the MS and also have the lower expected for objects with lower sSFR than the MS. However, the overall scatter is consistent with the range expected from the MS range probed by our galaxies.
Comparison of the trend from the 2-SFM model and our data to predicted relations from cosmological simulations and semi-analytical models (SAMs) compiled by Somerville & Davé (2015) shows that the observed gas fraction is typically a factor of higher. The dependence of on is probably stronger than seen in the cosmological models, though results appear to be very sensitive to the exact MS location of the sample studied. Our AGN host galaxies cover no preferred parameter space. A similar trend of is seen locally (Saintonge et al., 2011a; Bothwell et al., 2014) and also at higher redshift (e.g. Genzel et al., 2015; Dessauges-Zavadsky et al., 2015). No trend is obvious in our data when plotting against . Since our data cover the same parameter space as the star forming galaxies compiled by Dessauges-Zavadsky et al. (2015, their Fig. 9) this might be an effect of our limited stellar mass range probed.
4 No change in global star formation process out to
The results from section §3.2 for and are (i) a redshift independent dependance on sSFR and (ii) a flattening of the redshift evolution at . They imply that our z3 massive star forming galaxies follow the relation between SFR and gas mass (i.e. the Schmidt-Kennicutt relation) established for lower redshift galaxies. This relation is one key ingredient in the 2-SFM prescription (see Sargent et al., 2014). Placing all our detections onto the SFR vs. gas mass plane (Fig. 5) shows that the z3 MS galaxies occupy the same space as lower redshift objects at . The amplitude of the scatter of our sample restricted to from the MS location (see inset in the bottom right corner) is about 1.7 larger than that observed for the reference MS samples (of 0.20 dex). It is interesting to note that there is a slight trend with MS location: galaxies well below the MS have a higher depletion time (or lower star formation efficiency) than objects well above the MS that typically have a lower (or higher star formation efficiency) than objects close to the MS. This is consistent with the trend seen in Fig. 2 b. The larger scatter in SFR is mainly caused by galaxies in the transition to starburst objects. The AGN host galaxies fall within the scatter of our star forming galaxies. The mean MS values of Scoville et al. (2016) are also consistent with the location of our data points.
Our MS galaxies follow the Schmidt-Kennicutt relation as determined through the fit by Sargent et al. (2014). This explicitly means that a single star formation prescription or ’law’ describes the relation between molecular gas mass and star formation activity out to – at least for MS galaxies. This was already concluded by Bethermin et al. (2015) from their IR stacking analysis.
The proposed redshift evolution of Saintonge et al. (2013) for of (their Eq. 10) of (for their ) is inconsistent with our median of 0.67 Gyr by a factor of . In the equilibrium framework developed for the bath tub or reservoir model, it is assumed (Davé et al., 2011). As the literature and our data all probe roughly MS galaxies with similar stellar masses of a few times , the dependence should simplify to (e.g. Davé et al., 2011). Based on the data available it seems that this assumption is not valid or no longer valid at . For the situation is less clear as our preferred redshift-independent dependence of on sSFR from the 2-SFM framework gives values consistent with (see, e.g., Fig. 11 of Saintonge et al., 2013). As this equation is one of the equilibrium relations proposed by Davé et al. (2011) this implies that sSFR might evolve less strongly with redshift than assumed, i.e. a shallower evolution than expected from cosmic inflow driven by gravitational infall (Davé et al., 2011) or the assumption of is not correct implying that the relation between galaxy and halo mass would evolve. Similarly, the trends for () determined by Genzel et al. (2015) are not consistent at with the measurements for our MS galaxies. In any case observations at redshifts higher than are required for a more definite answer.
An interesting consequence of the fairly constant and at is the implication that the evolution in the cosmic star formation rate density at for the high mass systems studied here is then driven by the number density of such star forming systems and not a change of the gas reservoir available. This is in contrast to the explanation for the observed strong decline in the cosmic star formation density at where Karim et al. (2011) argue that a decline in the cold gas reservoir is the root cause as the number density of (massive) star forming systems does not change. This might imply that we see the transition from the epoch of galaxy formation (at high z) to the epoch of star formation (at low z). The observed strong evolution of the UV luminosity function at (e.g. Bouwens et al., 2015) suggests that the drop in the cosmic SFRD at these redshifts might be due to a combination of a decreasing number density of star forming systems and an evolution of their luminosity. If the luminosity evolution of the high mass systems is not as strong as inferred from the UV work, as suggested by Rowan-Robinson et al. (2016) based on an analysis of IR data, our original statement made for objects in the range can be extended to higher z.
Lagos et al. (2015) show the expected evolution of and (their Fig. 11) for two different prescriptions of formation applied to a set of the EAGLE cosmological simulations. Our observed values are about 3 higher for both parameters than the predictions for MS galaxies with based on the simulations. Lagos et al. (2015) explain the drop in gas fraction and depletion time beyond z3 with a lower formation efficiency than at due to lower gas phase metallicity and higher star formation surface densities. The mismatch might be due to the fact that our observations are probing a higher mass range implying a strong dependence of formation efficiency on stellar mass or that some physics are not sufficiently captured by the simulations.
Our data allows for a first glimpse on a potential evolution within the main sequence. Tacchella et al. (2016) observe in their simulations the f ollowing trend : Galaxies above the MS compactify their gas reservoir leading to higher SFR, higher and shorter . Once the (central) gas reservoir is exhausted, galaxies drop below the MS with lower SFR, lower and longer . Our data is consistent with a MS trend in , however, a MS trend for is only evident once objects in transition to starbursts are taken into account. Thus to test this scenario further a larger sample and, more critically, morphological information on the gas reservoir, i.e. its size, are required.
In summary our ALMA observations of the gas mass in 45 z3.2 massive MS galaxies suggest that a single relation between gas mass and SFR is sufficient to explain the evolution of the gas fraction and depletion out to for normal star forming galaxies. As already pointed out earlier our methods accounts for the contribution of molecular and atomic gas, while most of the other methods are calibrated for the molecular component only. Given the close agreement between derived gas masses of our method and the calibration of Scoville et al. (2016) for our galaxies as well as the expected low atomic gas content at (e.g. Obreschkow & Rawlings, 2009; Popping et al., 2014; Lagos et al., 2011), we do not expect that this introduces large uncertainties for our sample galaxies.
5 Summary and Conclusions
We present 45 ALMA continuum detections of massive main sequence (MS) galaxies (with and ) at in the COSMOS field. Conversation of the rest-frame sub-mm continuum luminosity to gas mass allowed us to derive the gas fraction and gas depletion time . Our data points are consistent with literature values reported at lower and higher redshifts for these parameters. Our median values of and imply a flattening of the redshift trends beyond inconsistent with the expected evolution for a strong dependence on dynamical time. The surprisingly good agreement with the predicted trends from the 2-SFM framework suggest that these analytic prescriptions are a good representation of the evolution of and – at least for massive MS galaxies out to . It further implies that the relation between SFR and gas mass is constant and does not evolve over time.
References
- Arnouts et al. (1999) Arnouts, S., Cristiani, S., Moscardini, L., Matarrese, S., Lucchin, F., Fontana, A., & Giallongo, E. 1999, Monthly Notices RAS, 310, 540
- Arnouts et al. (2002) Arnouts, S., Moscardini, L., Vanzella, E., Colombi, S., Cristiani, S., Fontana, A., Giallongo, E., Matarrese, S., & Saracco, P. 2002, Monthly Notices RAS, 329, 355
- Bethermin et al. (2015) Bethermin, M., Daddi, E., Magdis, G., Lagos, C., Sargent, M., Albrecht, M., Aussel, H., Bertoldi, F., Buat, V., Galametz, M., Heinis, S., Ilbert, O., Karim, A., Koekemoer, A., Lacey, C., Le Floc’h, E., Navarrete, F., Pannella, M., Schreiber, C., Smolcic, V., Symeonidis, M., & Viero, M. 2015, A&A, 573, A113
- Bethermin et al. (2014) Bethermin, M., Kilbinger, M., Daddi, E., Gabor, J., Finoguenov, A., McCracken, H., Wolk, M., Aussel, H., Strazzulo, V., Le Floc’h, E., Gobat, R., Rodighiero, G., Dickinson, M., Wang, L., Lutz, D., & Heinis, S. 2014, A&A, 567, A103
- Bothwell et al. (2014) Bothwell, M. S., Wagg, J., Cicone, C., Maiolino, R., Moller, P., Aravena, M., de Breuck, C., Peng, Y., Espada, D., Hodge, J. A., Impellizzeri, C. M. V., Martin, S., Riechers, D., & Walter, F. 2014, Monthly Notices RAS, 445, 2599
- Bouwens et al. (2015) Bouwens, R. J., Illingworth, G. D., Oesch, P. A., Trenti, M., Labbé, I., Bradley, L., Carollo, M., van Dokkum, P. G., Gonzalez, V., Holwerda, B. W., Franx, M., Spitler, L., Smit, R., & Magee, D. 2015, ApJ, 803, 34
- Bruzual & Charlot (2003) Bruzual, G., & Charlot, S. 2003, Monthly Notices RAS, 344, 1000
- Carilli & Walter (2013) Carilli, C. L., & Walter, F. 2013, Annu. Rev. Astro. Astrophys., 51, 105
- Civano et al. (2016) Civano, F., Marchesi, S., Comastri, A., Urry, M. C., Elvis, M., Cappelluti, N., Puccetti, S., Brusa, M., Zamorani, G., Hasinger, G., Aldcroft, T., Alexander, D. M., Allevato, V., Brunner, H., Capak, P., Finoguenov, A., Fiore, F., Fruscione, A., Gilli, R., Glotfelty, K., Griffiths, R. E., Hao, H., Harrison, F. A., Jahnke, K., Kartaltepe, J., Karim, A., LaMassa, S. M., Lanzuisi, G., Miyaji, T., Ranalli, P., Salvato, M., Sargent, M., Scoville, N. J., Schawinski, K., Schinnerer, E., Silverman, J., Smolcic, V., Stern, D., Toft, S., Trakhenbrot, B., Treister, E., & Vignali, C. 2016, ApJ, 819, 62
- da Cunha et al. (2008) da Cunha, E., Charlot, S., & Elbaz, D. 2008, Monthly Notices RAS, 388, 1595
- Davé et al. (2011) Davé, R., Finlator, K., & Oppenheimer, B. D. 2011, Monthly Notices RAS, 421, no
- Dessauges-Zavadsky et al. (2015) Dessauges-Zavadsky, M., Zamojski, M., Schaerer, D., Combes, F., Egami, E., Swinbank, A. M., Richard, J., Sklias, P., Rawle, T. D., Rex, M., Kneib, J. P., Boone, F., & Blain, A. 2015, A&A, 577, A50
- Draine & Li (2007) Draine, B. T., & Li, A. 2007, ApJ, 657, 810
- Genzel et al. (2015) Genzel, R., Tacconi, L. J., Lutz, D., Saintonge, A., Berta, S., Magnelli, B., Combes, F., Garcia-Burillo, S., Neri, R., Bolatto, A., Contini, T., Lilly, S., Boissier, J., Boone, F., Bouche, N., Bournaud, F., Burkert, A., Carollo, M., Colina, L., Cooper, M. C., Cox, P., Feruglio, C., Förster Schreiber, N. M., Freundlich, J., Gracia-Carpio, J., Juneau, S., Kovač, K., Lippa, M., Naab, T., Salome, P., Renzini, A., Sternberg, A., Walter, F., Weiner, B., Weiss, A., & Wuyts, S. 2015, ApJ, 800, 20
- Groves et al. (2015) Groves, B. A., Schinnerer, E., Leroy, A., Galametz, M., Walter, F., Bolatto, A., Hunt, L., Dale, D., Calzetti, D., Croxall, K., & Kennicutt, Jr, R. 2015, ApJ, 799, 96
- Heinis et al. (2014) Heinis, S., Buat, V., Béthermin, M., Bock, J., Burgarella, D., Conley, A., Cooray, A., Farrah, D., Ilbert, O., Magdis, G., Marsden, G., Oliver, S. J., Rigopoulou, D., Roehlly, Y., Schulz, B., Symeonidis, M., Viero, M., Xu, C. K., & Zemcov, M. 2014, Monthly Notices RAS, 437, 1268
- Hildebrand (1983) Hildebrand, R. H. 1983, Quarterly Journal of the Royal Astronomical Society, 24, 267
- Ilbert et al. (2006) Ilbert, O., Arnouts, S., McCracken, H. J., Bolzonella, M., Bertin, E., Le Fevre, O., Mellier, Y., Zamorani, G., Pello, R., Iovino, A., Tresse, L., Le Brun, V., Bottini, D., Garilli, B., Maccagni, D., Picat, J. P., Scaramella, R., Scodeggio, M., Vettolani, G., Zanichelli, A., Adami, C., Bardelli, S., Cappi, A., Charlot, S., Ciliegi, P., Contini, T., Cucciati, O., Foucaud, S., Franzetti, P., Gavignaud, I., Guzzo, L., Marano, B., Marinoni, C., Mazure, A., Meneux, B., Merighi, R., Paltani, S., Pollo, A., Pozzetti, L., Radovich, M., Zucca, E., Bondi, M., Bongiorno, A., Busarello, G., de la Torre, S., Gregorini, L., Lamareille, F., Mathez, G., Merluzzi, P., Ripepi, V., Rizzo, D., & Vergani, D. 2006, A&A, 457, 841
- Ilbert et al. (2013) Ilbert, O., McCracken, H. J., Le Fevre, O., Capak, P., Dunlop, J., Karim, A., Renzini, M. A., Caputi, K., Boissier, S., Arnouts, S., Aussel, H., Comparat, J., Guo, Q., Hudelot, P., Kartaltepe, J., Kneib, J. P., Krogager, J. K., Le Floc’h, E., Lilly, S., Mellier, Y., Milvang-Jensen, B., Moutard, T., Onodera, M., Richard, J., Salvato, M., Sanders, D. B., Scoville, N., Silverman, J., Taniguchi, Y., Tasca, L., Thomas, R., Toft, S., Tresse, L., Vergani, D., Wolk, M., & Zirm, A. 2013, eprint arXiv:1301.3157
- Karim et al. (2011) Karim, A., Schinnerer, E., Martinez-Sansigre, A., Sargent, M. T., van der Wel, A., Rix, H.-W., Ilbert, O., Smolcic, V., Carilli, C., Pannella, M., Koekemoer, A. M., Bell, E. F., & Salvato, M. 2011, ApJ, 730, 61
- Karim et al. (2013) Karim, A., Swinbank, A. M., Hodge, J. A., Smail, I. R., Walter, F., Biggs, A. D., Simpson, J. M., Danielson, A. L. R., Alexander, D. M., Bertoldi, F., de Breuck, C., Chapman, S. C., Coppin, K. E. K., Dannerbauer, H., Edge, A. C., Greve, T. R., Ivison, R. J., Knudsen, K. K., Menten, K. M., Schinnerer, E., Wardlow, J. L., Weiss, A., & van der Werf, P. 2013, Monthly Notices RAS, 432, 2
- Kennicutt et al. (2011) Kennicutt, R. C., Calzetti, D., Aniano, G., Appleton, P., Armus, L., Beirao, P., Bolatto, A. D., Brandl, B., Crocker, A., Croxall, K., Dale, D. A., Meyer, J. D., Draine, B. T., Engelbracht, C. W., Galametz, M., Gordon, K. D., Groves, B., Hao, C. N., Helou, G., Hinz, J., Hunt, L. K., Johnson, B., Koda, J., Krause, O., Leroy, A. K., Li, Y., Meidt, S., Montiel, E., Murphy, E. J., Rahman, N., Rix, H.-W., Roussel, H., Sandstrom, K., Sauvage, M., Schinnerer, E., Skibba, R., Smith, J. D. T., Srinivasan, S., Vigroux, L., Walter, F., Wilson, C. D., Wolfire, M., & Zibetti, S. 2011, PUBL ASTRON SOC PAC, 123, 1347
- Kewley et al. (2013) Kewley, L. J., Dopita, M. A., Leitherer, C., Davé, R., Yuan, T., Allen, M., Groves, B., & Sutherland, R. 2013, ApJ, 774, 100
- Kewley et al. (2015) Kewley, L. J., Zahid, H. J., Geller, M. J., Dopita, M. A., Hwang, H. S., & Fabricant, D. 2015, ApJ, 812, L20
- Lacy et al. (2007) Lacy, M., Petric, A. O., Sajina, A., Canalizo, G., Storrie-Lombardi, L. J., Armus, L., Fadda, D., & Marleau, F. R. 2007, AJ, 133, 186
- Lagos et al. (2011) Lagos, C. d. P., Baugh, C. M., Lacey, C. G., Benson, A. J., Kim, H.-S., & Power, C. 2011, Monthly Notices RAS, 418, 1649
- Lagos et al. (2015) Lagos, C. d. P., Crain, R. A., Schaye, J., Furlong, M., Frenk, C. S., Bower, R. G., Schaller, M., Theuns, T., Trayford, J. W., Bahe, Y. M., & Vecchia, C. D. 2015, Monthly Notices RAS, 452, 3815
- Laigle et al. (2016) Laigle, C., McCracken, H. J., Ilbert, O., Hsieh, B. C., Davidzon, I., Capak, P., Hasinger, G., Silverman, J. D., Pichon, C., Coupon, J., Aussel, H., Le Borgne, D., Caputi, K., Cassata, P., Chang, Y. Y., Civano, F., Dunlop, J., Fynbo, J., Kartaltepe, J. S., Koekemoer, A., Le Fevre, O., Le Floc’h, E., Leauthaud, A., Lilly, S., Lin, L., Marchesi, S., Milvang-Jensen, B., Salvato, M., Sanders, D. B., Scoville, N., Smolcic, V., Stockmann, M., Taniguchi, Y., Tasca, L., Toft, S., Vaccari, M., & Zabl, J. 2016, eprint arXiv:1604.02350,
- Le Fevre et al. (2015) Le Fevre, O., Tasca, L. A. M., Cassata, P., Garilli, B., Le Brun, V., Maccagni, D., Pentericci, L., Thomas, R., Vanzella, E., Zamorani, G., Zucca, E., Amorin, R., Bardelli, S., Capak, P., Cassarà, L., Castellano, M., Cimatti, A., Cuby, J. G., Cucciati, O., de la Torre, S., Durkalec, A., Fontana, A., Giavalisco, M., Grazian, A., Hathi, N. P., Ilbert, O., Lemaux, B. C., Moreau, C., Paltani, S., Ribeiro, B., Salvato, M., Schaerer, D., Scodeggio, M., Sommariva, V., Talia, M., Taniguchi, Y., Tresse, L., Vergani, D., Wang, P. W., Charlot, S., Contini, T., Fotopoulou, S., López-Sanjuan, C., Mellier, Y., & Scoville, N. 2015, A&A, 576, A79
- Le Floc’h et al. (2009) Le Floc’h, E., Aussel, H., Ilbert, O., Riguccini, L., Frayer, D. T., Salvato, M., Arnouts, S., Surace, J., Feruglio, C., Rodighiero, G., Capak, P., Kartaltepe, J., Heinis, S., Sheth, K., Yan, L., McCracken, H. J., Thompson, D., Sanders, D., Scoville, N., & Koekemoer, A. 2009, ApJ, 703, 222
- Lee et al. (2010) Lee, J. C., Gil de Paz, A., Kennicutt, R. C., Bothwell, M., Dalcanton, J., S J, J. G. F., Johnson, B. D., Sakai, S., Skillman, E., Tremonti, C., & van Zee, L. 2010, ApJS, 192, 6
- Leroy et al. (2011) Leroy, A. K., Bolatto, A., Gordon, K., Sandstrom, K., Gratier, P., Rosolowsky, E., Engelbracht, C. W., Mizuno, N., Corbelli, E., Fukui, Y., & Kawamura, A. 2011, ApJ, 737, 12
- Lilly et al. (2007) Lilly, S. J., Fevre, O. L., Renzini, A., Zamorani, G., Scodeggio, M., Contini, T., Carollo, C. M., Hasinger, G., Kneib, J. P., Iovino, A., Le Brun, V., Maier, C., Mainieri, V., Mignoli, M., Silverman, J., Tasca, L. A. M., Bolzonella, M., Bongiorno, A., Bottini, D., Capak, P., Caputi, K., Cimatti, A., Cucciati, O., Daddi, E., Feldmann, R., Franzetti, P., Garilli, B., Guzzo, L., Ilbert, O., Kampczyk, P., Kovač, K., Lamareille, F., Leauthaud, A., Borgne, J. F. L., McCracken, H. J., Marinoni, C., Pello, R., Ricciardelli, E., Scarlata, C., Vergani, D., Sanders, D. B., Schinnerer, E., Scoville, N., Taniguchi, Y., Arnouts, S., Aussel, H., Bardelli, S., Brusa, M., Cappi, A., Ciliegi, P., Finoguenov, A., Foucaud, S., Franceschini, R., Halliday, C., Impey, C., Knobel, C., Koekemoer, A., Kurk, J., Maccagni, D., Maddox, S., Marano, B., Marconi, G., Meneux, B., Mobasher, B., Moreau, C., Peacock, J. A., Porciani, C., Pozzetti, L., Scaramella, R., Schiminovich, D., Shopbell, P., Smail, I., Thompson, D., Tresse, L., Vettolani, G., Zanichelli, A., & Zucca, E. 2007, ApJS, 172, 70
- Lutz et al. (2011) Lutz, D., Poglitsch, A., Altieri, B., Andreani, P., Aussel, H., Berta, S., Bongiovanni, Á., Brisbin, D., Cava, A., Cepa, J., Cimatti, A., Daddi, E., Dominguez-Sanchez, H., Elbaz, D., Förster Schreiber, N. M., Genzel, R., Grazian, A., Gruppioni, C., Harwit, M., Le Floc’h, E., Magdis, G., Magnelli, B., Maiolino, R., Nordon, R., Pérez-García, A. M., Popesso, P., Pozzi, F., Riguccini, L., Rodighiero, G., Saintonge, A., Sánchez-Portal, M., Santini, P., Shao, L., Sturm, E., Tacconi, L. J., Valtchanov, I., Wetzstein, M., & Wieprecht, E. 2011, A&A, 532, A90
- Magdis et al. (2012) Magdis, G. E., Daddi, E., Sargent, M., Elbaz, D., Gobat, R., Dannerbauer, H., Feruglio, C., Tan, Q., Rigopoulou, D., Charmandaris, V., Dickinson, M., Reddy, N., & Aussel, H. 2012, ApJ, 758, L9
- Magdis et al. (2010) Magdis, G. E., Rigopoulou, D., Huang, J. S., & Fazio, G. G. 2010, Monthly Notices RAS, 401, 1521
- Magnelli et al. (2014) Magnelli, B., Lutz, D., Saintonge, A., Berta, S., Santini, P., Symeonidis, M., Altieri, B., Andreani, P., Aussel, H., Béthermin, M., Bock, J., Bongiovanni, Á., Cepa, J., Cimatti, A., Conley, A., Daddi, E., Elbaz, D., Förster Schreiber, N. M., Genzel, R., Ivison, R. J., Le Floc’h, E., Magdis, G., Maiolino, R., Nordon, R., Oliver, S. J., Page, M., Pérez García, A., Poglitsch, A., Popesso, P., Pozzi, F., Riguccini, L., Rodighiero, G., Rosario, D., Roseboom, I., Sánchez-Portal, M., Scott, D., Sturm, E., Tacconi, L. J., Valtchanov, I., Wang, L., & Wuyts, S. 2014, A&A, 561, A86
- Magnelli et al. (2013) Magnelli, B., Popesso, P., Berta, S., Pozzi, F., Elbaz, D., Lutz, D., Dickinson, M., Altieri, B., Andreani, P., Aussel, H., Béthermin, M., Bongiovanni, Á., Cepa, J., Charmandaris, V., Chary, R. R., Cimatti, A., Daddi, E., Förster Schreiber, N. M., Genzel, R., Gruppioni, C., Harwit, M., Hwang, H. S., Ivison, R. J., Magdis, G., Maiolino, R., Murphy, E., Nordon, R., Pannella, M., Pérez García, A., Poglitsch, A., Rosario, D., Sánchez-Portal, M., Santini, P., Scott, D., Sturm, E., Tacconi, L. J., & Valtchanov, I. 2013, A&A, 553, A132
- Maiolino et al. (2008) Maiolino, R., Nagao, T., Grazian, A., Cocchia, F., Marconi, A., Mannucci, F., Cimatti, A., Pipino, A., Ballero, S., Calura, F., Chiappini, C., Fontana, A., Granato, G. L., Matteucci, F., Pastorini, G., Pentericci, L., Risaliti, G., Salvati, M., & Silva, L. 2008, A&A, 488, 463
- McCracken et al. (2012) McCracken, H. J., Milvang-Jensen, B., Dunlop, J., Franx, M., Fynbo, J. P. U., Le Fevre, O., Holt, J., Caputi, K. I., Goranova, Y., Buitrago, F., Emerson, J. P., Freudling, W., Hudelot, P., López-Sanjuan, C., Magnard, F., Mellier, Y., Moller, P., Nilsson, K. K., Sutherland, W., Tasca, L., & Zabl, J. 2012, A&A, 544, A156
- Muzzin et al. (2013) Muzzin, A., Marchesini, D., Stefanon, M., Franx, M., Milvang-Jensen, B., Dunlop, J. S., Fynbo, J. P. U., Brammer, G., Labbé, I., & van Dokkum, P. 2013, ApJS, 206, 8
- Noeske et al. (2007) Noeske, K. G., Weiner, B. J., Faber, S. M., Papovich, C., Koo, D. C., Somerville, R. S., Bundy, K., Conselice, C. J., Newman, J. A., Schiminovich, D., Le Floc’h, E., Coil, A. L., Rieke, G. H., Lotz, J. M., Primack, J. R., Barmby, P., Cooper, M. C., Davis, M., Ellis, R. S., Fazio, G. G., Guhathakurta, P., Huang, J., Kassin, S. A., Martin, D. C., Phillips, A. C., Rich, R. M., Small, T. A., Willmer, C. N. A., & Wilson, G. 2007, ApJ, 660, L43
- Obreschkow & Rawlings (2009) Obreschkow, D., & Rawlings, S. 2009, ApJ, 696, L129
- Onodera et al. (2016) Onodera, M., Carollo, C. M., Lilly, S., Renzini, A., Arimoto, N., Capak, P., Daddi, E., Scoville, N., Tacchella, S., Tatehora, S., & Zamorani, G. 2016, ApJ, 822, 42
- Popping et al. (2014) Popping, G., Somerville, R. S., & Trager, S. C. 2014, Monthly Notices RAS, 442, 2398
- Rowan-Robinson et al. (2016) Rowan-Robinson, M., Oliver, S., Wang, L., Farrah, D., Clements, D., Gruppioni, C., Marchetti, L., Rigopoulou, D., & Vaccari, M. 2016, Monthly Notices RAS, 461, 1100
- Saintonge et al. (2011a) Saintonge, A., Kauffmann, G., Kramer, C., Tacconi, L. J., Buchbender, C., Catinella, B., Fabello, S., Graciá-Carpio, J., Wang, J., Cortese, L., Fu, J., Genzel, R., Giovanelli, R., Guo, Q., Haynes, M. P., Heckman, T. M., Krumholz, M. R., Lemonias, J., Li, C., Moran, S., Rodriguez-Fernandez, N., Schiminovich, D., Schuster, K., & Sievers, A. 2011a, Monthly Notices RAS, 415, 32
- Saintonge et al. (2011b) Saintonge, A., Kauffmann, G., Wang, J., Kramer, C., Tacconi, L. J., Buchbender, C., Catinella, B., Graciá-Carpio, J., Cortese, L., Fabello, S., Fu, J., Genzel, R., Giovanelli, R., Guo, Q., Haynes, M. P., Heckman, T. M., Krumholz, M. R., Lemonias, J., Li, C., Moran, S., Rodriguez-Fernandez, N., Schiminovich, D., Schuster, K., & Sievers, A. 2011b, Monthly Notices RAS, 415, 61
- Saintonge et al. (2013) Saintonge, A., Lutz, D., Genzel, R., Magnelli, B., Nordon, R., Tacconi, L. J., Baker, A. J., Bandara, K., Berta, S., Forster Schreiber, N. M., Poglitsch, A., Sturm, E., Wuyts, E., & Wuyts, S. 2013, ApJ, 778, 2
- Saintonge et al. (2012) Saintonge, A., Tacconi, L. J., Fabello, S., Wang, J., Catinella, B., Genzel, R., Graciá-Carpio, J., Kramer, C., Moran, S., Heckman, T. M., Schiminovich, D., Schuster, K., & Wuyts, S. 2012, ApJ, 758, 73
- Santini et al. (2014) Santini, P., Maiolino, R., Magnelli, B., Lutz, D., Lamastra, A., Li Causi, G., Eales, S., Andreani, P., Berta, S., Buat, V., Cooray, A., Cresci, G., Daddi, E., Farrah, D., Fontana, A., Franceschini, A., Genzel, R., Granato, G., Grazian, A., Le Floc’h, E., Magdis, G., Magliocchetti, M., Mannucci, F., Menci, N., Nordon, R., Oliver, S., Popesso, P., Pozzi, F., Riguccini, L., Rodighiero, G., Rosario, D. J., Salvato, M., Scott, D., Silva, L., Tacconi, L., Viero, M., Wang, L., Wuyts, S., & Xu, K. 2014, A&A, 562, A30
- Sargent et al. (2014) Sargent, M. T., Daddi, E., Béthermin, M., Aussel, H., Magdis, G., Hwang, H. S., Juneau, S., Elbaz, D., & da Cunha, E. 2014, ApJ, 793, 19
- Schreiber et al. (2015) Schreiber, C., Pannella, M., Elbaz, D., Béthermin, M., Inami, H., Dickinson, M., Magnelli, B., Wang, T., Aussel, H., Daddi, E., Juneau, S., Shu, X., Sargent, M. T., Buat, V., Faber, S. M., Ferguson, H. C., Giavalisco, M., Koekemoer, A. M., Magdis, G., Morrison, G. E., Papovich, C., Santini, P., & Scott, D. 2015, A&A, 575, A74
- Scoville et al. (2014) Scoville, N., Aussel, H., Sheth, K., Scott, K. S., Sanders, D., Ivison, R., Pope, A., Capak, P., Vanden Bout, P., Manohar, S., Kartaltepe, J., Robertson, B., & Lilly, S. 2014, ApJ, 783, 84
- Scoville et al. (2016) Scoville, N., Sheth, K., Aussel, H., Bout, P. V., Capak, P., Bongiorno, A., Casey, C. M., Murchikova, L., Koda, J., Alvarez-M’arquez, J., Lee, N., Laigle, C., McCracken, H. J., Ilbert, O., Pope, A., Sanders, D., Chu, J., Toft, S., Ivison, R. J., & Manohar, S. 2016, ApJ, 820, 83
- Somerville & Davé (2015) Somerville, R. S., & Davé, R. 2015, Annu. Rev. Astro. Astrophys., 53, 51
- Speagle et al. (2014) Speagle, J. S., Steinhardt, C. L., Capak, P. L., & Silverman, J. D. 2014, ApJS, 214, 15
- Steinhardt et al. (2014) Steinhardt, C. L., Speagle, J. S., Capak, P., Silverman, J. D., Carollo, M., Dunlop, J., Hashimoto, Y., Hsieh, B.-C., Ilbert, O., Le Fevre, O., Le Floc’h, E., Lee, N., Lin, L., Lin, Y.-T., Masters, D., McCracken, H. J., Nagao, T., Petric, A., Salvato, M., Sanders, D., Scoville, N., Sheth, K., Strauss, M. A., & Taniguchi, Y. 2014, ApJ, 791, L25
- Tacchella et al. (2016) Tacchella, S., Dekel, A., Carollo, C. M., Ceverino, D., DeGraf, C., Lapiner, S., Mandelker, N., & Primack, J. R. 2016, Monthly Notices RAS, 457, 2790
- Tan et al. (2014) Tan, Q., Daddi, E., Magdis, G., Pannella, M., Sargent, M., Riechers, D., Béthermin, M., Bournaud, F., Carilli, C., da Cunha, E., Dannerbauer, H., Dickinson, M., Elbaz, D., Gao, Y., Hodge, J., Owen, F., & Walter, F. 2014, A&A, 569, A98
- Tasca et al. (2015) Tasca, L. A. M., Le Fevre, O., Hathi, N. P., Schaerer, D., Ilbert, O., Zamorani, G., Lemaux, B. C., Cassata, P., Garilli, B., Le Brun, V., Maccagni, D., Pentericci, L., Thomas, R., Vanzella, E., Zucca, E., Amorin, R., Bardelli, S., Cassarà, L. P., Castellano, M., Cimatti, A., Cucciati, O., Durkalec, A., Fontana, A., Giavalisco, M., Grazian, A., Paltani, S., Ribeiro, B., Scodeggio, M., Sommariva, V., Talia, M., Tresse, L., Vergani, D., Capak, P., Charlot, S., Contini, T., de la Torre, S., Dunlop, J., Fotopoulou, S., Koekemoer, A., López-Sanjuan, C., Mellier, Y., Pforr, J., Salvato, M., Scoville, N., Taniguchi, Y., & Wang, P. W. 2015, A&A, 581, A54
- Tomczak et al. (2016) Tomczak, A. R., Quadri, R. F., Tran, K.-V. H., Labbé, I., Straatman, C. M. S., Papovich, C., Glazebrook, K., Allen, R., Brammer, G. B., Cowley, M., Dickinson, M., Elbaz, D., Inami, H., Kacprzak, G. G., Morrison, G. E., Nanayakkara, T., Persson, S. E., Rees, G. A., Salmon, B., Schreiber, C., Spitler, L. e. R., & Whitaker, K. E. 2016, ApJ, 817, 118
- Troncoso et al. (2014) Troncoso, P., Maiolino, R., Sommariva, V., Cresci, G., Mannucci, F., Marconi, A., Meneghetti, M., Grazian, A., Cimatti, A., Fontana, A., Nagao, T., & Pentericci, L. 2014, A&A, 563, A58