Particle dynamics in self-generated bedforms over a range of hydraulic and sediment transport conditions using LES–DEM
Abstract
Direct measurement of vertical and longitudinal sediment fluxes on migrating sandy bedforms are extremely difficult to perform in both the field and laboratory. In this study we use the LES–DEM (large eddy simulation–discrete element method) solver SediFoam to examine the individual particle motions and resulting fluxes in a domain of self-generated bedforms. In SediFoam, the motions of, and collisions among, the sediment grains as well as their interactions with surrounding turbulent flows are captured. The numerical simulations are performed over a range of transport settings, spanning bedform inception through washout conditions, to examine the individual particle dynamics. The space-time evolution of sand bed surfaces is demonstrated. The self-generated bedforms are stable at relatively low Reynolds numbers, but then become increasingly unstable at higher Reynolds numbers; eventually washing out as the number of bypass grains and particles in suspension increase. Data from the simulation are used to examine the vertical entrainment rate of particles and the fractionation of total sediment load into bed and suspended fractions as a function of transport conditions. The study also compares the sediment transport rate obtained using the bedform geometry and celerity to the true transport rate at different transport stages.
keywords:
particle dynamics , ripples , dunes , sediment transport , Large Eddy Simulation–Discrete Element Method1 Introduction
The development of asymmetric bedforms at the interface of a flowing river and its bed is a distinguishing feature of sand-bed rivers. These features arise naturally as dynamically stable entities birthed from instabilities in the coupled fluid and sediment system, and their presence strongly influences river hydraulic and sediment transport characteristics. Due to the importance of dunes in river mechanics, and their compelling physical and mathematical ascetics, their study has garnered substantial attention from researchers over many years (e.g., Gilbert, 1914; Anderson, 1953; Kennedy, 1963; Mohrig and Smith, 1996; McElroy and Mohrig, 2009; Charru et al., 2013). Nevertheless, there is still much about dunes we are currently learning (e.g., Naqshband et al., 2014b, 2015; Emadzadeh and Cheng, 2016; Venditti et al., 2016), and a unified quantitative approach to account for sediment mass flux in the longitudinal and vertical directions in the presence of migrating dunes is lacking (García, 2008).
Classic modeling of sediment transport in sand bed rivers conceptually discretizes active river beds into three vertical layers based on particle mobility and mode of transport (Fig. 1). These three layers consist of a stable bed layer (with particle velocities, , and solids volume fraction, or volume concentration, , greater than 0.5, and a vertical coordinate ), a mobile, but dense, bed load layer with variable thickness, , (), and a more disperse suspended phase (); based on this particular definition, the elevation of the bed surface, , is taken to coincide with the top of the immobile layer. The unit width volume flow rate of sediment traveling between and is the bed load transport rate, , and the volume flow rate of sediment moving above the elevation of is the suspended load, ; the summation of the bed and suspended loads is the total load, . Exchange between the bed and bed load layer is accounted for with the entrainment and deposition rates evaluated at , and . Similarly exchange between the bed load and suspended layers is accounted for using erosion and deposition functions evaluated at , and (Fig. 1).

In typical reach-scale sediment transport calculations and morphodynamic simulations, the individual sediment particles are not directly resolved; nor are, in most cases, ripple or dune-scale changes in the bed elevation (Giri and Shimizu, 2006; Khosronejad and Sotiropoulos, 2014). Instead, sediment is modeled as a continuous substance, and moved throughout the domain using the vertical exchange terms, the computed fluid velocities, and the longitudinal bed or total loads. Common assumptions are that material in suspension travels with a speed equal to the fluid velocity; the bed load is in equilibrium with local conditions; and that and can be modeled as: and , where is the terminal settling velocity of the sediment, is sediment concentration near the interface of the suspended and bed load layer, and (or ) is the entrainment function, which is taken to be the near bed concentration under equilibrium conditions when erosion and deposition are locally balanced. Therefore, to model the movement of sediment and the resulting bed deformation, the closure equations for the sediment phase that are needed are the bed load flow rate, , and the entrainment function, .
Many empirical functions for these two quantities have been proposed over the years (García, 2008). However, obtaining data to evaluate , , and independently and in detail is very difficult. Rather than measuring individual particle movements, sediment loads are measured in mass over some time interval and often only at one particular location along a stretch of river or laboratory flume. Furthermore, disentangling , , and from experimental data, which typically consist of measurements of and , can be difficult, and no direct measurements of , that we are aware of, have been made in cases of actively migrating bedforms. Rather, reach averaged values of are extracted from the vertical concentration profiles under equilibrium conditions (Guy et al., 1966; Garcia and Parker, 1991).
When thinking about sand beds with migrating dunes, it is clear that spatial heterogeneities in the bed elevations will drive heterogeneities in the longitudinal and vertical turbulence properties of the flow and, hence, particle mobility (Smith and McLean, 1977; van Rijn, 1984d; Best, 2005). For example, the recent study of Emadzadeh and Cheng (2016) has highlighted that sediment entrainment rates vary at different spatial locations over fixed idealized dunes. While most sediment transport calculations do not resolve bedform scale features, it is possible that further insights into the mechanics associated with actively migrating ripples and dunes in turbulent flows may come from a better understanding of particle motion over the bedform. In addition, the translation of these mechanics to sediment transport models such as those for and , could potentially be enhanced by examining the details of individual particle motions.
For example, advances have recently been made in understanding bed load transport in gravel beds using particle statistics obtained from high-speed cameras (Ancey, 2010; Lajeunesse et al., 2010; Roseberry et al., 2012; Campagnol et al., 2015; Fathel et al., 2015). Concurrent with this new data has been a drive to better describe the motion of the discrete sediment phase in terms of continuous river properties that can be used in larger-scale morphodynamic modeling (Parker et al., 2000; Ancey, 2010; Lajeunesse et al., 2010; Furbish et al., 2012, 2016). The focus of these recent studies has been on the more sporadic motion of gravel particles traveling over a plane flume bed under equilibrium transport conditions with steady, uniform time-averaged hydraulics. Such conditions are different from those producing actively migrating sandy bedforms, but it is likely that some of the basic methodology and discussion generated by this body of work could also help to improve understanding of transport in sand bed rivers.
Examining particle motion in the presence of translating sandy bedforms presents at least two complications. The first is that steady hydraulics can only be obtained within a frame of reference that translates with the bedform. Secondly, even within a moving frame of reference, both vertical and longitudinal variation in the fluid and transport characteristics exists – even in the time averaged quantities (Kostaschuk et al., 2009; Naqshband et al., 2014b). Furthermore, operations such as tracking the jump length of sand grains in experimental ripples and dunes are difficult. This is due to the combination of particle sizes smaller than gravels, travel distances that can be up to and longer than one bedform wavelength, large numbers of nearly identical particles in motion, and opaque water. Needless to say, such constraints exceed the limits that even the state of the art imaging and image processing technology can currently achieve.
A secondary approach to bolstering our understanding of particle motion in beds with actively migrating bedforms, is to make use of interface-resolved direct numerical simulations, which resolve both the turbulent flow, the flow field surrounding each particle, and the interparticle collisions (Aussillous et al., 2013; Fukuoka et al., 2014; Kidanemariam and Uhlmann, 2014a). Such methods have proved especially fruitful in painting a better picture of the interplay between turbulence and sediment transport over plane beds (e.g., Kempe et al., 2014; Vowinckel et al., 2014). A drawback to such methods, however, is that they are highly expensive computationally. For example, the computational cost for sediment transport simulation of 27,000 grains on a flat bed is 30 million CPU hours (Vowinckel et al., 2014). Because of the expense, most simulations have focused on active sediment transport in the absence of self-generated bedforms; an exception to this statement is the study of Kidanemariam and Uhlmann (2014a).
In the past few years researchers started to use modern, general-purpose particle-resolving solvers based on LES–DEM to study sediment transport. The LES–DEM has been used extensively in the past two decades in the chemical and pharmaceutical industry on a wide range of applications such as fluidized beds, cyclone separator, and pneumatic conveying (Han et al., 2003; Ebrahimi, 2014). In LES–DEM, Large eddy simulation is used to model the fluid flow, which is coupled with the discrete element method for resolving particle motions. In his pioneering work, Schmeeckle (2014) used an open-source LES–DEM solver (Goniva et al., 2009; Kloss et al., 2012) to study suspended sediment transport over featureless beds. The LES–DEM approach is also proved to be capable of simulating the self-generated ripples/dunes in a pipe or channel (Arolla and Desjardins, 2015; Sun and Xiao, 2016a). It should be noted that the hydro- and morphodynamic models for sediment transport simulations also gained success in the prediction of dune generation and migration (Shimizu et al., 2009; Escauriaza and Sotiropoulos, 2011; Nabi et al., 2013a, b). For example, that Nabi et al. (2013a, b) uses an LES model and a DEM approach based on complete particle equations of motion. In addition, the number of elements in the DEM model is scaled-each particles accounts for more mass flux than a single sediment particle, such that the physics are retained but the computational load is reduced. However, the computation of the sediment erosion in Nabi’s work is still based on the empirical correlations to describe sediment erosion and deposition fluxes. Compared with the hydro- and morphodynamic models, the LES–DEM approach resolves the motion of individual particles, which is an important improvement.
It has recently been shown that SediFoam, a hybrid LES–DEM solver for particle-laden flows (Sun and Xiao, 2016c), is capable of producing self-organized bedforms with characteristic height and migration celerities similar to those observed in laboratory flumes (Sun and Xiao, 2016a). In this study, our first aim is to use SediFoam to examine the individual particle dynamics of sand grains in a field of self-organize asymmetric ripples. This is done over a range of transport settings, spanning from bedform inception to washout conditions. The particle velocities are then temporally and spatially averaged in a moving frame of reference to extract key sediment transport quantities. We also compared the averaged values to empirical formulas used in one-dimensional river morphodynamic modeling, with the primary intent of showing that DEM approaches can be used to extract the types of data needed to improve understanding and modeling in cases of actively migrating sandy bedforms. Examining these properties in a moving frame of reference also allows us to examine the link between translation and deformation of ripples/dunes in light of spatially varying bed and suspended loads.
2 Methodology
SediFoam is an open-source, highly parallel, robust LES–DEM solver with emphasis on sediment transport applications. It is capable of simulating the interaction between turbulent structures and sediment particles. The modeling of translational and rotational motion of each sediment particle is based on Newton’s second law as the following equations (Cundall and Strack, 1979):
| (1a) | ||||
| (1b) | ||||
where is the mass of particle; is particle velocity; is time; , are particle–particle collision force and fluid–particle interaction force of Lagrangian particles, respectively; denotes gravity. Similarly, and are angular moment of inertia and angular velocity of the particle; and are the torques due to inter-particle contact and fluid–particle interaction, respectively. Note that the vectors and tensors are denoted using boldface letters (e.g., ). To compute the collision forces and torques, the particles are modeled as soft spheres with inter-particle contact represented by an elastic spring and a viscous dashpot. Further details can be found in Tsuji et al. (1993).
Locally-averaged incompressible Navier–Stokes equations are used to describe the fluid flow by applying local averaging the variables such as fluid velocity and pressure. Assuming constant fluid density , the governing equations for the fluid are (Anderson and Jackson, 1967; Kafui et al., 2002):
| (2a) | ||||
| (2b) | ||||
where is the solid volume fraction; is the fluid volume fraction; is the fluid velocity. The terms on the right hand side of the momentum equation are: pressure gradient , divergence of the stress tensor (including viscous and Reynolds stresses), gravity, and fluid–particle interaction forces per unit mass, respectively. Note that the velocities and the forces associated with individual particles are denoted as and , respectively; and the velocities and forces in the continuum scale are denoted as and , respectively. In the present study, large-eddy simulation is applied to resolve the flow turbulent motions that are larger than the spatial filter which is the same as the grid size. The stress tensor is composed of both viscous and Reynolds stresses: , where is the molecular viscosity of fluid and is the Reynolds stress. The expression of the Reynolds stress is:
| (3) |
where is the eddy viscosity, is the rate-of-strain tensor, is the turbulent kinetic energy, and is the identity matrix. We applied the one-equation eddy viscosity model proposed by Yoshizawa and Horiuti (1985) as the sub-grid scale (SGS) model. The one-equation eddy model solves a transport equation for the sub-grid scale kinetic energy on which the eddy viscosity depends. It is observed by Yoshizawa and Horiuti (1985) that the standard Smagorinsky model would be recovered from the one-equation eddy model if production equals dissipation. However, the one-equation eddy model can provide better accuracy under non-equilibrium circumstances in channel flows (Fureby et al., 1997; De Villiers, 2007). It is noted that in the stress tensor term, the fluctuations of the fluid flow at the boundary of the particle are not resolved. The Eulerian fields , , and in Eq. (2) are obtained based on the volume, velocity, and fluid-particle interaction force from each Lagrangian particle contained in a given fluid grid cell.
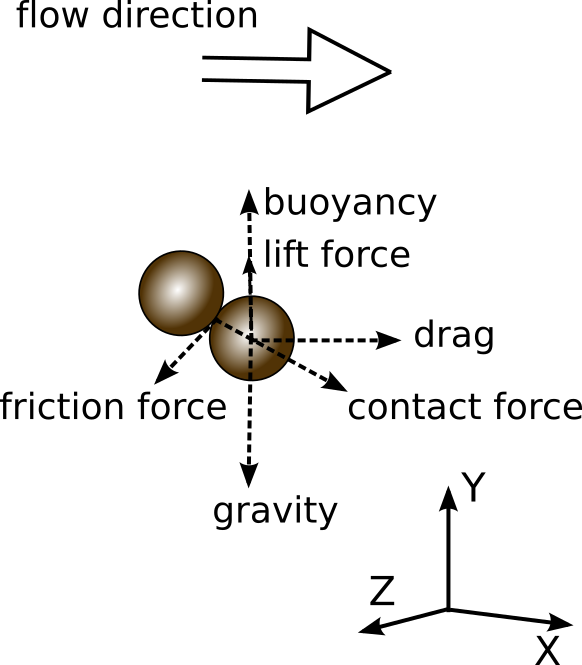
The fluid-particle interaction force in Eq. (1a) consists of buoyancy , drag , lift force , and pressure gradient force . The drag force model proposed by Syamlal et al. (1993) is applied to the present simulations. The drag on an individual component sphere is formulated as:
| (4) |
where and are the volume and the velocity of particle , respectively; , , and are the fluid velocity, solid volume fraction, and fluid volume fraction interpolated to the center of particle , respectively; is the drag correlation coefficient which accounts for the presence of other particles. The value in the present study is based on Syamlal et al. (1993):
| (5) |
where is the drag coefficient of particle ; is the diameter of particle ; the particle velocity Reynolds number is defined as:
| (6) |
the is the correlation term for the -th particle:
| (7) |
where and are asymptotic values of the relative velocity (i.e., the ratio between the particle terminal velocity in the presence of other particles and the terminal velocity of a single particle) at low and high Reynolds numbers, respectively (Garside and Al-Dibouni, 1977):
| (8) |
In addition to drag, the lift force is considered in the simulations. The velocity gradient in the flow field can lead to the lift forces on a spherical particle. This is because the velocity gradient will result in a flow deflection at the particle surface so that the flow velocity, and consequently the pressure, on one side can be different from the other side. The pressure difference causes the lift forces. The lift force on a spherical component particle is modeled as (Saffman, 1965; van Rijn, 1984a; Zhu et al., 2007):
| (9) |
where is the lift coefficient, is the flow vorticity interpolated to the center of particle , and indicates the cross product between vectors. The pressure gradient force is modeled as (Chu et al., 2009):
| (10) |
where is the pressure interpolated to the center of particle . We consider the pressure gradient force because temporal pressure fluctuations on the scale of the particles can produce far larger instantaneous forces.
3 Implementations and numerical methods
The hybrid LES–DEM solver SediFoam is developed based on two state-of-the-art open-source codes in their respective fields. LES is performed by using CFD (Computational Fluid Dynamics) toolbox OpenFOAM (Open Field Operation and Manipulation)(OpenCFD, 2013), and DEM is performed by a molecular dynamics simulator LAMMPS (Large-scale Atomic/Molecular Massively Parallel Simulator) which is developed at the Sandia National Laboratories (Plimpton, 1995). A parallel LAMMPS–OpenFOAM interface is implemented for the communication of the two open-source solvers. The code is publicly available at https://github.com/xiaoh/sediFoam under GPL license. Detailed introduction of the implementations of this hybrid solver is discussed in Sun and Xiao (2016c).
The fluid equations in (2) are solved in OpenFOAM with the finite volume method (Jasak, 1996). The coupled pressure and velocity fields are solved by using PISO (Pressure Implicit Splitting Operation) algorithm (Issa, 1986). A second-order central scheme is used for the spatial discretization of convection and diffusion terms. Time integrations are performed with a second-order backward Euler scheme. An averaging algorithm based on diffusion is implemented to obtain smooth , and fields from discrete sediment particles (Sun and Xiao, 2015a, b). In the averaging procedure to get the averaged Lagrangian particle quantities (, , and in Eq. (2)), the diffusion equations are solved on the same mesh for LES. A second-order central scheme is used for the spatial discretization of the diffusion equation; a second-order implicit scheme is used for the temporal integration. To resolve the collision between the sediment particles, the contact force between sediment particles is computed with a linear spring-dashpot model (Cundall and Strack, 1979). The time step to resolve the particle collision is less than 1/50 the contact time to avoid particle inter-penetration (Sun et al., 2007).
The LES–DEM solver SediFoam has been verified and validated extensively with cases of general particle-laden flows and specific applications in sediment transport. Gupta (2015) verified the implementation of the inter-phase momentum transfer term and validates the solver against various fluidized bed applications; Sun and Xiao (2016c) validated SediFoam by using a test of 500 moving sphere particles and found the results agree well with the DNS results (Kempe and Fröhlich, 2012); Sun and Xiao (2016a) simulated several different sediment transport regimes, including “flat bed in motion”, “small dune” and “vortex dune”, and the results agree with experiments (Ouriemi et al., 2009) and interface resolving simulations of Kidanemariam and Uhlmann (2014b); Kidanemariam and Uhlmann (2014a); Sun and Xiao (2016d) demonstrated the capability of the solver in the simulation of sediment transport in sheet flows induced by oscillatory boundary layer. More recently, the feasibility of simulating irregular particles with SediFoam by using bonded spheres has also been demonstrated and the results were compared with experimental measurements (Sun and Xiao, 2016b). In this study, we performed an additional validation of grain avalanching, the results of which are presented in the Appendix. The repose angle obtained in the avalanching test is consistent with those in the literature (Goniva et al., 2012; Zhao and Shan, 2013). Therefore, we can conclude that the capabilities of SediFoam in representing particle dynamics and fluid-particle interactions in various regimes of sediment transport have been adequately demonstrated. The objective of the present study is to use this well-validated high-fidelity simulation tool to probe the physics of particle dynamics in self-generated bedforms.
4 Conditions for runs
The numerical tests of the self-generated bedforms are performed at different bulk Reynolds numbers varying from 6,000 to 12,000. The bedforms grow in size from Case 1 to Case 2, and then began to wash out in Cases 3 and 4. The bulk Reynolds number is defined as , where is the equivalent boundary layer thickness as measured from the initial bed surface to the top of the computational domain; is the mean bulk flow velocity in the equivalent boundary layer; is the kinetic viscosity of the fluid. The selection of the equivalent boundary layer thickness is according to (Kidanemariam and Uhlmann, 2014a). The thickness of the initial flat sediment bed layer is . The setup of the numerical tests is based on previous studies of bedform migration (Kidanemariam and Uhlmann, 2014a; Sun and Xiao, 2016a). LES–DEM resolved four-way coupled interactions among the fluid and particles, which include fluid-to-particle, particle-to-fluid, and particle–particle interactions (Kuipers and van Swaaij, 1997). At each time step, the DEM gives the information to update the fluid field, and the fluid-particle interaction force according to the updated fluid flow data is incorporated into the DEM. The trajectories of the sediment particles are captured by using DEM and thus we can investigate the characteristics of individual particles.
| Case 1 | Case 2 | Case 3 | Case 4 | |
| Description | small dune | large dune | washing out | washed out |
| Domain dimensions | ||||
| length, height, thickness | ||||
| (, , ) | ||||
| length, height, thickness | ||||
| in mm (, , ) | ||||
| Mesh resolutions | ||||
| length, height, thickness (, , ) | ||||
| Particle properties | ||||
| total number | 272,000 | |||
| diameter [mm] | 0.5 | |||
| density [] | 2.5 | |||
| terminal settling velocity [] | 0.06 | |||
| particle stiffness coefficient [N/m] | 200 | |||
| normal restitution coefficient | 0.3 | |||
| coefficient of friction | 0.4 | |||
| Fluid properties and flow conditions | ||||
| kinetic viscosity [] | 1.5 | |||
| density [] | 1.0 | |||
| boundary layer thickness | 46 | |||
| bulk Reynolds number | 6,000 | 8,000 | 10,000 | 12,000 |
| mean flow velocity [m/s] | 0.39 | 0.52 | 0.65 | 0.78 |

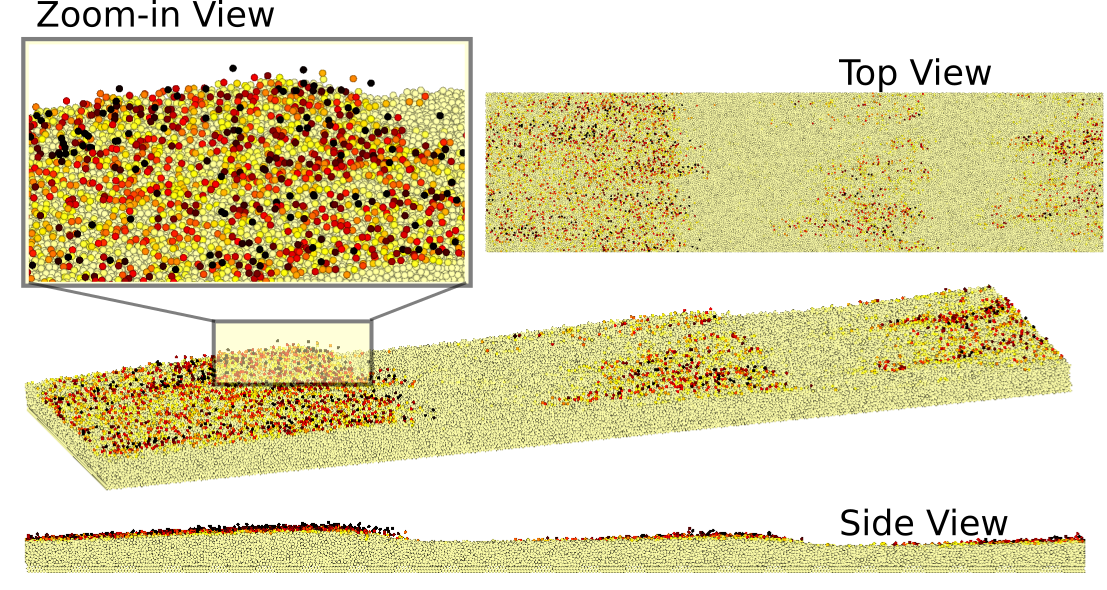
The dimensions of the domain, the mesh resolutions, and the fluid and particle properties are detailed in Table 1. The geometry of the domain is shown in Fig. 2(a), and -, - and - coordinates are aligned with the streamwise, wall-normal, and lateral directions, respectively. It is important to note that the computational domain sizes must be large than the size of the largest turbulent coherent structures and the largest bedform patterns that may develop during the simulations. Clearly, in the simulations no turbulent structures or bedform patterns large than the domain can develop, and an inadequate domain size would artificially suppress the development of these structures. On the other hand, as the sediment particle diameter is given and the CFD mesh needs to be fine enough to resolve the smallest energetic turbulent eddies, increasing the domain size would increase the total number of particles and the number of grid cells in the simulations and thus would increase the costs. Therefore, it is important to use a domain size that is large enough but not much larger in consideration of reducing computational cost. A recent study of Kidanemariam and Uhlmann (2017) has found that the minimum length to generate stable ripples is about 100. They further demonstrated that the dune features (i.e., height, wavelength, migration velocity) do not vary significantly when the computational domain length is larger than the minimum length. In this present simulations we used domain size of 312, which is larger than the minimum size required 100. The physical parameters of the simulation are also shown in Table 1. The particle diameter is 0.5 mm and the channel height is 16.5 mm. The sizes of small dunes generated in Case 1 is about 80 mm after 24s. The bulk velocities in the simulations varies from 0.39 to 0.78 m/s. For Case 1, the time step is s for the fluid flow and s for the particles.
The LES mesh in streamwise (-) and lateral (-) directions is uniform in size; whereas the grid segments in vertical (-) direction are progressively refined towards the bottom boundary. The boundary conditions for both pressure field and velocity field are periodic in both - and -directions. In -direction, zero-gradient boundary condition is applied for pressure field; no-slip wall condition is applied at the bottom for velocity field, and slip wall condition is applied on the top. A pressure gradient is applied on the whole domain to maintain the constant bulk flow velocity. To provide a bottom boundary condition for the moving particles, three layers of fixed particles are arranged hexagonally at the bottom (Gupta et al., 2016). A perturbation of the first layer of the fixed particles is added to avoid moving particles from forming a perfect lattice. This is because the perfect lattice of sediment particles can significantly reduce the sediment transport rate. The properties of the sediment particles and fluid flow used in the present simulations are consistent with the numerical benchmarks (Kidanemariam and Uhlmann, 2014a). To be consistent with the numerical benchmark, the linear contact model is also used. It should be noted that the viscous damping effect during the particle collision should be considered. Hence, the collision restitution coefficient used in the present work is 0.3, which is smaller than the coefficient for dry quartz. This is used in the DEM simulations of sediment transport problems (Schmeeckle, 2014; Kidanemariam and Uhlmann, 2014a).
The initialization of the present numerical simulations follows previous studies (Kidanemariam and Uhlmann, 2014a; Sun and Xiao, 2016a). A separate simulation of particle settling without considering the hydrodynamic forces is performed to obtain an initial configuration of the particles. In this settling simulation, particles fall from random positions under gravity with inter-particle collisions. To initialize the fluid flow, each simulation first runs 20 flow-through times with all particles fixed at the bottom.
5 Results
5.1 Shear velocity decomposition and averaged transport conditions
The simulation conditions listed in Table 1 gave rise to the development of mobile bedforms. Because of this, the pressure gradient needed to maintain the unit width discharge of water had to increase from the initial value within each simulation as more and more particles began to move, collide, and self-organize into bedforms. As will be discussed in the next section, bedforms grew in size from Case 1 to Case 2, and then began to wash out in Cases 3 and 4. As such, the total boundary resistance increased from Case 1 to 2, decreased from Case 2 to 3, and then increased again between Cases 3 and 4. This up and down behavior in the total resistance occurred even though the fluid discharge and velocity monotonically increased with each case or Reynolds number.
To make the results of the simulations more comparable to classic sediment transport theory, we decomposed the total shear stress into a frictional component and the bedform and collision-drag component with . The frictional component, , was calculated from the force needed to drive the flow at the given flow rate before significant particle motion or bedform development. This is the friction between the water and the bed at the sediment grain size scale. In contrast, the total shear stress values were obtained from the average of the total force needed to sustain the unit width discharge once the bedforms had fully developed. The contributions from the form drag and the collisions between suspended and the immobile particles were then inferred by taking the difference between the two, i.e., . Finally, following the conventions in sediment transport literature, we use the corresponding friction velocities defined as , and , respectively, to denote the three shear stress components. Shear velocity values for these three components are given in Table 2 along with key contextual sediment transport parameters, all of which were calculated using the friction shear stress . We have done the partition in a way that mimics what is often done in sediment transport calculations. That is, where the skin component of the drag is related to the drag that would be present given a fixed bed (same grain size but no bed forms), and form drag is the difference between the total drag (in the presence of bedforms and grain collisions) and the skin friction based on grain size.
The conditions in the numerical simulations are compared to the regime map obtained from the summary of experimental results, shown in Fig. 3. Figure 3(a) is plotted according to the Shields diagram of sediment transport. The Shields curve is plotted as solid line to denote the threshold for incipient sediment motion (van Rijn, 1984a). The yellow (shaded) region indicates the criteria for the initiation of suspended load. The dash-dotted curve denotes the threshold that the suspended load becomes dominant (Bagnold, 1966; Naqshband et al., 2014a). It can be seen in Fig. 3(a) that in Case 1, the suspended load is negligible. When the flow rate increases, the suspended load increases and becomes dominant in Case 4. The phase diagram of the generation of bedforms is plotted in Fig. 3(b) according to Southard and Boguchwal (1990). It can be seen that the conditions for Case 1 fall in region II, where small ripples are generated in experimental studies. Dune-like patterns are observed in the experimental studies when the conditions are consistent with Case 2. For Case 3 and 4, the hydraulic conditions fall in region V, which is an overlapped region of dunes, upper plane beds, and antidunes.


| Case 1 | Case 2 | Case 3 | Case 4 | |
| Shear velocity decomposition | ||||
| total shear velocity [m/s] | 0.037 | 0.081 | 0.072 | 0.088 |
| fluid friction shear velocity [m/s] | 0.032 | 0.045 | 0.057 | 0.069 |
| collisional and form shear velocity [m/s] | 0.019 | 0.067 | 0.043 | 0.055 |
| ratio of collisional/form drag to total, | 0.25 | 0.69 | 0.37 | 0.39 |
| Sediment transport conditions | ||||
| particle Reynolds number | 43 | |||
| critical Shields parameter | 0.032 | |||
| 1.88 | 1.33 | 1.05 | 0.87 | |
| Shields parameter | 0.15 | 0.28 | 0.44 | 0.65 |
| mobility condition | 4.6 | 8.5 | 13.6 | 20.0 |
| total load | 0.04 | 1.12 | 0.97 | 4.65 |
| suspended load fraction, | 0.14 | 0.17 | 0.43 | 0.66 |
| Bedform characteristics | ||||
| wavelength () | 160 | 312 | 312 (a) | N.A. |
| height () | 3.1 | 11.6 | 7.2 (a) | N.A. |
| migration velocity () | 0.017 | 0.053 | 0.088 (a) | N.A. |
| bedform transport rate | 0.06 | 0.93 | N.A. | N.A. |
Note: (a) While bedform characteristics are presented for Case 3, it should be noted that any structure that was present at a given time was highly unstable and significantly less dune-like than the bedforms in Cases 1 and 2.
5.2 Bedform morphology and evolution
The bedform morphology and evolution obtained from numerical simulations of various bulk Reynolds numbers are compared in this section. In our previous study (Sun and Xiao, 2016a), we had already demonstrated that the LES–DEM model is capable of self-generating bedforms with physically meaningful heights, wavelengths, and migration velocities. The simulated characteristics had been validated against experimental measurements and interface-resolved simulations reported in the literature (Kidanemariam and Uhlmann, 2014a). The bedforms that develop in the present study are similar. Based on the calculated Shields parameter, to 0.65, and a particle Reynolds number of (Table 1), where is the submerged specific gravity. We can say that the simulation conditions are inline with those that should give rise to bed load bedforms that transition to suspension dominated bedforms according to the Shields-Parker river sedimentation diagram (García et al., 2000).
The space-time evolutions of the bed surface at various bulk Reynolds numbers are plotted in gray scale in Fig. 4. This aims to demonstrate the variation of the surface in the temporal-spatial domain. It should be noted that bedforms generated in the simulations are three-dimensional, but the lateral-averaged bed surface profiles are plotted. The surface of the bed is determined by using a threshold value according to Kidanemariam and Uhlmann (2014a). Dark and light oblique stripes, which are the peaks and troughs of the bedforms respectively, can be observed at all Reynolds numbers. Moreover, the bedforms at all bulk Reynolds numbers are developed from the perturbations on the flat bed, which is consistent with the observations by Kidanemariam and Uhlmann (2014a). To facilitate presentation, the physical time is normalized by the constant , and thus the resulting non-dimensional time is denoted as . Figure 4(a) shows that the slope of the stripes after non-dimensional time is smaller than that of . The decrease of the slope indicates the bedform migration velocity decreases due to the growth of the bedform, which is also observed in previous experimental studies (Ouriemi et al., 2009). Since flow rate is constant and sediment transport rate does not vary significantly when the bedforms are generated, larger bedforms move slower (Paarlberg et al., 2006). Comparing the slope of the stripes in each case (Fig. 4), one can observe that migration velocity increases with the Reynolds number or shear. This occurs even though the bedforms grow in size from Case 1 to 2, indicating an overall increase in the sediment transport rate due to the faster moving particles and bedforms.
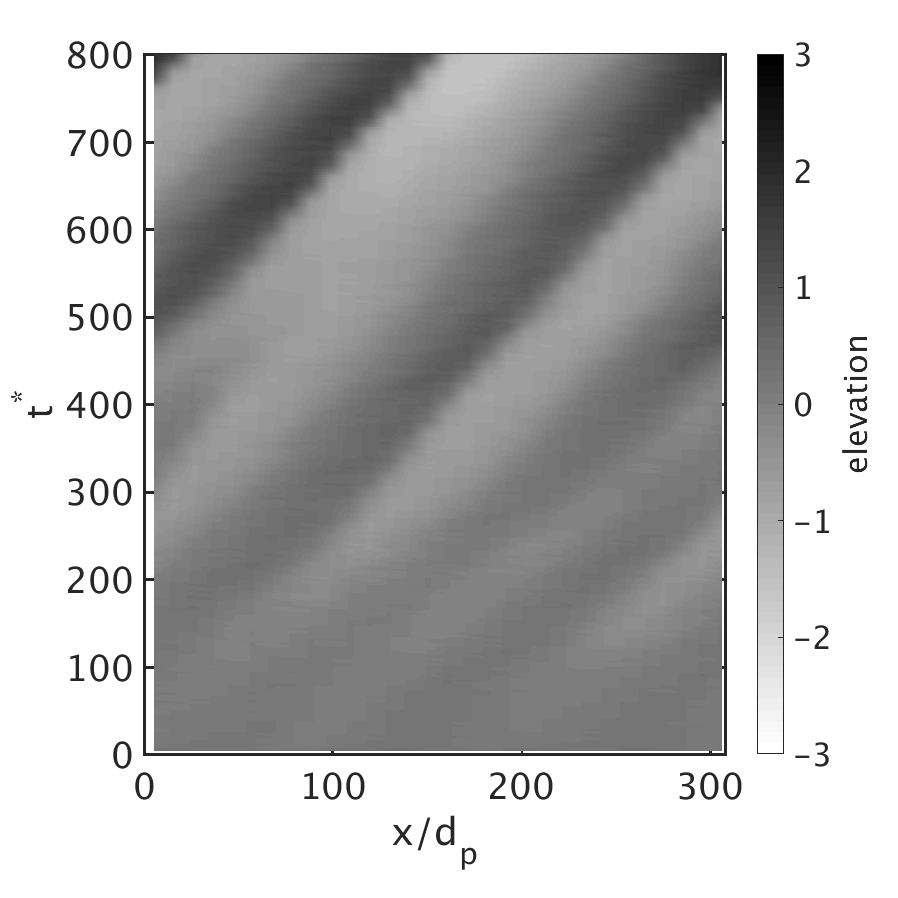
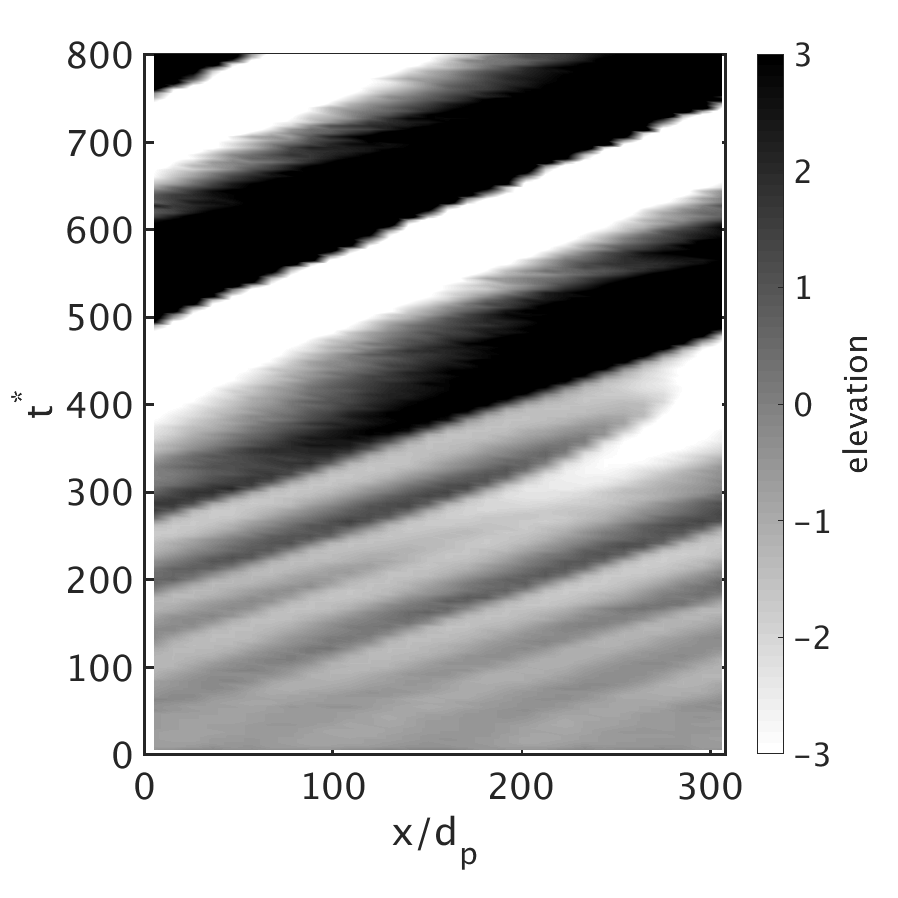
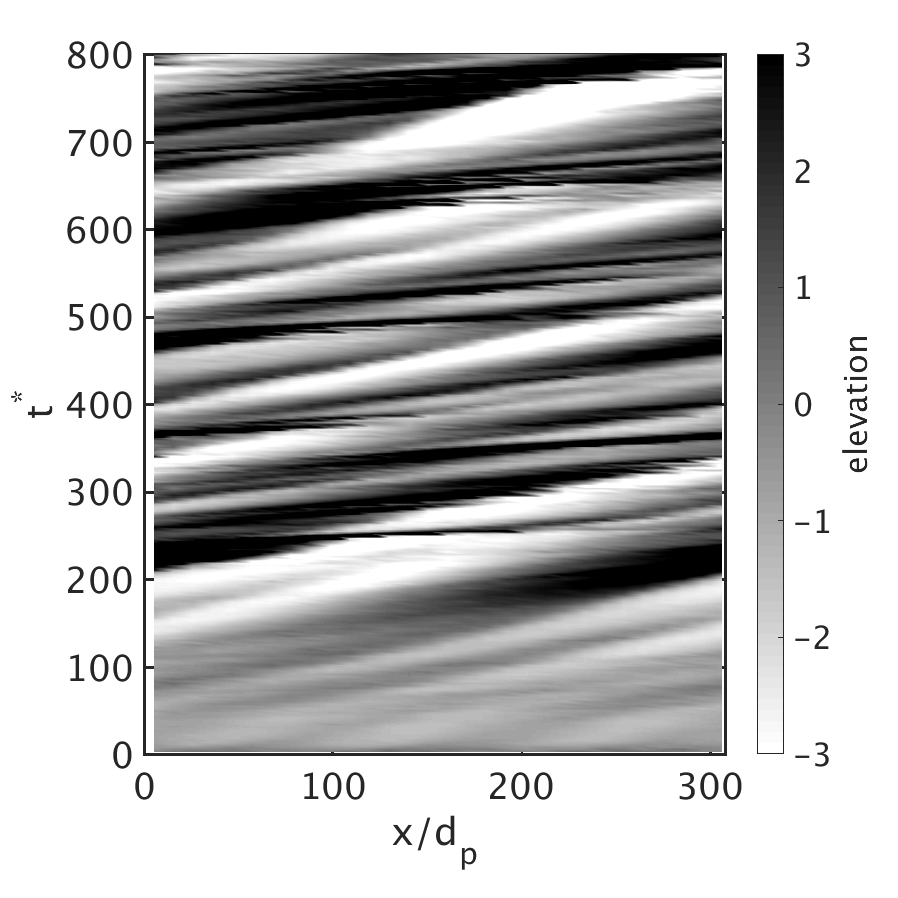
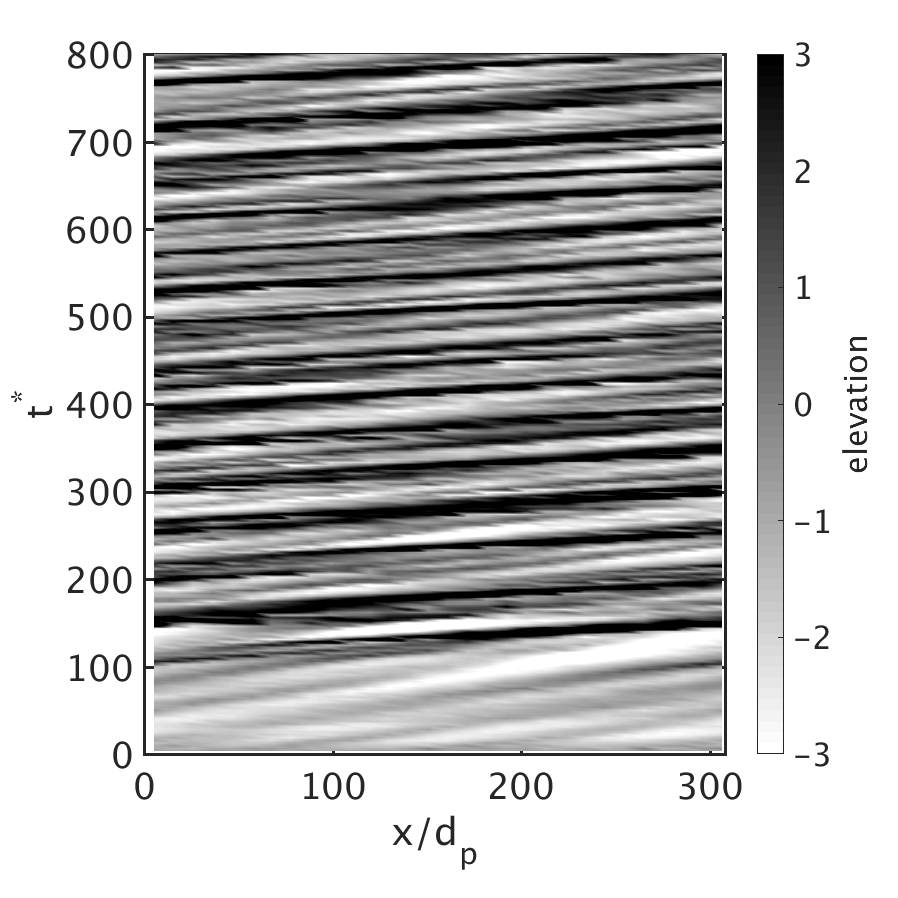
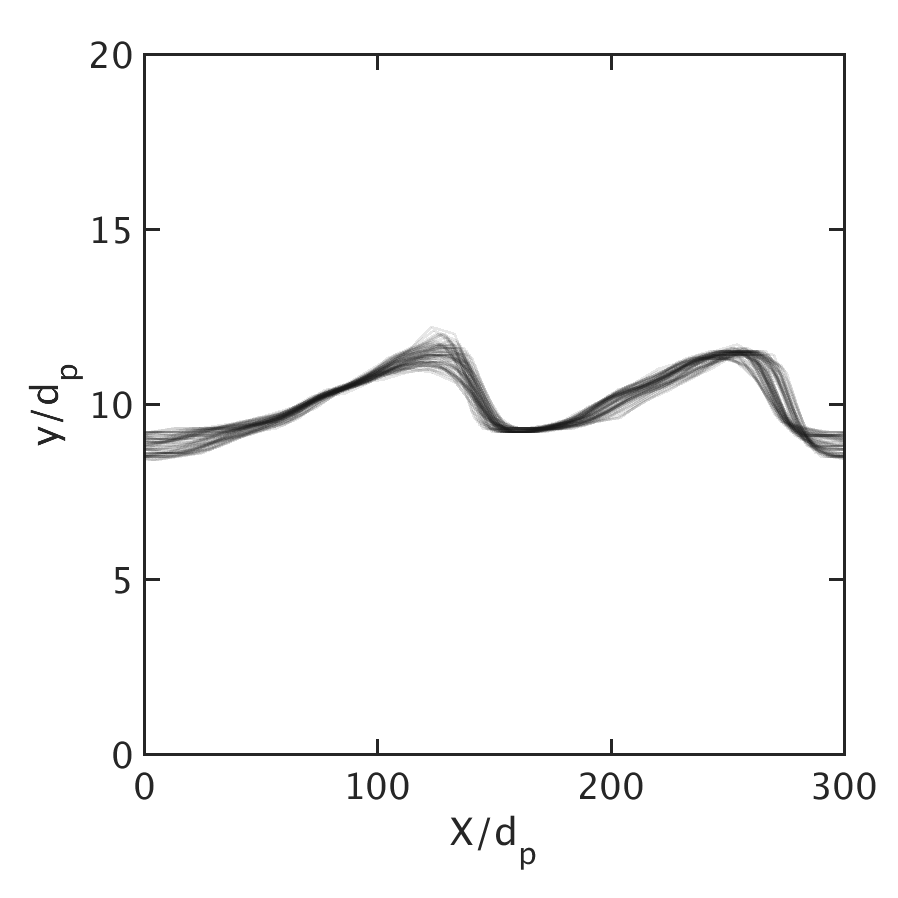
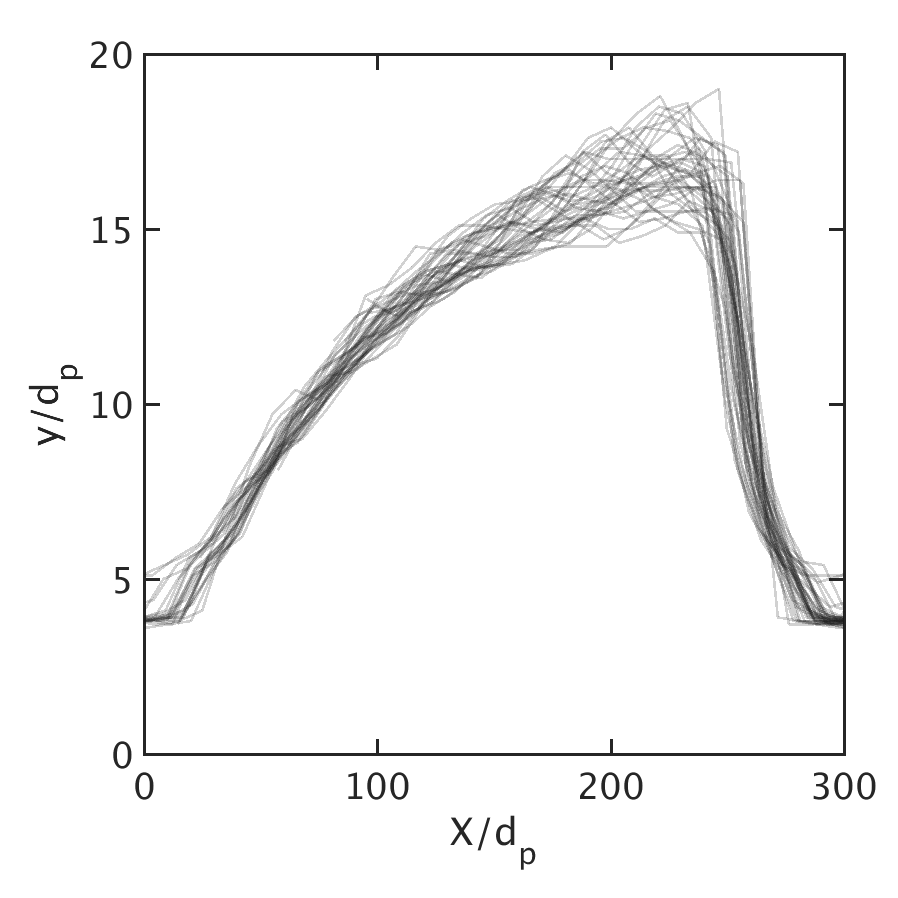
It can be also seen in Fig. 4 that the bedform surfaces are stable in Cases 1 and 2, and unstable in Case 3 and 4. To further investigate the stability of the bedform, the profiles of the bed surfaces obtained in each case during are plotted in Fig. 5. The time interval is selected because the bedforms are fully developed during this time. The profiles of the bed are plotted using the relative longitudinal location with respect to the bedform, , where , is the fixed downstream direction, and is the bedform migration velocity. When the bedform is stable, bedform surface profiles are overlapping when plotted in the moving-frame. It can be seen in Figs. 5(a) and 5(b) that the self-generated bedforms in Case 1 and 2 are stable and the bed surface profiles are highly overlapped. In contrast, the bed profiles in Fig. 5(c) are not overlapping, and there is an offset of about between the time-averaged bed profiles obtained when and . The offset between the bed profiles at different time intervals shows that the bed surface profile at bulk Reynolds number = 10,000 (Case 3) is less stable than those at lower Reynolds numbers or shear. This suggests that the present simulation at = 10,000 captures the transition from ‘dune migration’ to ‘suspended sediment transport’. At even higher bulk Reynolds number = 12,000, shown in Fig. 5(d), the time-averaged bed profiles when and fluctuate even more than those at = 10,000. Although bedforms are still generated at = 12,000, they are very unstable because the shear stress of the fluid flow is high enough to wash out the bedforms almost immediately after they appear. The transition from bedform inception to washout conditions is also observed in the experimental studies (Bridge and Best, 1988; Bennett et al., 1998; Baas, 1994). From the experimental studies, the wavelength of the bedform decrease slightly compared to the fully-developed bedform, which is consistent with our simulation results. The height of the bedform decreases more significantly than the wavelength in both experimental measurements and the present simulations.
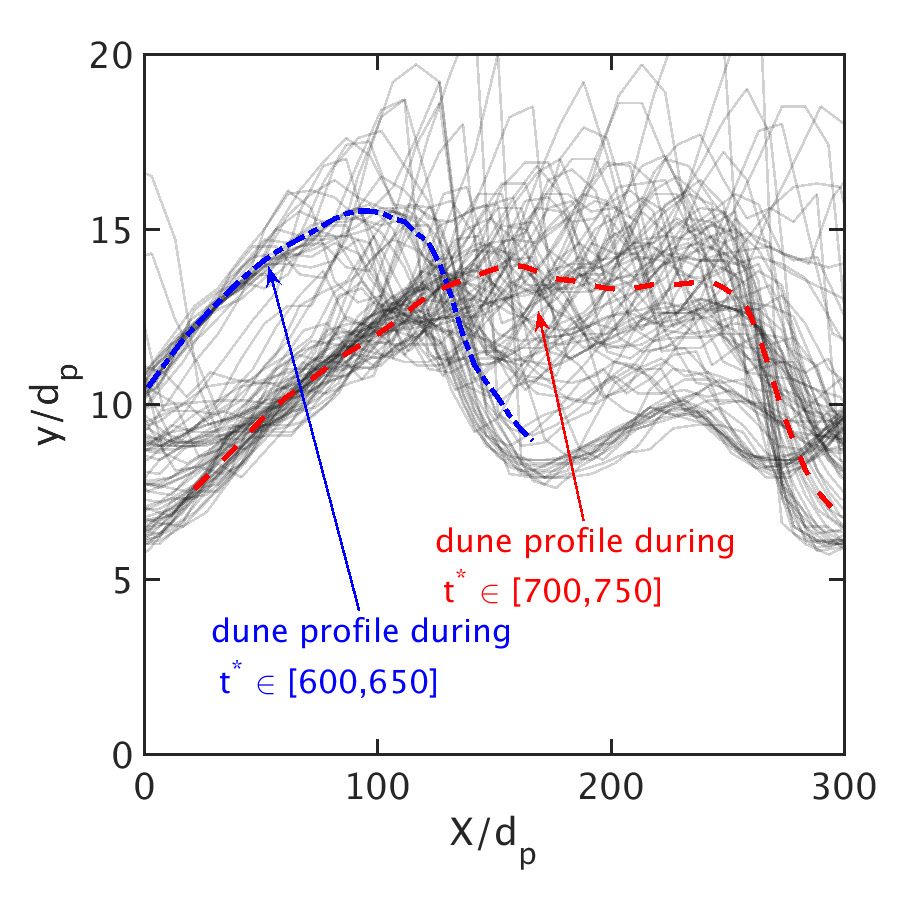
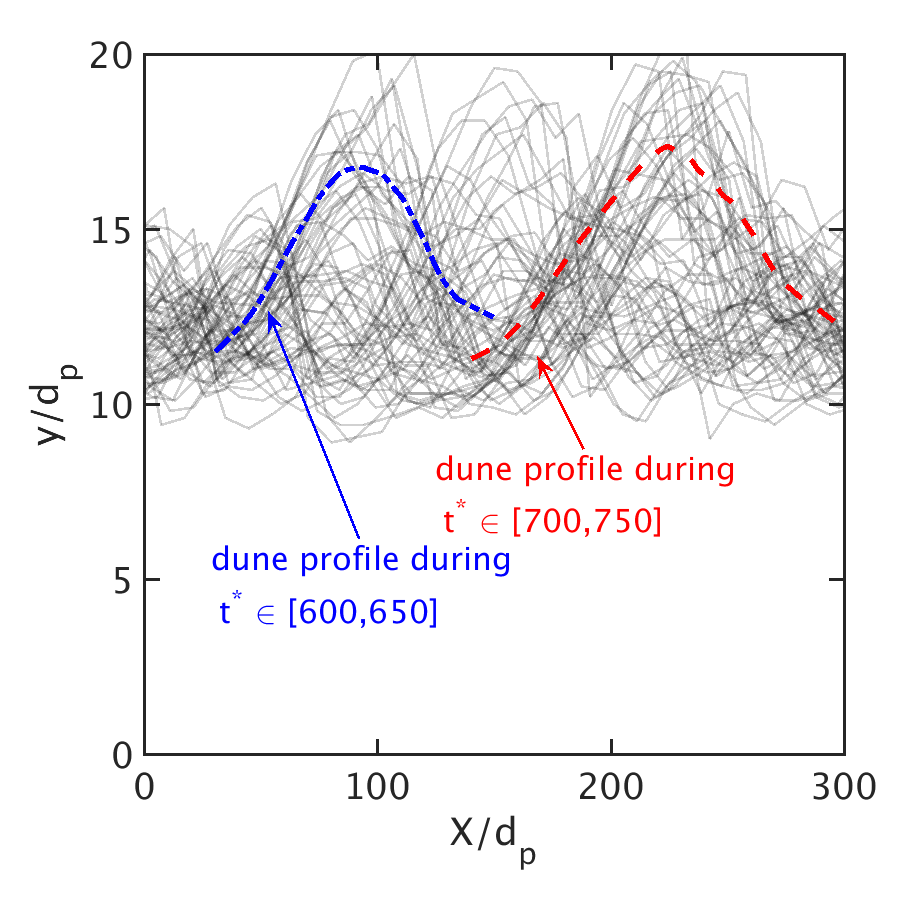
To quantitatively compare the features of the bedforms at different bulk Reynolds numbers, the height , the wavelength , and the migration velocity of the bedforms obtained in the present simulations are summarized in Table 2. The height and wavelength of the bedforms are calculated from the averaged bed surface profiles, and the migration velocity is obtained from the slope of the stripes in Fig. 5. Since the bedforms generated at are highly unstable, these features are presented during when the bedforms appear at all Reynolds numbers. When bulk Reynolds number increases from 6,000 to 8,000, the wavelength of the bedforms increases from 160 to 312, and the height grows from to . This increase of the wavelength and height indicates the bedforms grows faster at higher Reynolds numbers, which is also observed in the experiments (Ouriemi et al., 2009). This is attributed to the fact that the sediment transport rate increases significantly when the flow rate increases. As can be seen in Table 2, the bedform height decreases when bulk Reynolds number increases from 8,000 to 12,000. Although the sediment transport rate still increases, particles begin to have longer jump length or move in suspension, resulting in a move towards the washout of the bedforms. In addition, the increase of the non-dimensional bedform migration velocity is observed in the present simulations. When the flow velocity increases, the growth of sediment transport rate is much larger than the increase of flow velocity, and thus the non-dimensional bedform migration increases.
5.3 Individual particle transport characteristics
A unique advantage of the LES–DEM approach over low-fidelity, continuum-scale simulation approaches is its capability to capture the trajectories of individual sediment particles. To fully utilize this advantage offered by the high-fidelity approach, we compare the trajectories of sediment particles when moving over the bed surface at different bulk Reynolds numbers. Our aim in plotting the trajectories of individual sediment particles is to demonstrate the variation of the particle behavior at different bulk Reynolds numbers and under different sediment transport regimes (i.e., bed load, mixed, and suspended load). In addition, the motion of the buried individual particles at bulk Reynolds number = 6,000 is presented. The study of the burial of the individual particles aims to investigate the trajectories of sediment particles during bedform migration process after they jumped over the crest on the bedform.
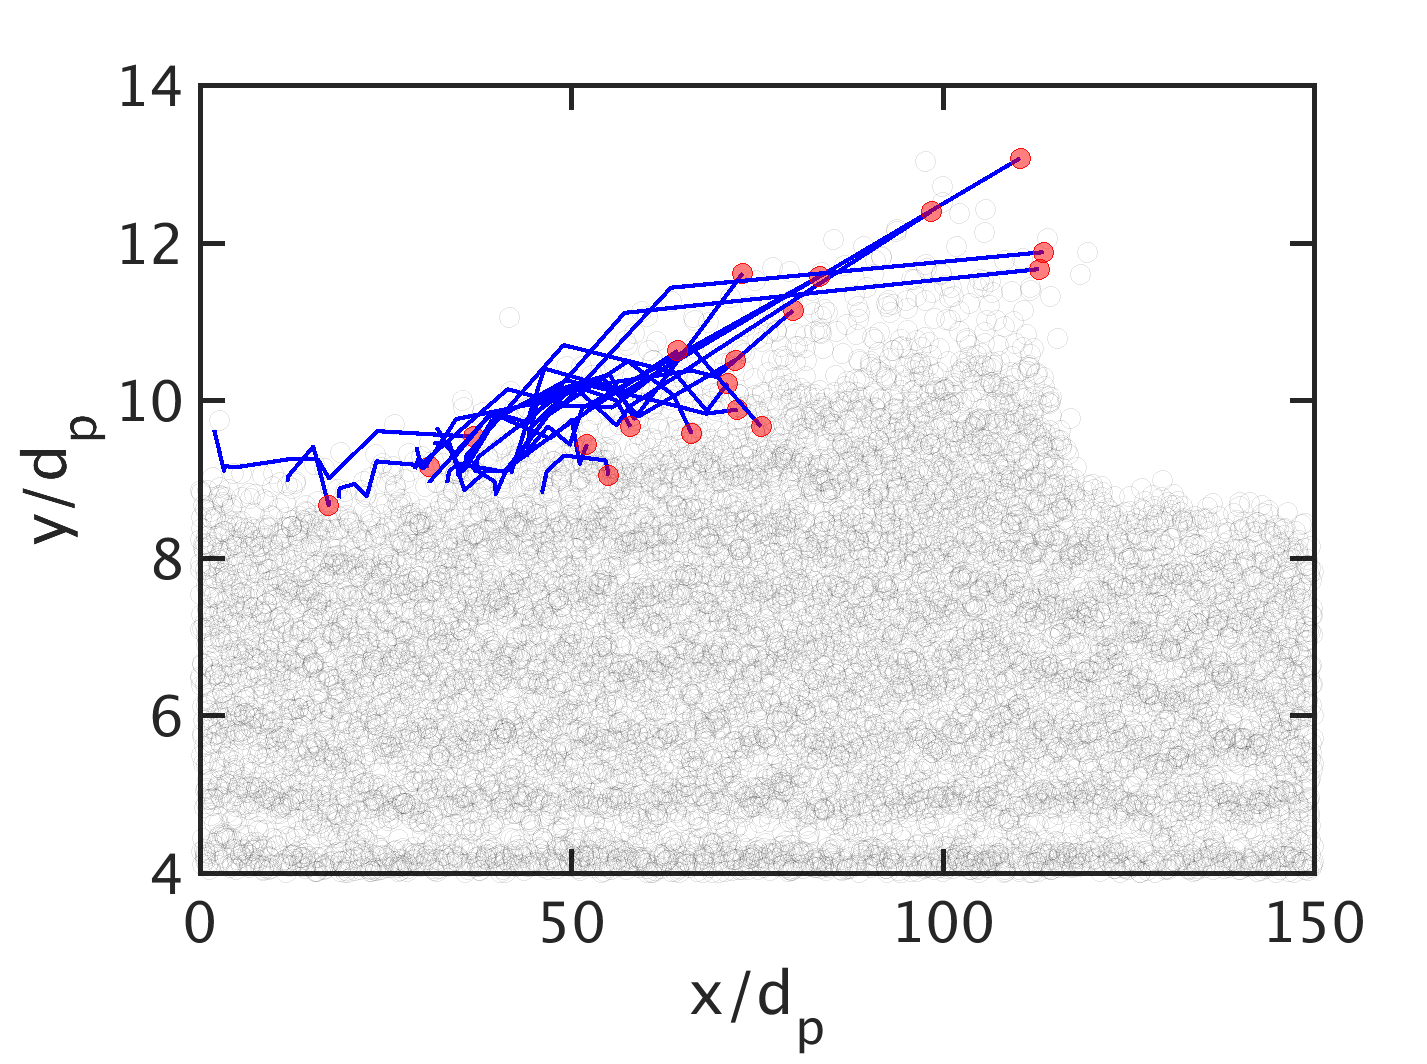
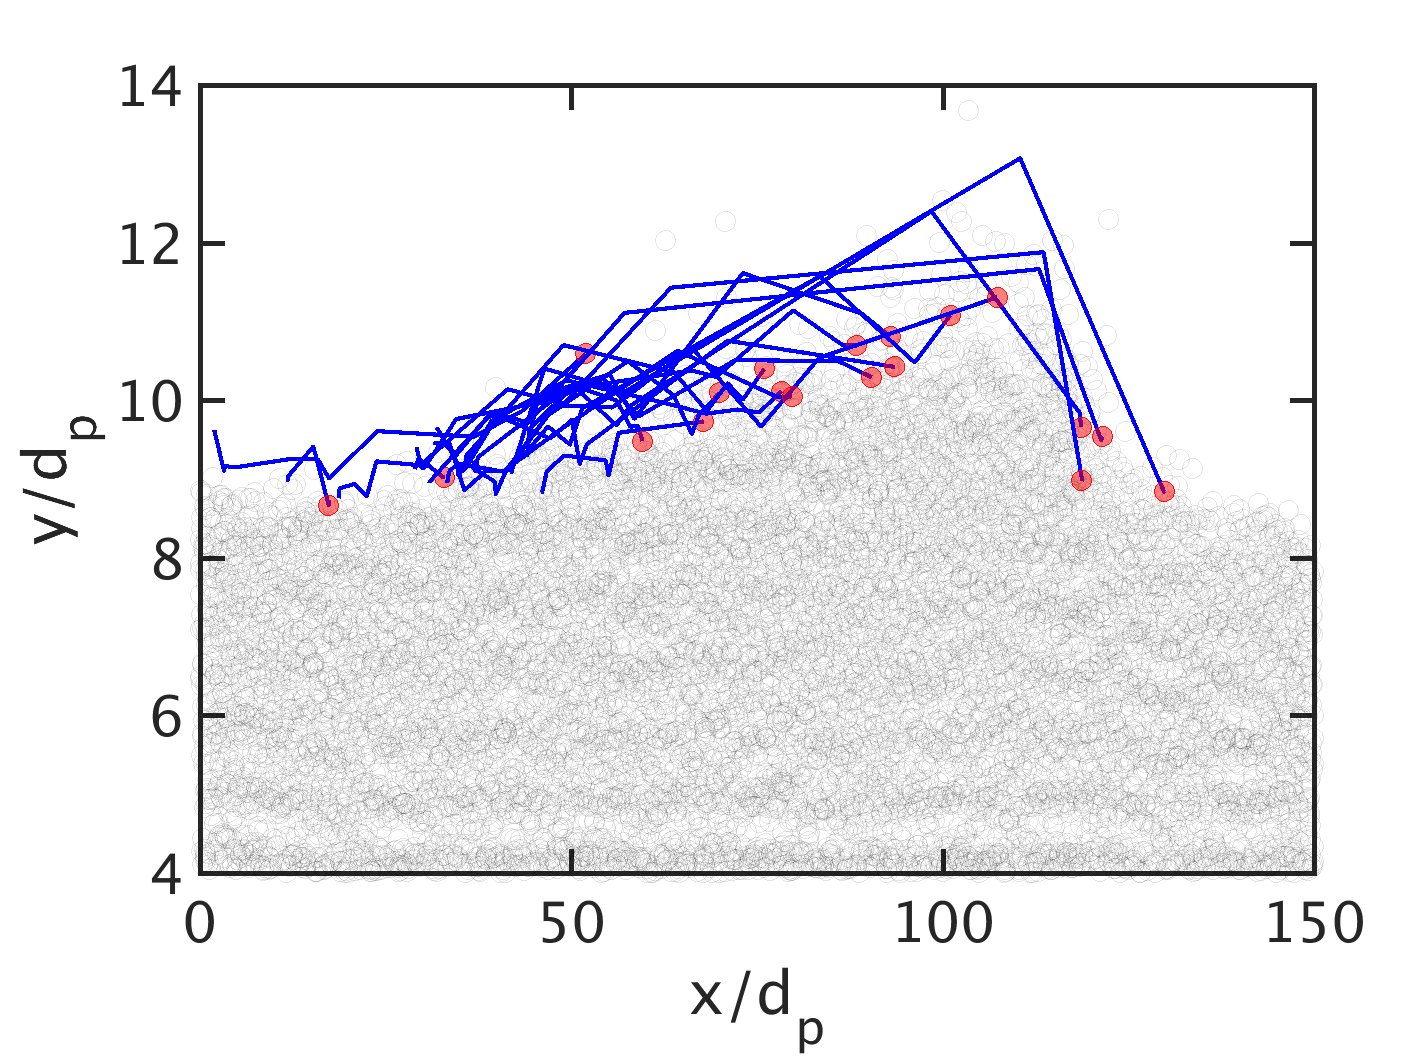
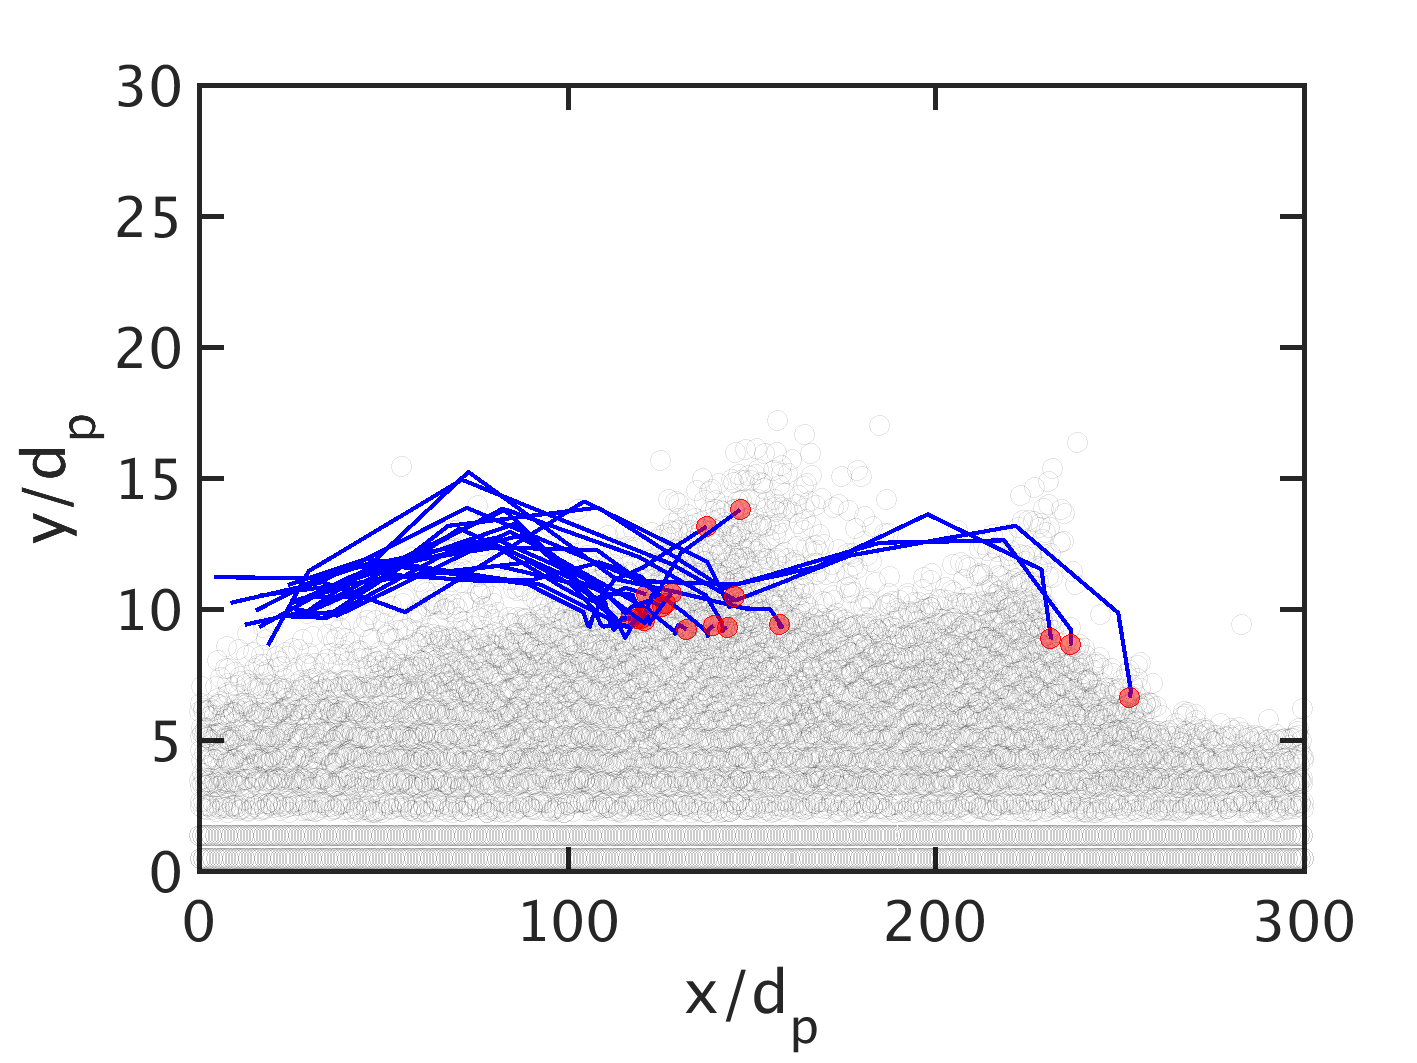
The snapshots of the individual particles jumping over the crest at bulk Reynolds number = 6,000 during are shown in Fig. 6. To demonstrate the saltation process of the sediment particles, we randomly selected 20 particles with initial velocity m/s on the stoss side and plotted their trajectories. The interval between two consecutive snapshots is , or equivalently s at . It can be seen in the figures that overall behavior of the selected particles on the bed surface is similar. On the stoss side, these selected particles gain energy from the fluid flow and move faster than the bedform. However, on the lee side, the flow velocity decreases after the peak of the bedform, and thus the deposition of the particles can be observed. Since the particles on the stoss side jump over the peak of the bedform and deposit on the lee side, the bedform progresses downstream.
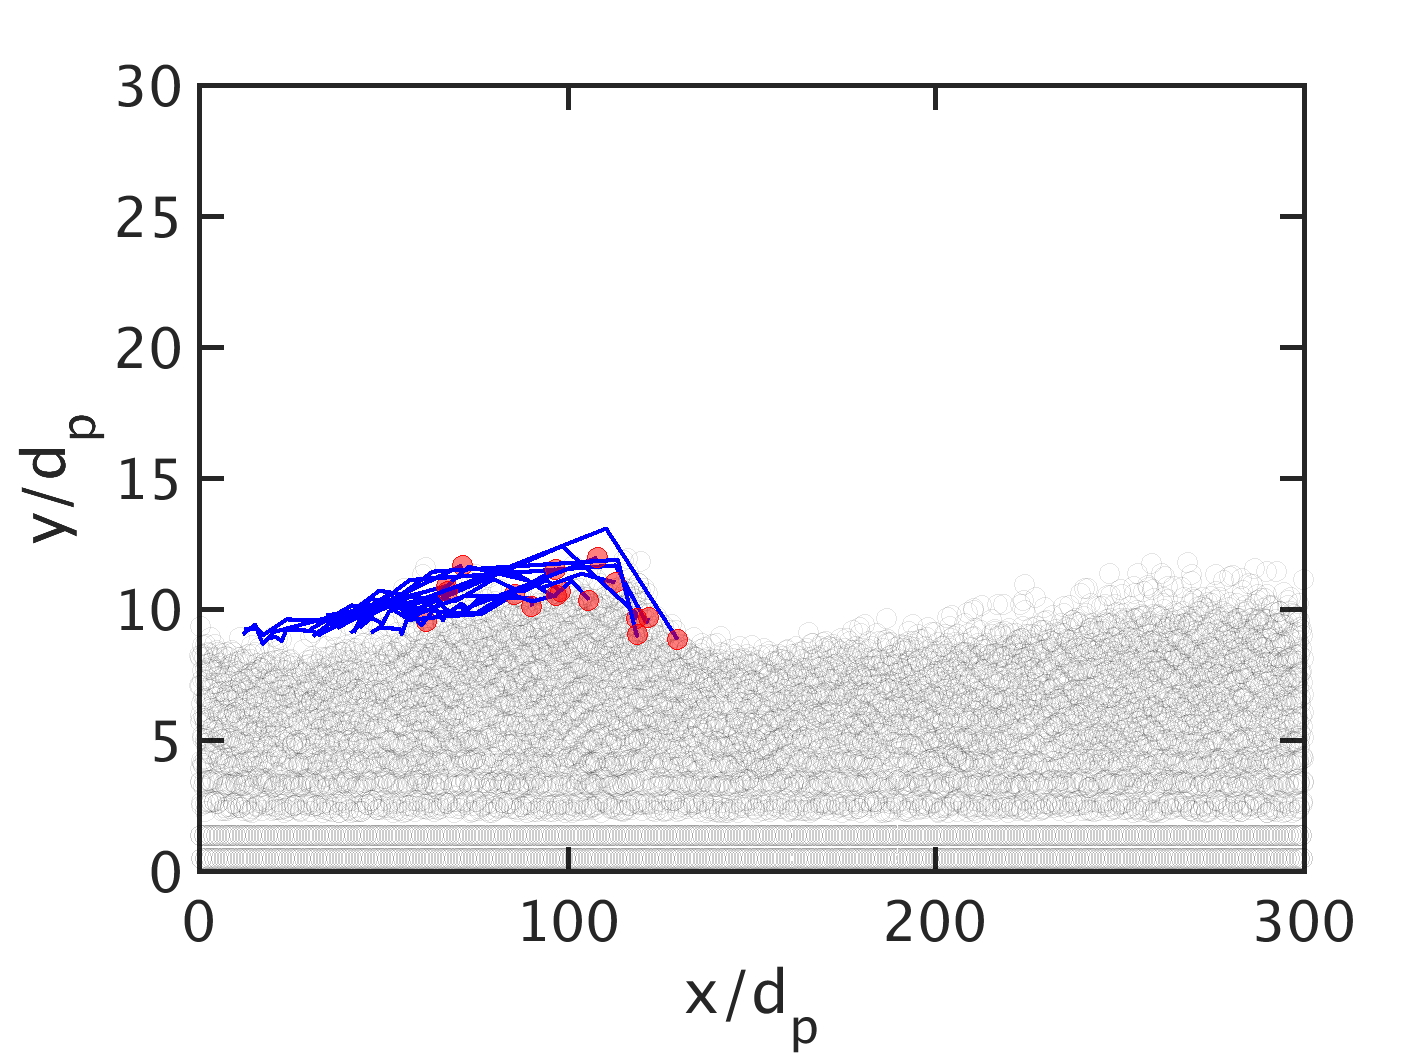
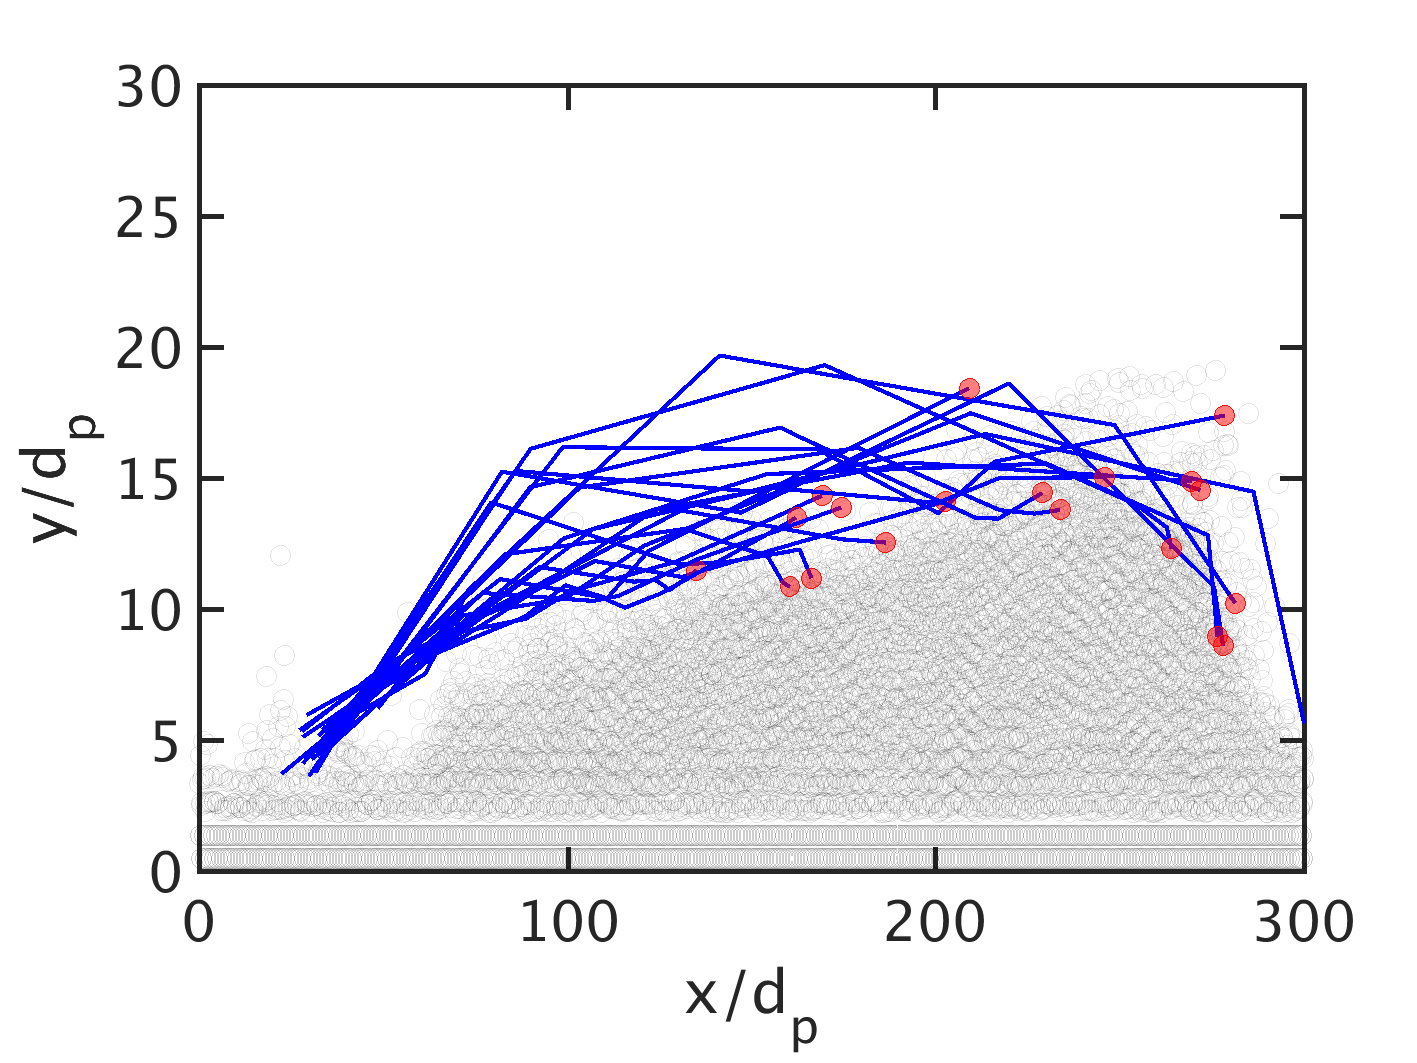
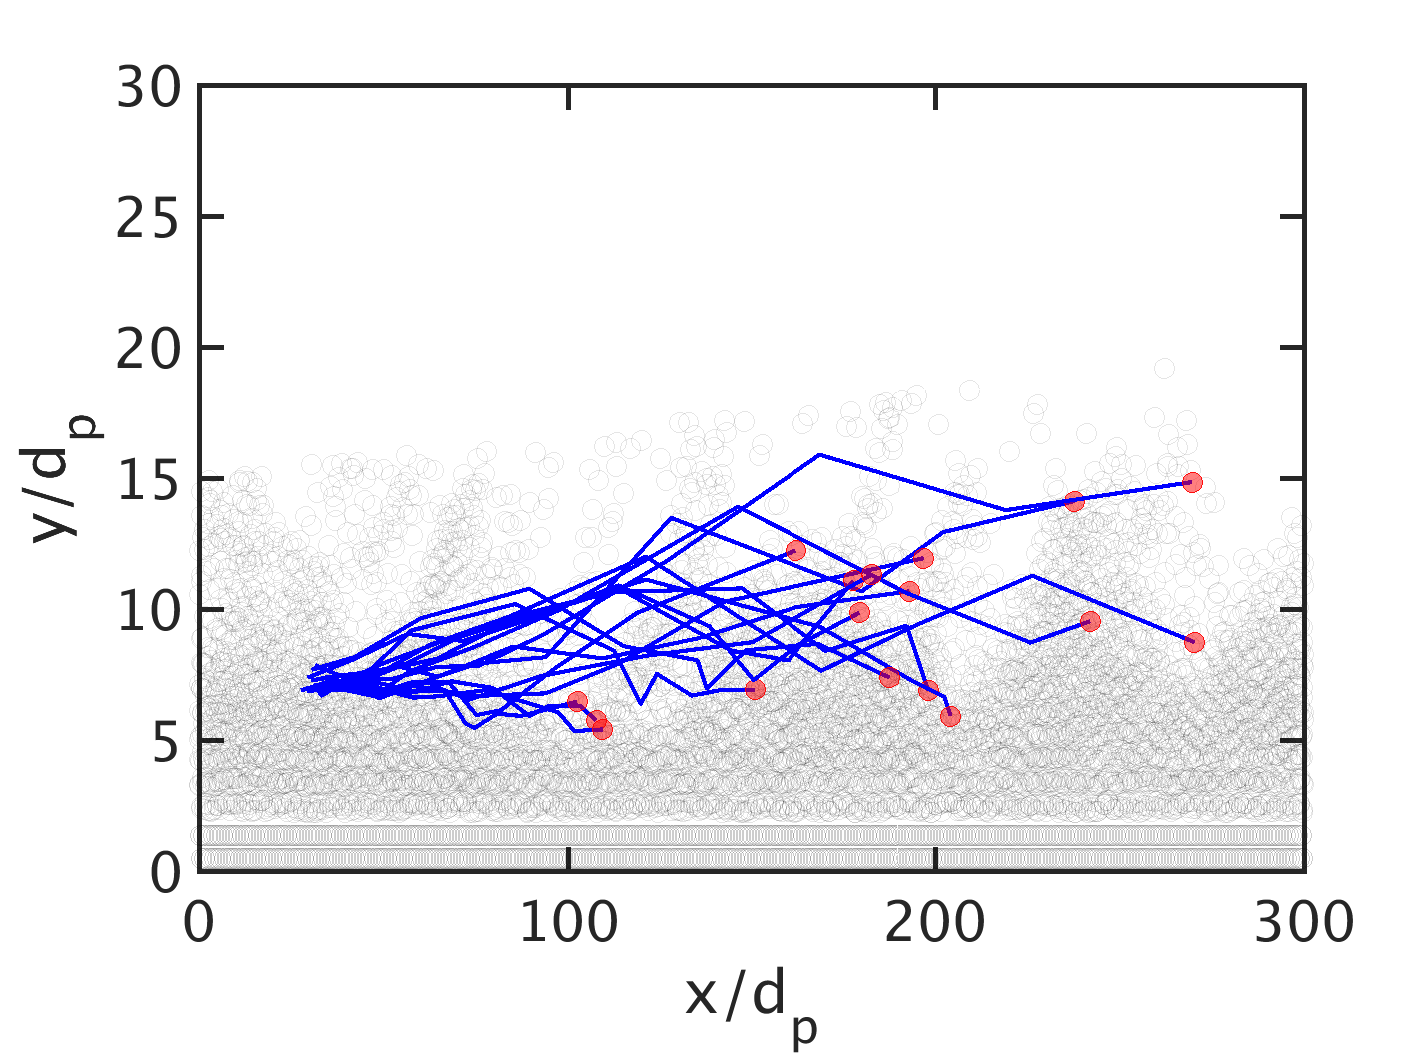
The trajectories of individual particles at various bulk Reynolds numbers during in the longitudinal saltation process are shown in Fig. 7, which is to demonstrate the variation of longitudinal saltation in different flow regimes. When the bulk Reynolds number increases from 6,000 to 8,000, the jumping length of the particles significantly increases. At = 8,000, both the bulk velocity and the height of the bedform in the channel are larger than those at = 6,000, and thus the flow velocity on the stoss side of the bedform increases. Therefore, the longitudinal jumping velocity of the individual particle in the flow and the jumping length also grow. However, at bulk Reynolds number = 12,000, the bedform is washed out and behavior of the selected particles is not associated with the surface of the bed.
The probability density functions of the particle jumping distances are plotted in Fig. 8. The saltation of sediment particles is determined by using as threshold velocity. At bulk Reynolds number = 6,000, the peak of the probability density function is at , which is much smaller than the bedform wavelength . This is because at = 6,000 the longitudinal saltation occurs when the particles are close to the peak of the bedform. At this Reynolds number, the probability density of the particles jumping over is small. This indicates the number of bypassed sediment particles is negligible and the wavelength in this case is stable. At = 8,000, the peak of the probability density function moves to . When bedform is generated in the channel, the flow field on the stoss side would be influenced by the bedform and a vertical flow velocity can be observed (Naqshband et al., 2014b). Hence, the resident time of jumping particles is longer and the peak in the probability density function increases. At = 10,000, the peak of the probability density function is also at . Due to the increase of bulk flow velocity, the number of particles jumping over longer distances increases.
When the Reynolds number continues to increase to 12,000, the probability density of the jumping distance of is significantly larger than those at smaller Reynolds numbers. The increase of the probability density of long-jumping particles is because the suspended load at = 12,000 is dominant and the number of bypassed sediment is much larger. In addition, a small peak at is observed from the probability density function. The magnitude of this peak is smaller for = 12,000 than for = 8,000 and 10,000. This is because the bedform formed at = 12,000 is washed out and have smaller wavelength (shown in Fig. 5).
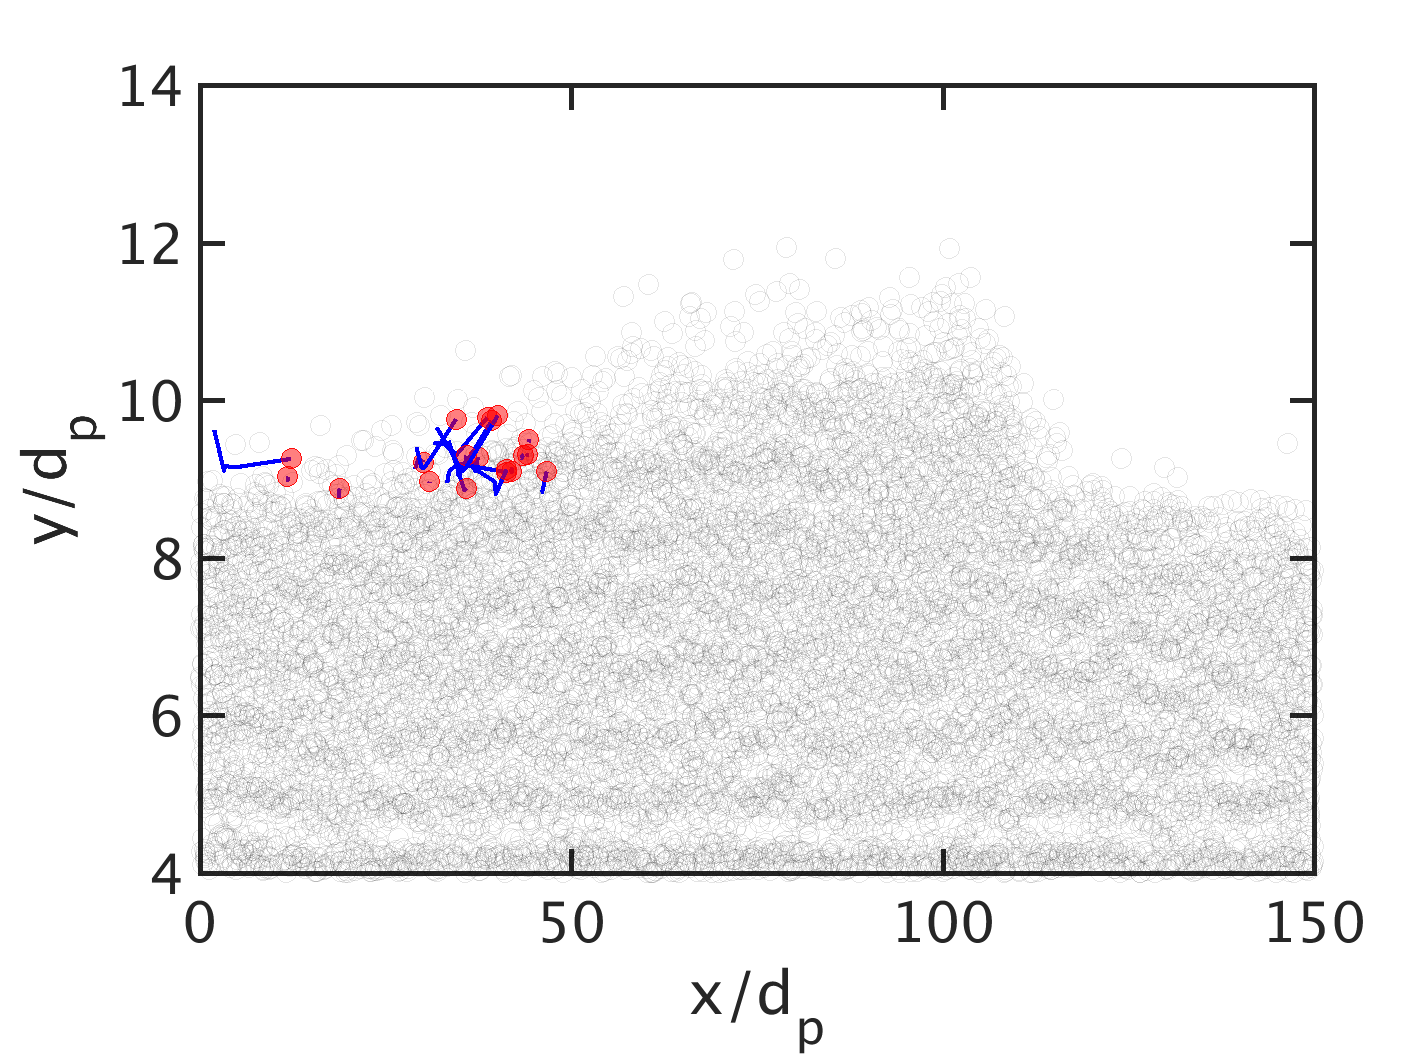
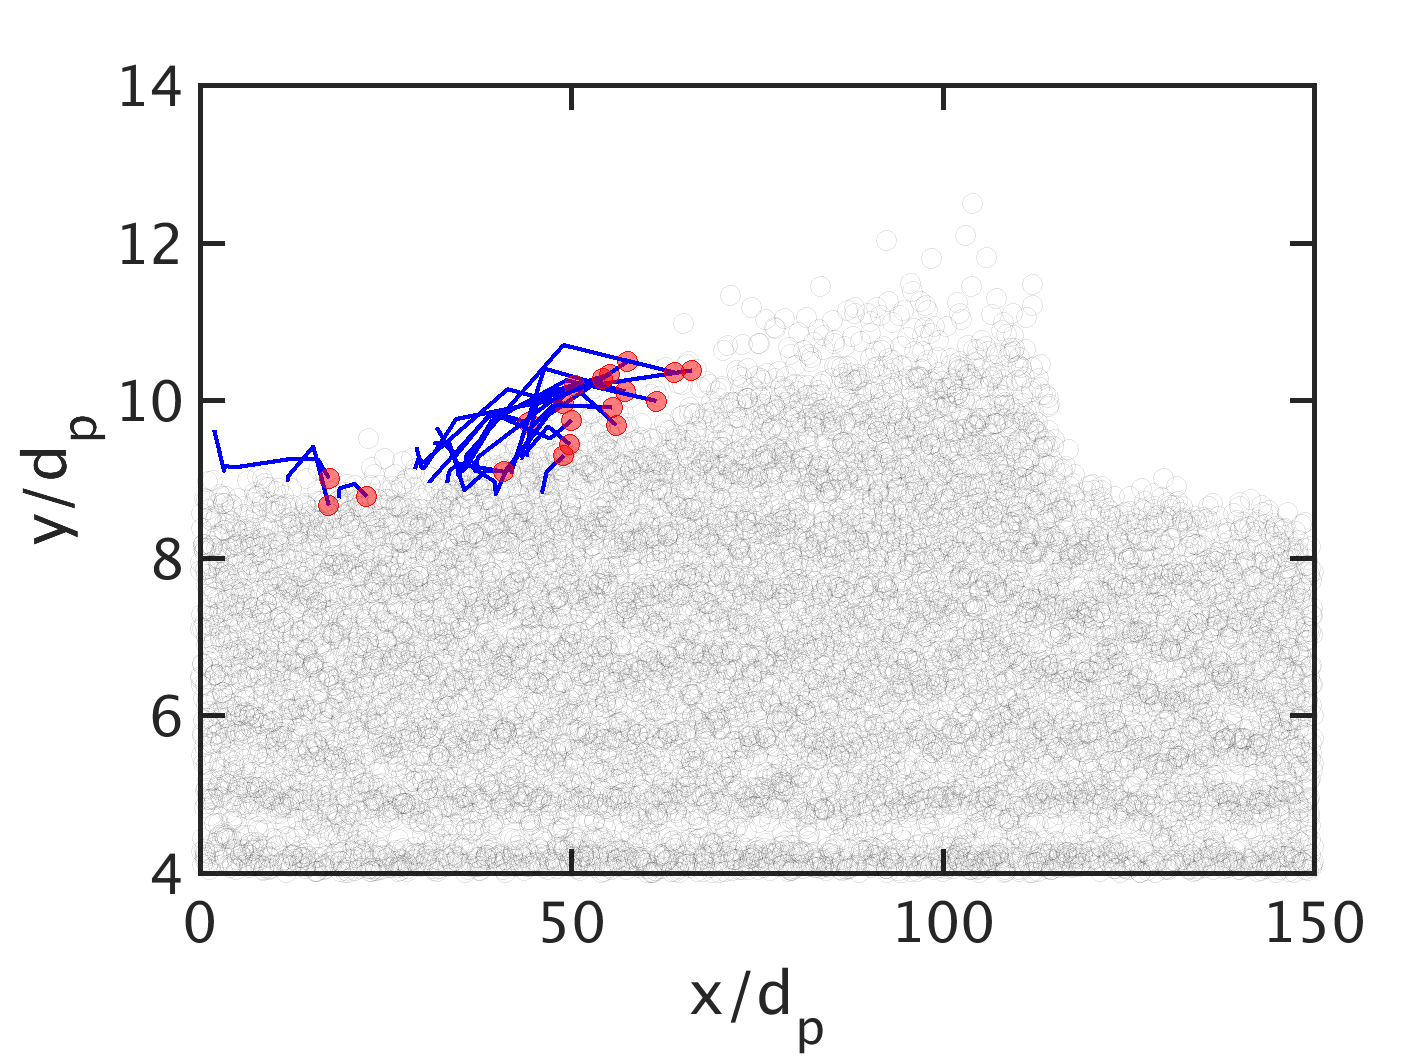

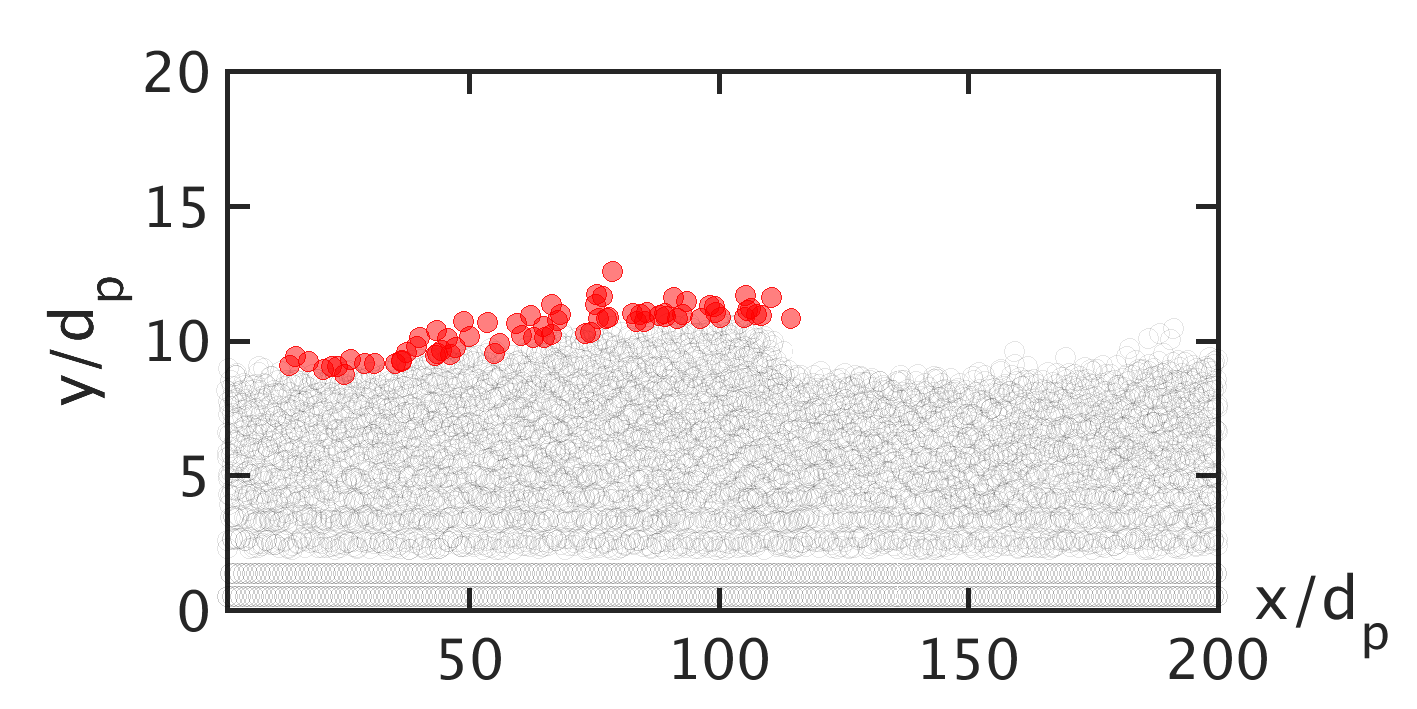
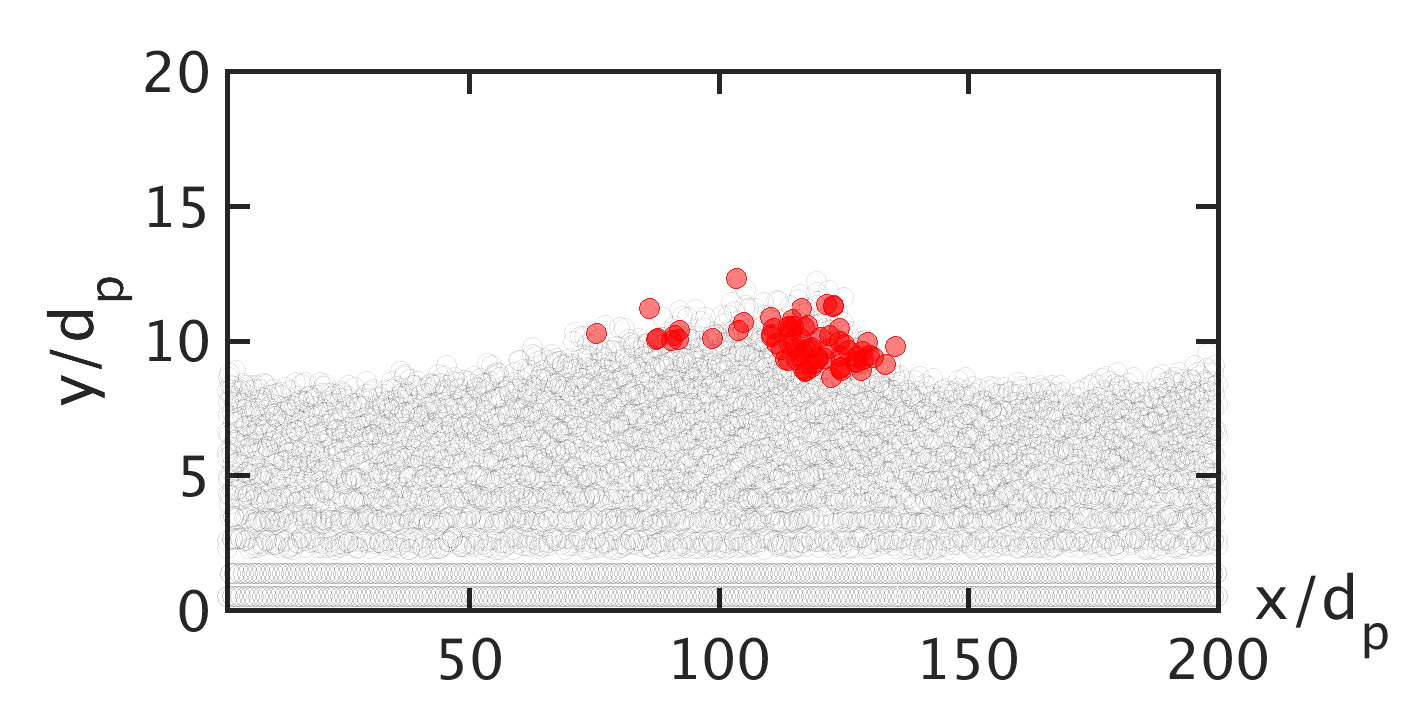
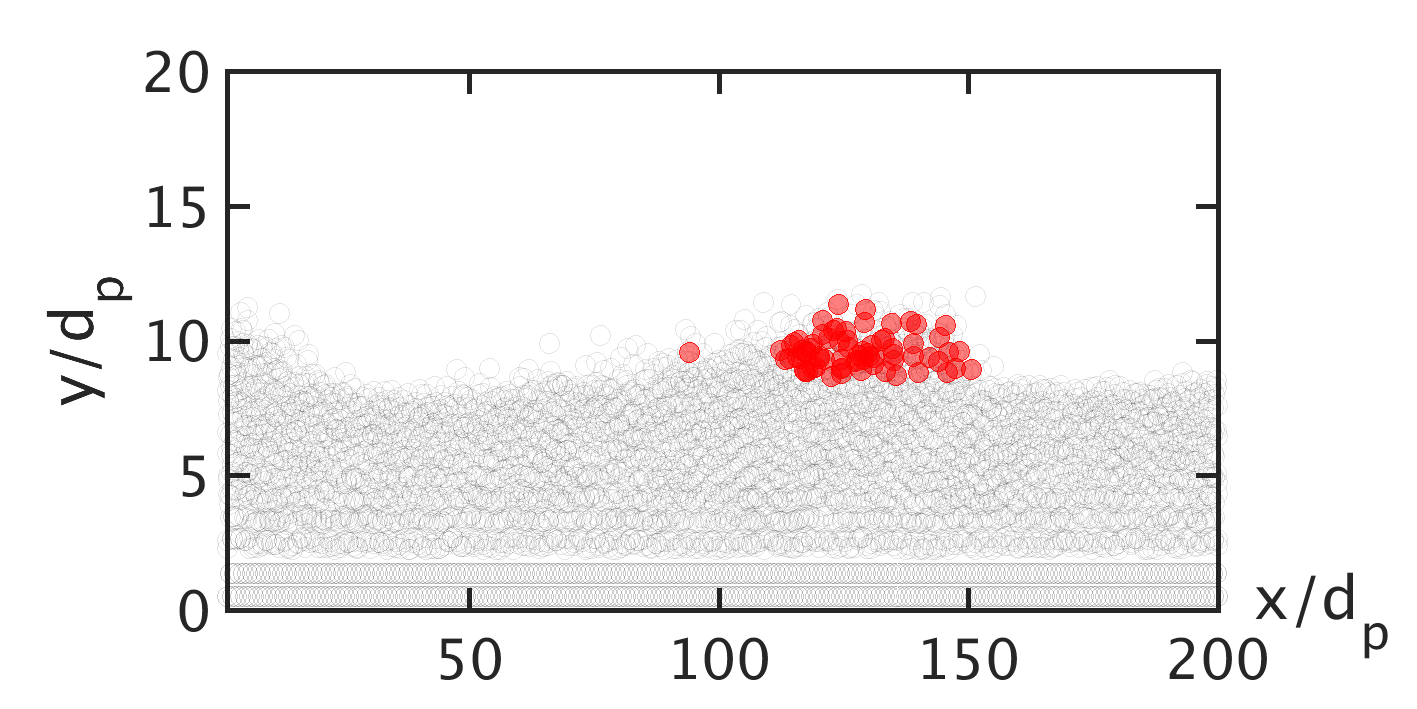
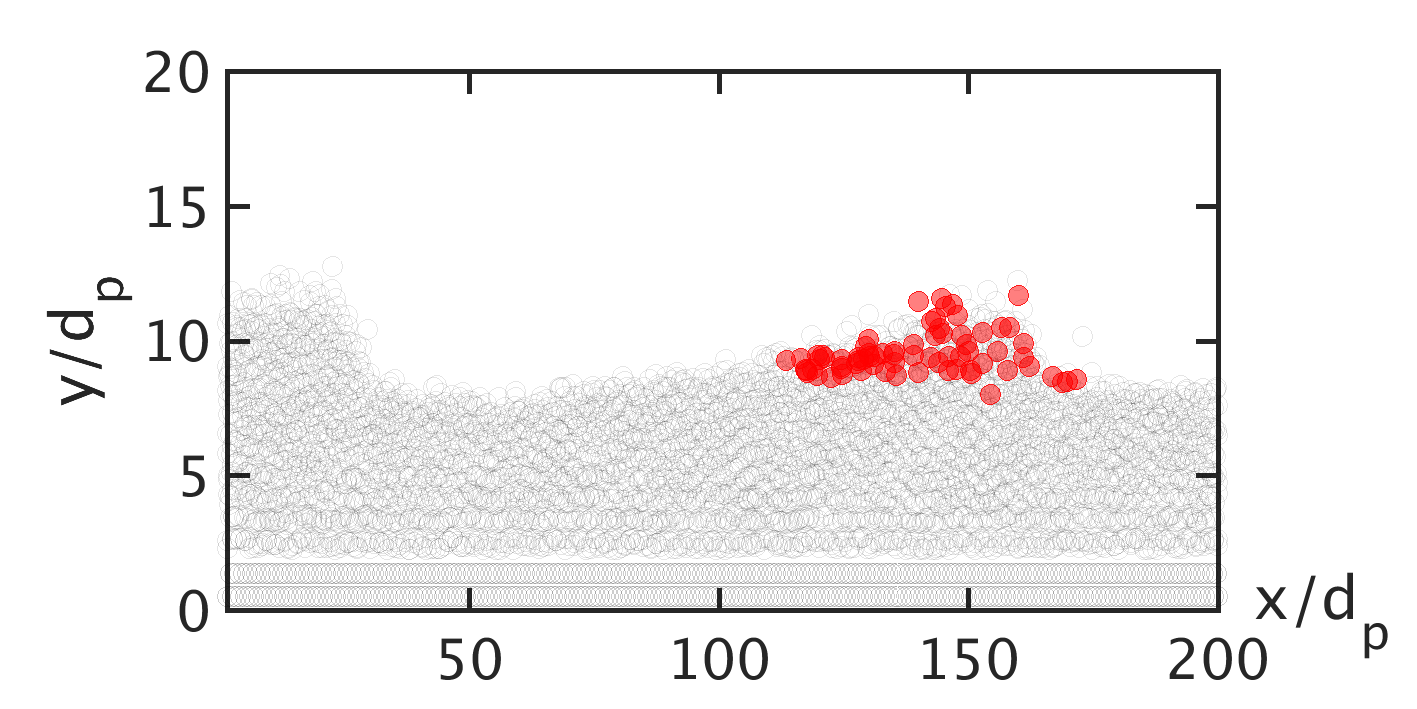
The snapshots of the burial process of individual particles at bulk Reynolds number = 6,000 are demonstrated in Fig. 9. This study of the burial of sediment particles aims to demonstrate the behavior of the deposited sediment particles during the bed migration process after they jumped over the crest of the bedforms. This is complementary to the previous study of the trajectories of the jumping particles. We selected 100 representative particles on the surface at and highlighted them in red (shade) color. It can be seen in Fig. 9(a) that the highlighted particles are rolling and jumping on the bed surface at the initial time step. At , these highlighted particles are deposited on the same location () at the lee side of the bedform, which is shown in Fig. 9(b). Comparing from the locations of the highlighted particles in Fig. 9(b) and 9(c), when the particles are buried in the sediment bed, they do not move with the migration of the bedform. This is because the buried particles are below the bed surface and the influence of fluid flow on them is negligible. When the bedform continues to move forward, shown in Fig. 9(d), some buried particles are exposed on the bed surface because of flow erosion on the stoss side. Once the previously buried particles are exposed on the bed surface, they can be entrained in the fluid flow and move on the surface of the bed. Compared with the observations in Fig. 6, the buried particles do not move with the migration of the bedform, although the bedform progresses downstream due to the entrainment and deposition of the particles on the bed surface. Visualization of the burial process shows that only the particles on the bed surfaces are migrating along with the bedform. This observation sheds light on the grain-level dynamics in bedform evolution and can provide valuable insights for the numerical modeling.
6 Discussion on the averaged sediment transport quantities
In addition to the characteristics of individual sediment particles, the averaged quantities of sediment particles are detailed to investigate their spatial variation due to bedform generation and migration. In this section, the sediment concentration, the sediment velocity, the particle entrainment and deposition rates, and the bed and suspended loads are investigated. These quantities are averaged both in time and laterally in a moving frame of reference to present the quantities as a function of the vertical direction, , and the relative longitudinal location with respect to the bedform.
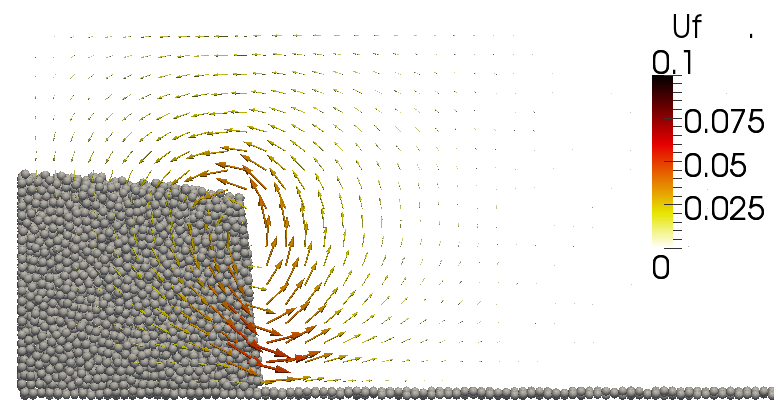
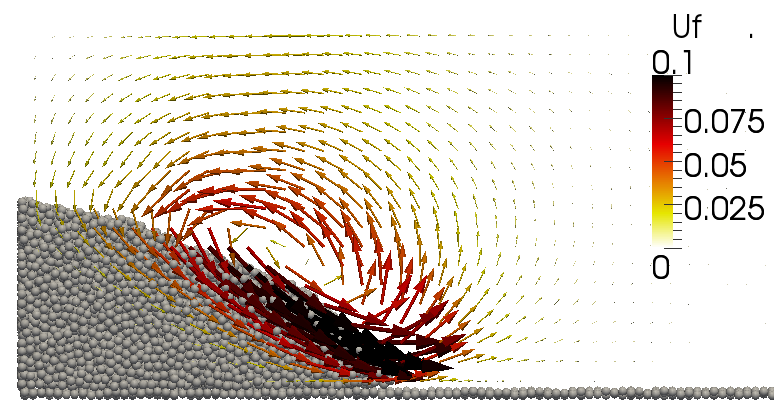
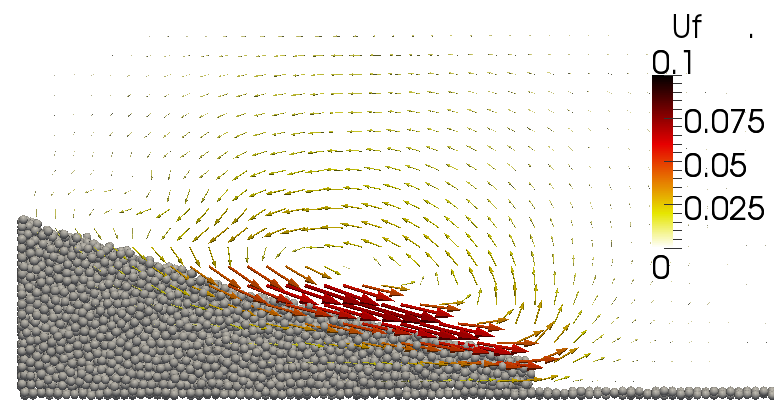
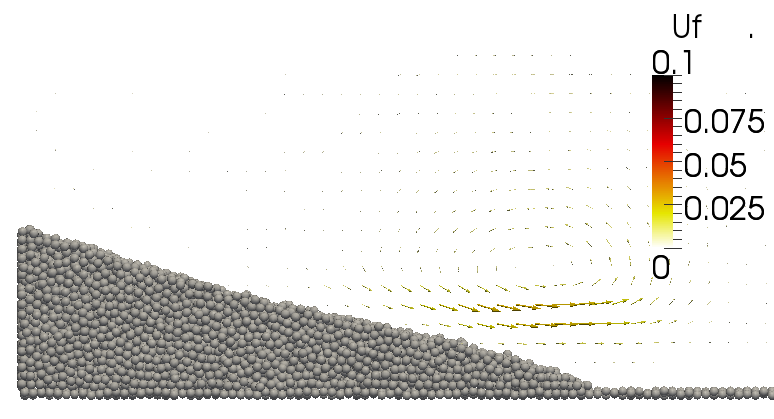
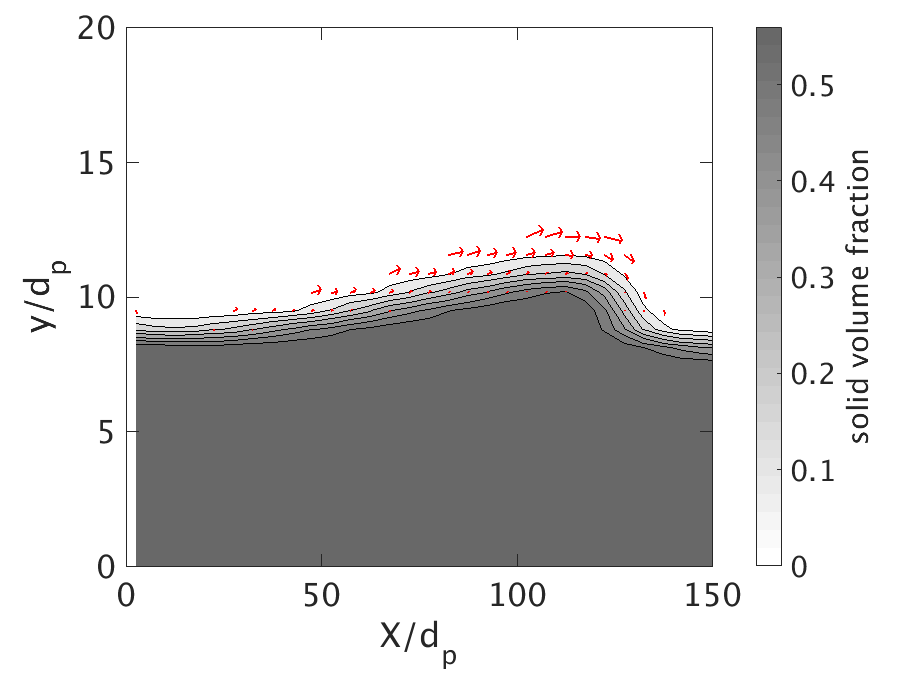
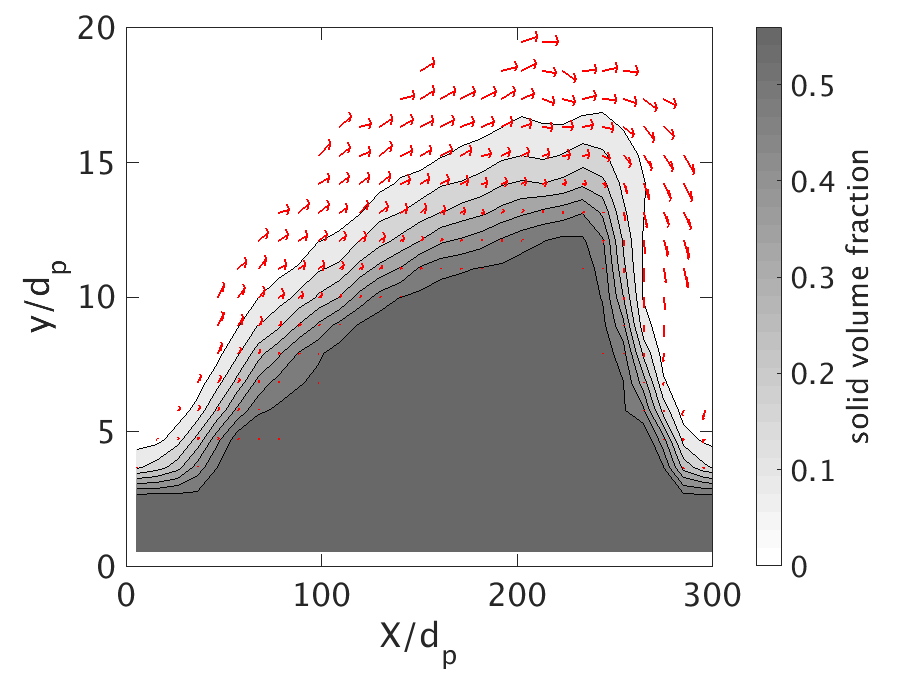
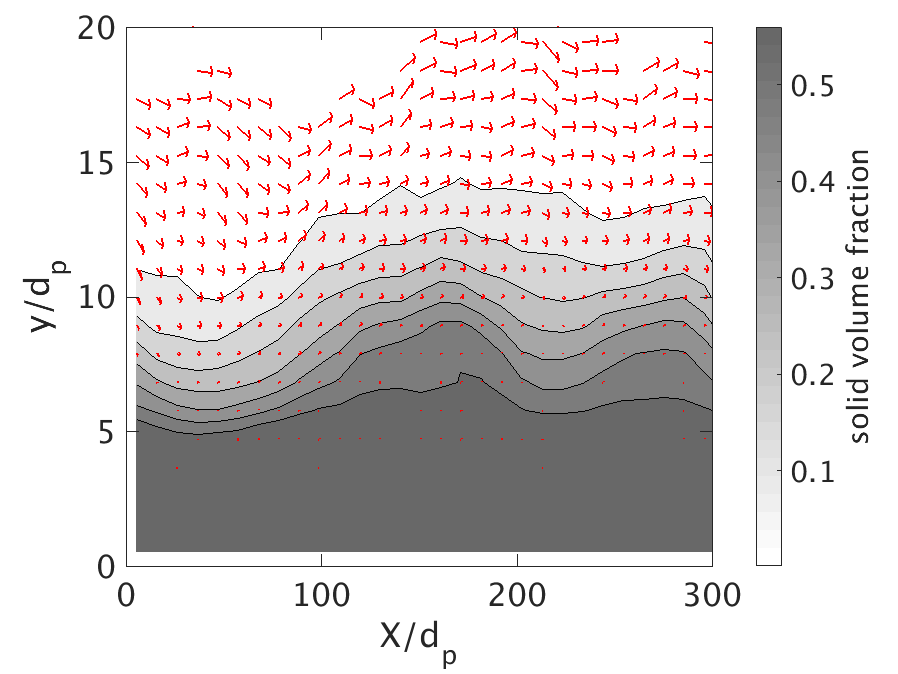
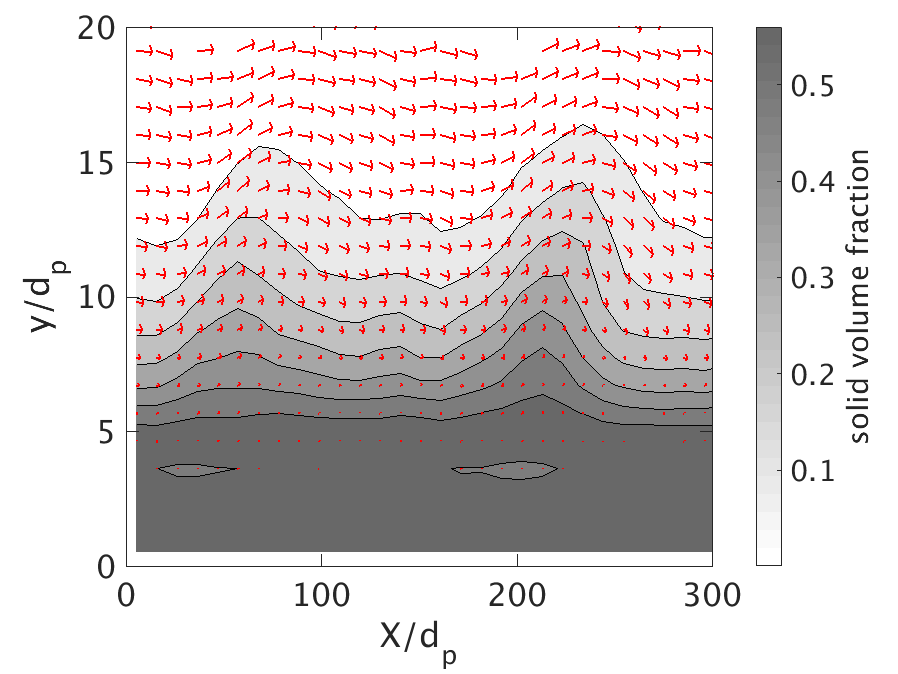
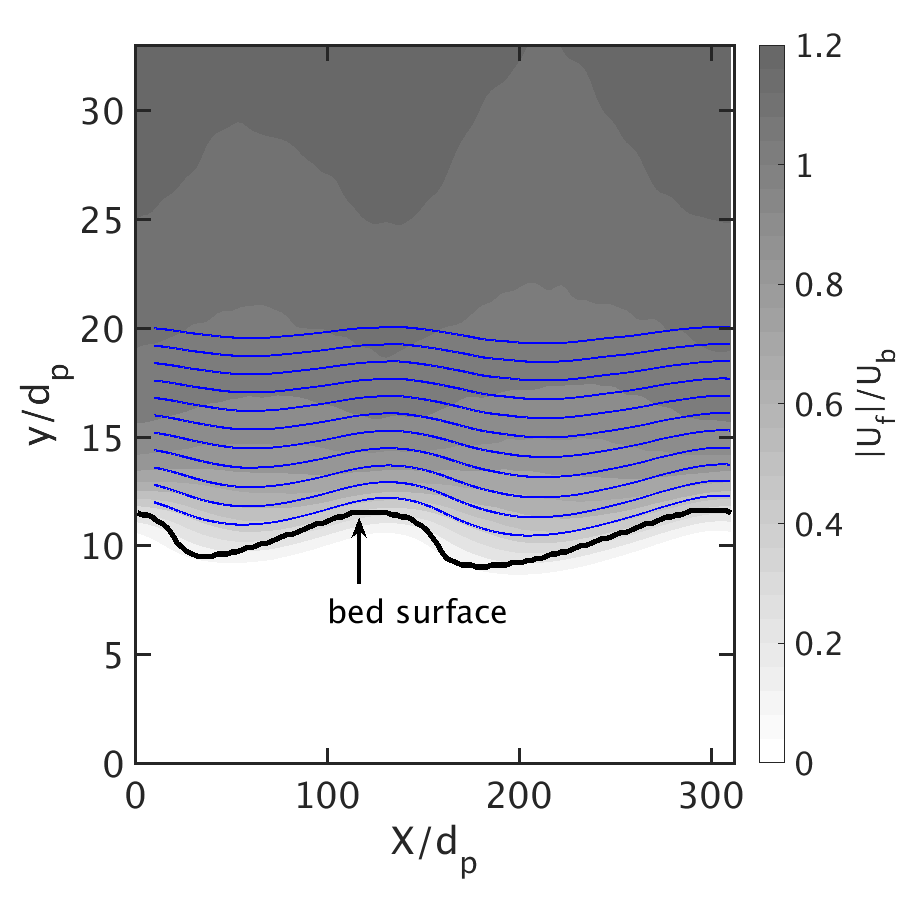
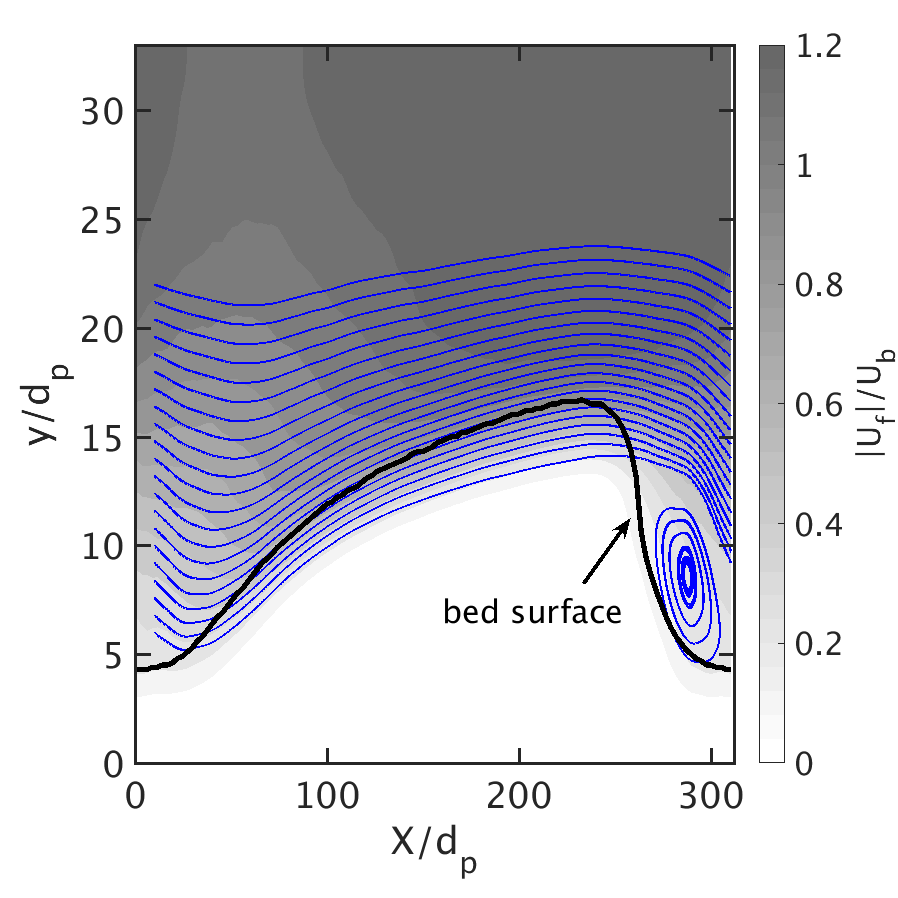
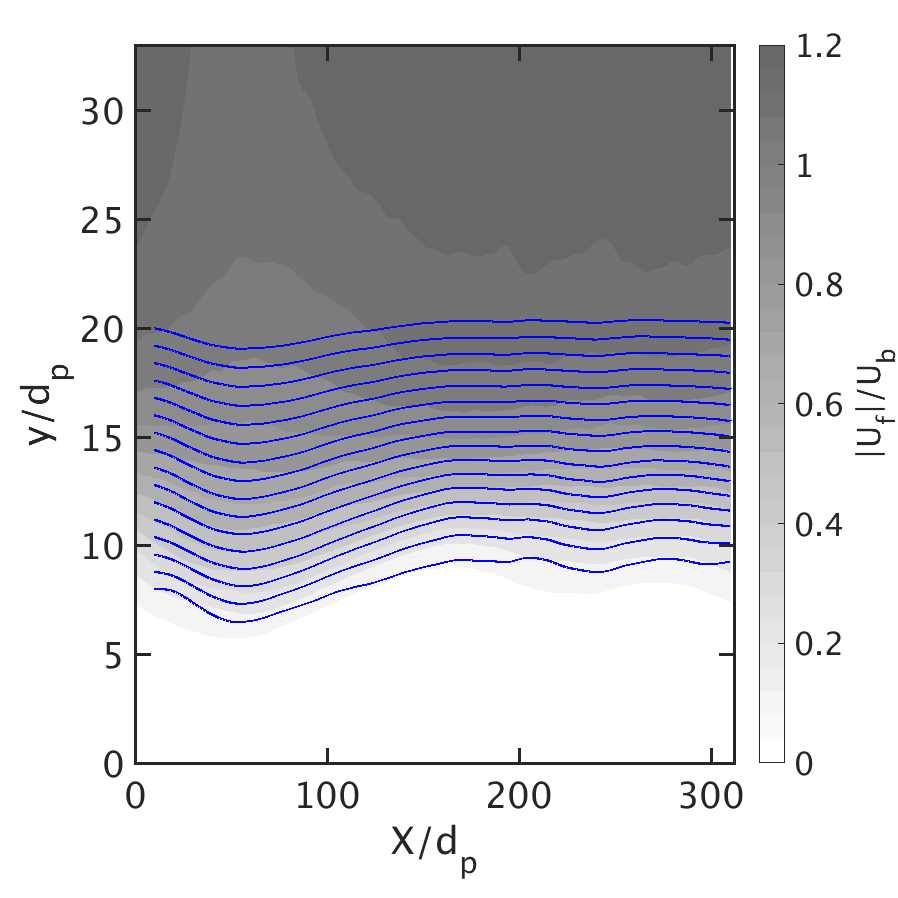
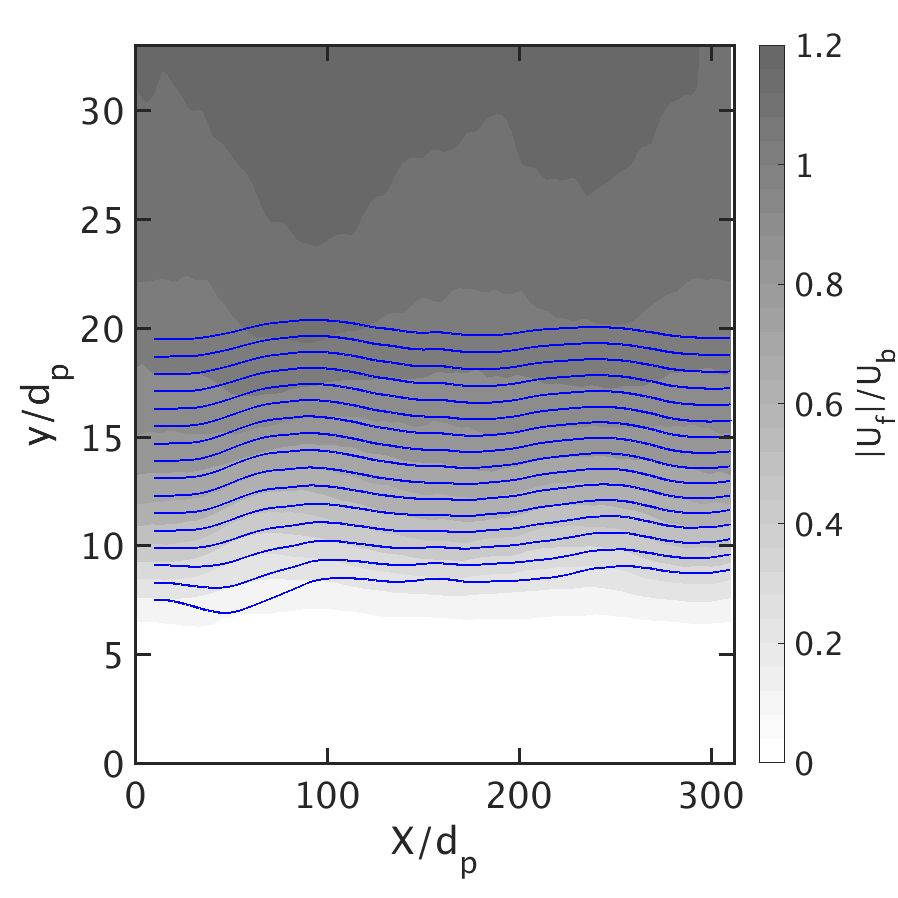
The contours of the moving-averaged sediment concentration and velocity from are shown in Fig. 10. This demonstrates the variation of sediment concentration and velocity at different bulk Reynolds numbers and sediment transport regimes. It can be seen in the concentration contours that the sediment concentration is more diffusive at larger Reynolds numbers. At = 6,000, the bedform migration velocity is stable, and the distance between the concentration isosurfaces of 0.1 and 0.5 is . At = 8,000, although the bedform migration velocity is stable, the saltation height of the sand particle is increased, and thus the distance increases. When the bulk Reynolds number increases to 12,000, the suspended load becomes dominant, and there is a dramatic increase in the momentum exchange between the fluid and sediment particle. Therefore, the distance between the concentration isosurfaces can be as large as . It should be noted that the dune-like features in Figs. 10(c) and 10(d) is because of the generation of unstable bedform. Moreover, the magnitude and direction of particle velocity are plotted using arrows on top of the concentration contour. This aims to demonstrate the averaged motion of sand particles and its correlation to bed surface. It can be seen in both Fig. 10(a) and 10(b) that the particle velocities at the crest of both bedforms are larger than at other locations. It can be also seen that the arrows of the particle velocity under the dune is too small and are not visible in the figure. To help with the explanation of the particle downstream motion, we have also plotted the moving-averaged fluid velocity in Fig. 11. The predictions of flow velocity contour using LES–DEM are qualitatively consistent with the measurement in the experimental study (Naqshband et al., 2014b), although the fluid flow data cannot be compared directly with the experimental data. According to the flow velocity contour, the increase of particle velocity is due to the increase of the fluid velocity at the bedform crest, which is also consistent with the findings in previous experimental measurements (Kostaschuk et al., 2004, 2009). When a larger bedform is generated at , the recirculation of the fluid flow after the crest is captured in the simulations. Note that the streamlines can be seen under the bed surface of 0.1 in Fig. 11(b). This can be explained by the fact that the fluid flow moves with the sediment particles in the bed load layer in the sediment bed.
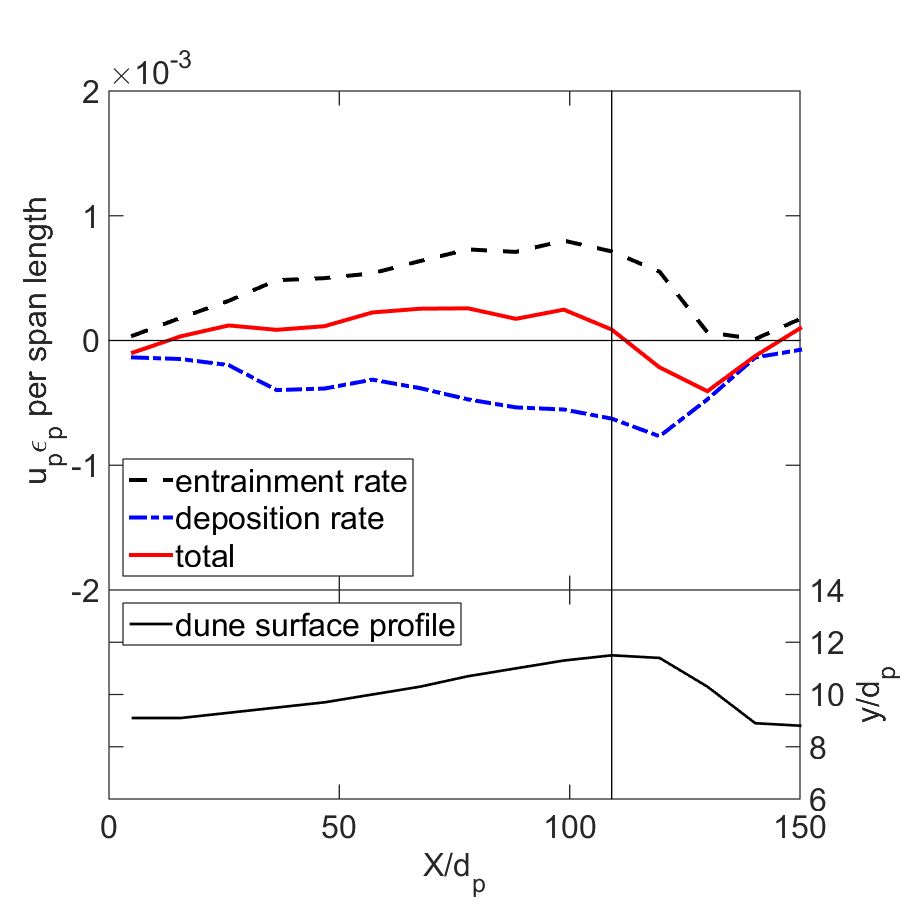
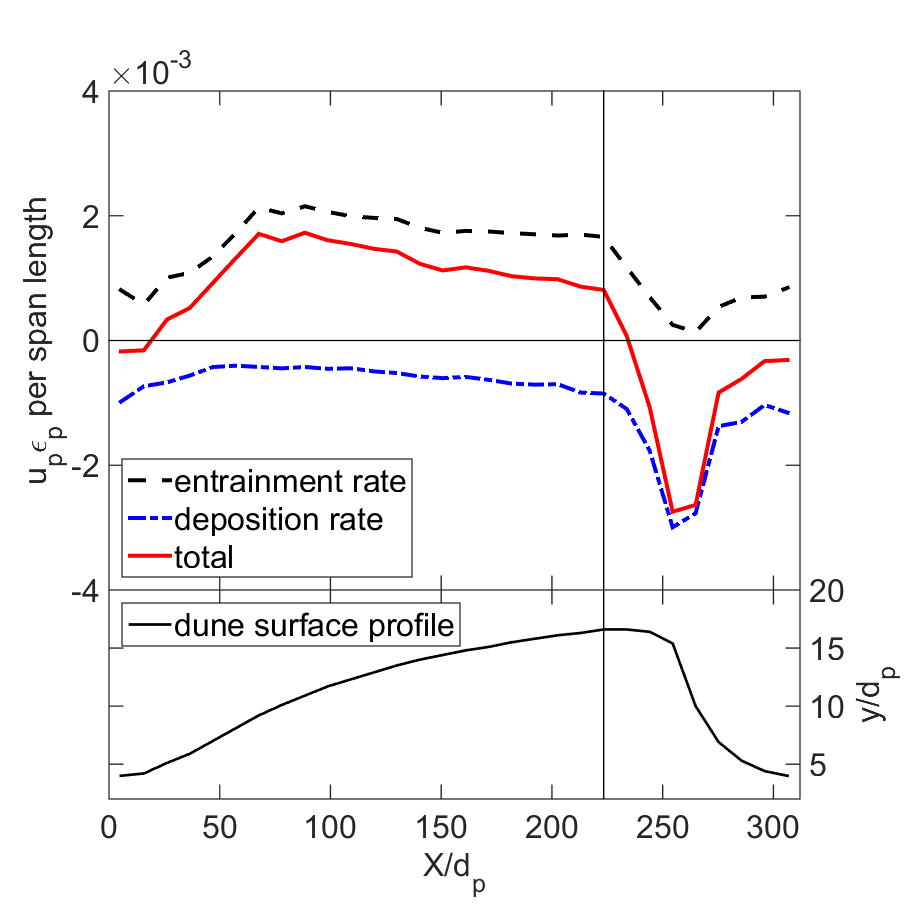
In the vertical direction, the quantities of interest to study sediment transport are the sediment entrainment and deposition, which are difficult to measure directly in experiments. Here we present both entrainment rate and deposition rate , which are a product of average sediment concentration and particle velocity , i.e., they are the volume flux of sand particles per unit area. Since the behavior of individual particles can be traced, the entrainment rate is calculated using particles having positive vertical velocity; whereas the deposition rate is obtained by using particles having negative vertical velocity. By using this definition, the calculated entrainment rate is the sediment flux entrained in the flow; the deposition rate is the sediment flux added to the bed. This is consistent with the definition of sediment entrainment and deposition. The entrainment rate is plotted in Fig. 12. It should be noted that the entrainment rate is not constant along the vertical or streamwise directions. Therefore the sediment entrainment rates shown in the figure are a bed-averaged rate. The markers in the figure are the entrainment rates at , and the error bars denote the range of the entrainment rates between the isosurfaces of sediment concentration to 0.5. Empirical functions for entrainment based on flume data are also shown in the figure (Luque, 1974; van Rijn, 1984b; Emadzadeh and Cheng, 2016). In general, the bed-averaged LES–DEM derived values fall within the range of these empirical formulas and are closest in value to that of van Rijn (1984b).
To demonstrate the variation of the vertical sediment transport, the entrainment rate and deposition rate at the bed surface, , are plotted as a function of the streamwise coordinate in Fig. 13. When the bedform is stable in the moving frame of reference ( = 6,000 and 8,000), the total sediment flux in the vertical direction is above zero on the stoss side of the bedform, and becomes negative on the lee side. That is not to say that only entrainment occurs on the stoss and deposition in the wake, but rather that there is net entrainment over the stoss and net deposition in the wake. Both entrainment and deposition rate increase with Reynolds number.

In general, the total streamwise sediment transport rate, or [-], can be found by integrating the particle velocities and concentrations over the total thickness of the domain and then averaging this over the length of the domain. These values are given in Table 2. However, it is also of interest to decompose this total downstream transport rate into bed, , and suspended, , load fractions. To this end, particles moving above the isosurface of the critical sediment volume fraction are considered as suspended load and those moving below this isosurface are considered as bed load. The critical sediment volume fraction to determine the suspended load is proposed in van Rijn (1984c):
| (11) |
where non-dimensional particle diameters is:
| (12) |
and the transport stage parameter is:
| (13) |
Based on these criteria, the simulations show an increase in the overall suspended load fraction, , from 0.14 in Case 1, up to at Case 4. Values for are given in Table 2. The overall suspended load fraction obtained in the present simulations are consistent with the summary of experimental results in (van Rijn, 1984c). Note that the total domain-averaged transport rates were used in the calculation of .
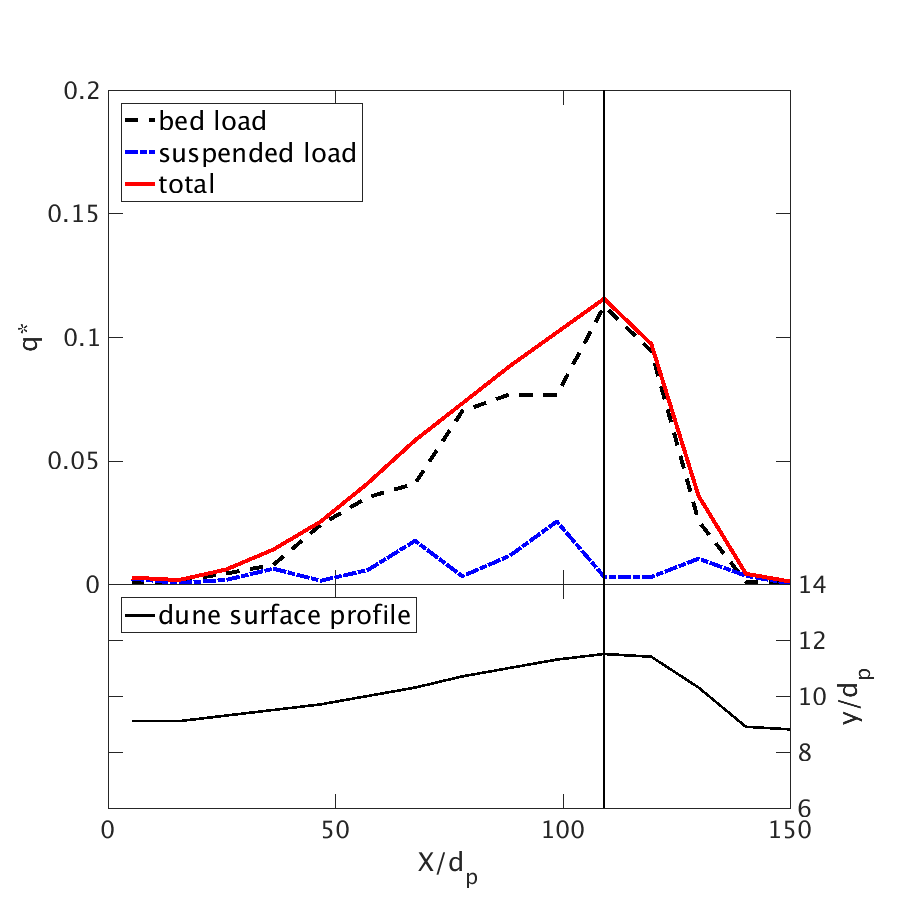
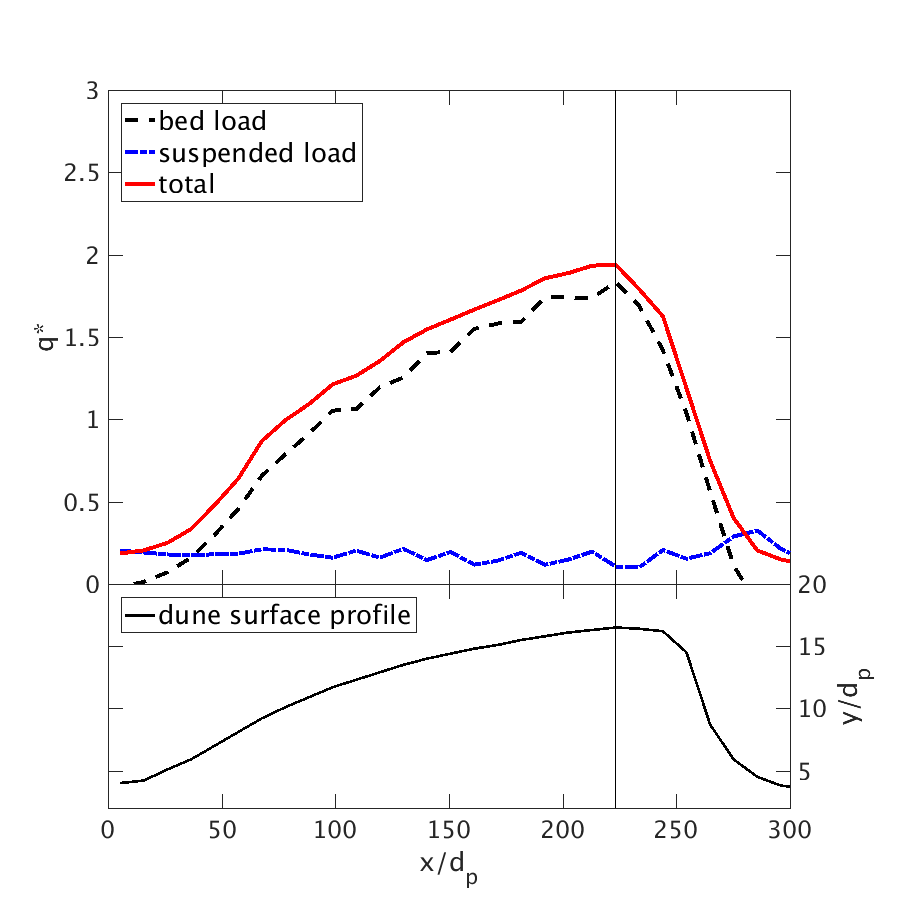
We can also look at the distribution of the non-dimensional total, bed, and suspended loads over the length of a bedform in a moving frame of reference. Such distributions are shown in Fig. 14. The results are obtained by using the moving-averaged data from for Case 1 and 2. The moving-averaged bed profiles is also plotted in Fig. 14 to demonstrate the correlation between of transport rates and the bed profile. The most striking feature of the load distribution is that follows the general bedform shape. Total transport rates increase moving from the preceding trough up and over the stoss of the bedform. Peak transport is reached near the crest of the bedform and then rapidly falls off in the wake. At = 6,000, bed load is by far the dominant contributor to the total transport rate. Additionally, no transport occurs in the trough between sequent bedforms. That is, all sediment being transported in the domain is tied up in the movement of the bedforms. However, at = 8,000, a far greater percentage of the sediment being moved travels in suspension. Interestingly, the bed load transport rate at = 8,000 is fairly constant in the streamwise direction over the length of the stoss. The peaking nature of the total transport rate over the length of the bedform, therefore, comes from the increasing contribution of suspended load over the stoss as the particle velocities increase. As with the = 6,000 case, bed load transport in the trough between sequent bedforms goes to zero. However, the total transport rate remains positive in the trough due to the bypass contributions from suspended load (Fig. 14).
One additional way to estimate bed load transport rates is through use of the bedform height, celerity, and porosity (e.g., Simons et al., 1965; McElroy and Mohrig, 2009). We calculated the bedform transport rate, , as:
| (14) |
where is the average porosity of the bed (taken to be ); note Eq. (14) assumes the beforms are triangular in shape. By using Eq. (10), we compared the calculation of the bedform transport rate with our previous definition in which the particles moving below the isosurface of the critical concentration are bed load at = 6,000 and 8,000. Non-dimensional values of are given in Table 2 for Cases 1 and 2 using values of and also reported in the same table. Eq. (14) did well in estimating the total transport load in Case 1 (= 6,000); compared to . This result is reasonable seeing that the total transport rates go to zero in the troughs for Case 1 (Fig. 14(a)). The value of in Case 2 is larger than that in Case 1, but is smaller than the total load determined from the particle motions, . The reduction in relative to is likely an outcome of the fact that does not go to zero in the trough for the = 8,000 run (Fig. 14(b)). Interestingly, while was smaller than the total load at this condition, was higher than the bed load transport rate, . This implies that some of the material counted as suspended load, in our definition of suspended load, was contributing to the migration of the bedform. The suspended load can be determined from a difference between the total load and bedform transport rate, and the difference , yields a suspended load fraction at = 8,000 of . This is consistent with the of value determined using our definition of suspended load as particles moving above the isosurface of .
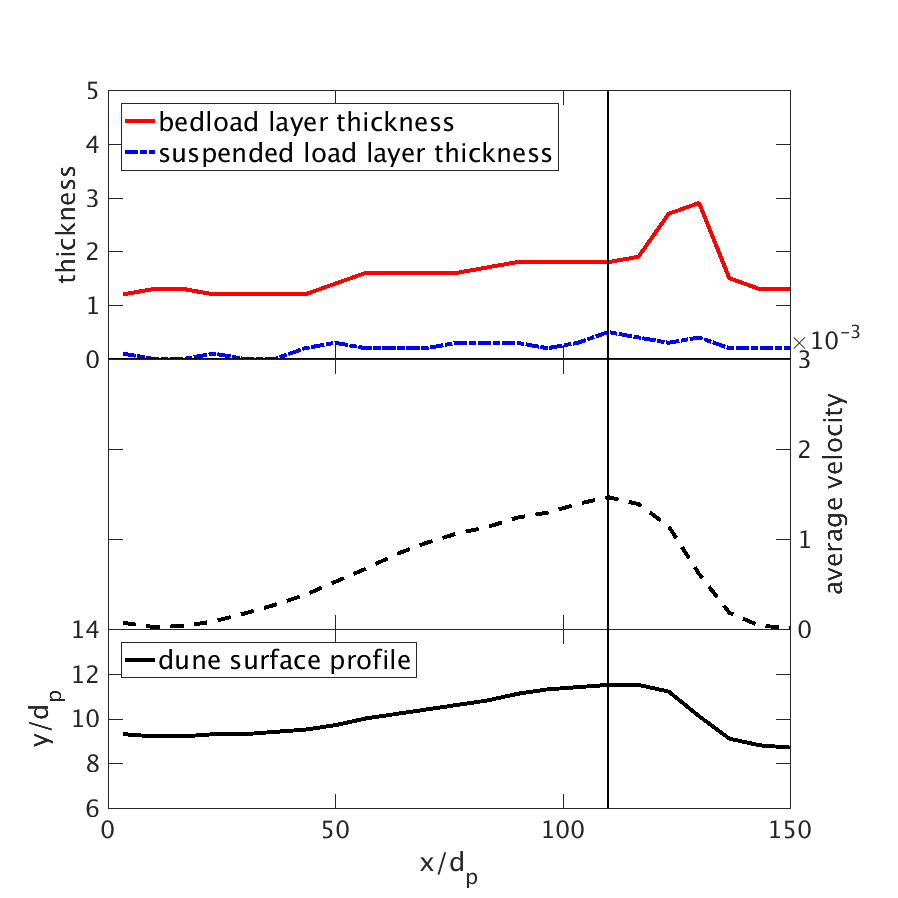
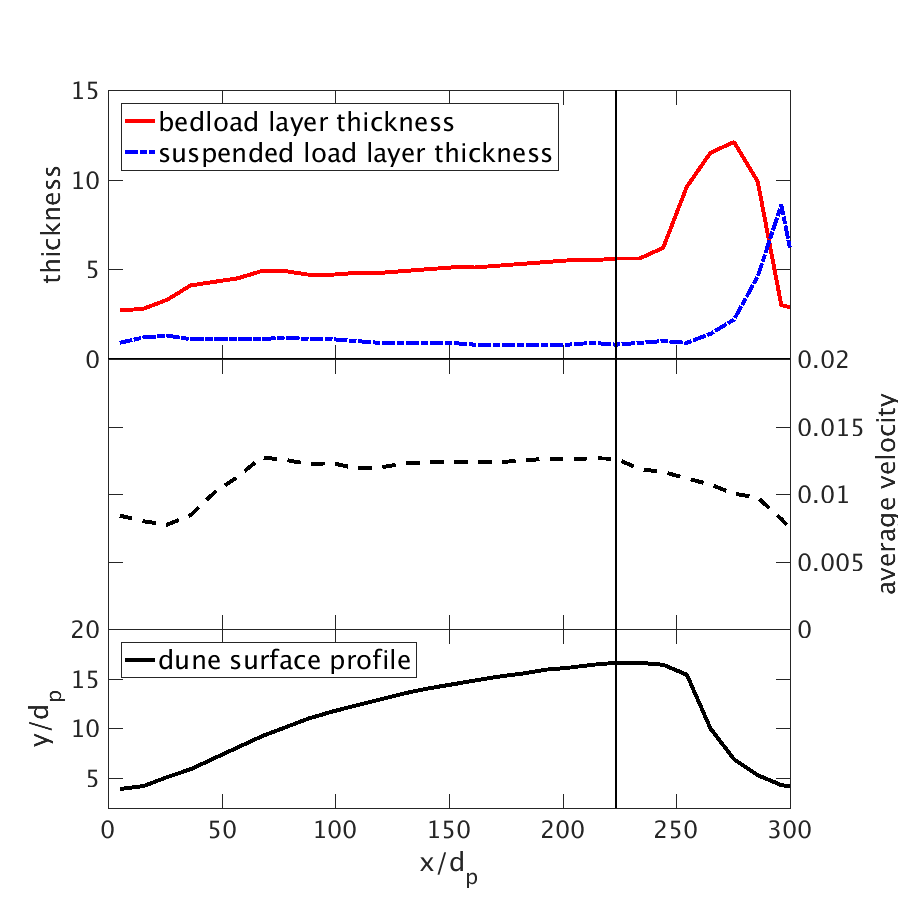
The thickness of both the bed and suspended load layers are shown as a function of the streamwise coordinate in Fig. 15. The height of the bed load layer is defined as the distance of the isosurfaces of sediment concentrations between the critical value and 0.5, and the height of suspended load layer is the distance of the concentration isosurfaces between 0.01 and the critical value . The definition to determine the bed load layer thickness is consistent with our previous definition in the calculation of bed load flux. The bed surface profiles are also plotted to help illustrate the location of peaks of the thickness. It can be seen in Fig. 15 that the maximum heights of both bed and suspended load layers are not at the peak of the bedform but on the lee side of the bedform. The increase of the bed load layer thickness is because the slope of the bedform on the lee side is significantly larger than the stoss side, and the thickness in the vertical direction increases due to the increase of the slope; whereas the increase of suspended load layer thickness at = 8,000 is due to particle suspension in the recirculation region after peak of bedform. It can be also seen in the figure that both the thickness of the bed load layer and suspended load layer is increasing when the bulk Reynolds number increases. The moving-frame averaged particle velocity is also plotted as a function of streamwise coordinate in Fig. 15. It can be seen in the figure that the trend of average particle velocity is consistent with the bed profiles, which is consistent with the trend of sediment transport rate in Fig. 14.
7 Conclusion
In this study, we have investigated the individual particle motions associated with self-generated bedforms at different bulk Reynolds numbers, or transport stages, using SediFoam. The simulations presented cover a range of transport conditions from bedform inception at transport stage of to washout conditions (at approximately and ). Calculation of the individual particle statistics showed that washout starts to occur when the jump length of the individual particle starts to exceed the wavelength of the bedforms and computational domain. This also coincided with a transition from bed load dominated transport to suspended load dominated transport. The current LES–DEM model can complement the experimental results by providing much detailed information of the system, e.g., individual particle trajectories, statistics of particle migration behaviour, detailed flow field, and fluid–particle interactions, among others. With the LES–DEM simulation results and the insights generated therein, the closure terms in the two-fluid models or hydro-morphodynamic models can be improved, which can contribute to the numerical modeling in the sediment transport problems in engineering scales.
When bedforms were present, both bed and suspended load increased over the stoss side of the bedforms; reaching a peak in the individual particle and total transport just at or before the crest of the bedforms. For the lower transport conditions ( and ), material moved almost exclusively in bed load, and nearly 100% of the material transported from and over the stoss was trapped in the lee-side wake. No material bypassed the bedform. At this condition, the total sediment transport rate was well approximated by the bedform transport rate calculated using the bedform height, celerity, and bed porosity (Eq. (14)). As contributions from suspended load increased ( and ), a fraction of the sediment was found to bypass the trough of the bedform. This resulted in a positive sediment transport rate through the trough. One result of this was that the transport rate predicted from the bedform properties underestimated the total transport rate. In this case, the difference between the total load and sediment transport rate associated with bedform migration was not equal to the suspended load transport rate. In our definition of suspended load, material can be picked up in suspension and deposited back down onto the sediment bed in a way that contributes to the overall size and migration speed of the bedform. Hence, calculating the transport rate from the bedform properties included contributions from both bed and suspended load.
In this study we do not examine the fluid mechanics of the system or the links between coherent flow and the sediment motion. Instead, we have highlighted the ability of LES–DEM methods to obtain the detailed particle motion data that cannot, at least as of yet, be obtained through field or laboratory studies of sand beds. The type and amount of data that can be generated with such methods is rather staggering, and the presence of mobile bedforms presents added challenges with regard to presenting the detailed data in a meaningful way. In this paper, we have chosen to present data on individual particle jump lengths, particle entrainment into suspension, and the fractionation between bed and suspended load within a moving frame of reference that is tied to the celerity of the bedforms. We demonstrate that the LES–DEM method can be used to both investigate individual particle dynamics and extract key sediment transport quantities needed to bolster modeling of mobile beds in coarser resolution simulations. For example, use of the LES–DEM method allowed for the evaluation of the particle pickup rates over the heterogeneous stress field of the mobile bed surfaces. Depending on how the bed load and suspended load layers are conceptualized as existing, one could use this type of information to further develop models of suspended load entrainment under a range of condition.
While methods such as SediFoam are opening up new doors for the exploration of detailed particle dynamics in sediment transport research, such simulations are still limited by computational resources. For example, we were not able to generate stable bedforms at (or ). At this point it is difficult to say whether the bedforms were washed out because the mode of transport switched unequivocally to suspended load or because the domain became smaller than the jump length of the particles. For example, at 10,000 and 12,000, correlated waves of suspended load could be observed moving through the domain (Figs. 10(c) and 10(d)). Perhaps such waves would lead to longer wavelength bedforms given enough space. However, doubling the size of the domain would further increase the number of particles and the mesh size required to resolve the flow field, leading to increased computational costs. Another avenue left to push towards in the application of LES–DEM methods for sand bed research is the incorporation of deeper flows, the presence of a free surface, and the use of a grain size distribution within the bed. The form lift for realistic particles is also important and contributes to the uncertaities of the results. As such advances come to fruition, it is possible to conceive of parametric numerical simulations being run to better refine our understanding of the particle physics involved in the movement of sand through rivers.
Acknowledgments
The computational resources used for this project are provided by the Advanced Research Computing (ARC) of Virginia Tech, which is gratefully acknowledged. RS gratefully acknowledges partial funding of graduate research assistantship from the Institute for Critical Technology and Applied Science (ICTAS, grant number 175258) in this effort. We thank the anonymous reviewers for their comments, which significantly improve the quality of the paper. To access data used in this paper, please contact the corresponding author.
Reference
References
- Ancey (2010) Ancey, C., 2010. Stochastic modeling in sediment dynamics: Exner equation for planar bed incipient bed load transport conditions. Journal of Geophysical Research 115, F00A11.
- Anderson (1953) Anderson, A., 1953. The characteristics of sediment waves formed by flow in open channels. In: Proc. Third Mid- Western Conf. on Fluid Mech. University of Minnesota, pp. 379–395.
- Anderson and Jackson (1967) Anderson, T., Jackson, R., 1967. A fluid mechanical description of fluidized beds: Equations of motion. Industrial and Chemistry Engineering Fundamentals 6, 527–534.
- Arolla and Desjardins (2015) Arolla, S. K., Desjardins, O., 2015. Transport modeling of sedimenting particles in a turbulent pipe flow using Euler–Lagrange large eddy simulation. International Journal of Multiphase Flow 75, 1 – 11.
- Aussillous et al. (2013) Aussillous, P., Chauchat, J., Pailha, M., Médale, M., Guazzelli, É., 2013. Investigation of the mobile granular layer in bedload transport by laminar shearing flows. Journal of Fluid Mechanics 736, 594–615.
- Baas (1994) Baas, J. H., 1994. A flume study on the development and equilibrium morphology of current ripples in very fine sand. Sedimentology 41 (2), 185–209.
- Bagnold (1966) Bagnold, R. A., 1966. An approach to sediment transport from general physics. United States Geological Survey Professional Paper 422-I.
- Bennett et al. (1998) Bennett, S. J., Bridge, J. S., Best, J. L., 1998. Fluid and sediment dynamics of upper stage plane beds. Journal of Geophysical Research: Oceans 103 (C1), 1239–1274.
- Best (2005) Best, J., 2005. The fluid dynamics of river dunes: A review and some future research directions. Journal of Geophysical Research: Earth Surface (2003–2012) 110, F04S02.
- Bridge and Best (1988) Bridge, J. S., Best, J. L., 1988. Flow, sediment transport and bedform dynamics over the transition from dunes to upper-stage plane beds: implications for the formation of planar laminae. Sedimentology 35 (5), 753–763.
- Campagnol et al. (2015) Campagnol, J., Radice, A., Ballio, F., Nikora, V., 2015. Particle motion and diffusion at weak bed load: accounting for unsteadiness effects of entrainment and disentrainment. Journal of Hydraulic Research 53 (5), 633–648.
- Charru et al. (2013) Charru, F., Andreotti, B., Claudin, P., 2013. Sand ripples and dunes. Annual Review of Fluid Mechanics 45 (1), 469–493.
- Chu et al. (2009) Chu, K. W., Wang, B., Yu, A. B., Vince, A., 2009. CFD–DEM modelling of multiphase flow in dense medium cyclones. Powder Technology 193 (3), 235–247.
- Cundall and Strack (1979) Cundall, P., Strack, D., 1979. A discrete numerical model for granular assemblies. Géotechnique 29, 47–65.
- De Villiers (2007) De Villiers, E., 2007. The potential of large eddy simulation for the modelling of wall bounded flows. Ph.D. thesis, University of London.
- Ebrahimi (2014) Ebrahimi, M., 2014. CFD–DEM modelling of two-phase pneumatic conveying with experimental validation. Ph.D. thesis.
- Emadzadeh and Cheng (2016) Emadzadeh, A., Cheng, N.-S., 2016. Measurements of sediment pickup rate over dune-covered bed. Environmental Fluid Mechanics 16 (1), 123–144.
- Escauriaza and Sotiropoulos (2011) Escauriaza, C., Sotiropoulos, F., 2011. Lagrangian model of bed-load transport in turbulent junction flows. Journal of Fluid Mechanics 666, 36–76.
- Fathel et al. (2015) Fathel, S. L., Furbish, D. J., Schmeeckle, M. W., 2015. Experimental evidence of statistical ensemble behavior in bed load sediment transport. Journal of Geophysical Research: Earth Surface 120 (11), 2298–2317.
- Fukuoka et al. (2014) Fukuoka, S., Fukuda, T., Uchida, T., 2014. Effects of sizes and shapes of gravel particles on sediment transports and bed variations in a numerical movable-bed channel. Advances in Water Resources 72, 84 – 96.
- Furbish et al. (2012) Furbish, D. J., Haff, P. K., Roseberry, J. C., Schmeeckle, M. W., 2012. A probabilistic description of the bed load sediment flux: 1. Theory. Journal of Geophysical Research: Earth Surface 117 (F3).
- Furbish et al. (2016) Furbish, D. J., Schmeeckle, M. W., Schumer, R., Fathel, S. L., 2016. Probability distributions of bed-load particle velocities, accelerations, hop distances and travel times informed by Jaynes’s principle of maximum entropy. Journal of Geophysical Research: Earth Surface 121 (7), 1373–1390.
- Fureby et al. (1997) Fureby, C., Gosman, A. D., Tabor, G., Weller, H. G., Sandham, N., Wolfshtein, M., 1997. Large eddy simulation of turbulent channel flows. Turbulent shear flows 11, 28–13.
- Garcia and Parker (1991) Garcia, M., Parker, G., 1991. Entrainment of bed sediment into suspension. Journal of Hydraulic Engineering 117 (4), 414–435.
- García (2008) García, M. H., 2008. Sediment Transport and Morphodynamics. Sedimentation Engineering. ASCE Manuals and Reports on Engineering Practice No. 110. ASCE, Ch. 2 Sediment Transport and Morphodynamics, pp. 21–163.
- García et al. (2000) García, M. H., Laursen, E. M., Michel, C., Buffington, J. M., 2000. The legend of A. F. Shields. Journal of Hydraulic Engineering 126 (9), 718–723.
- Garside and Al-Dibouni (1977) Garside, J., Al-Dibouni, M. R., 1977. Velocity-voidage relationships for fluidization and sedimentation in solid-liquid systems. Industrial & engineering chemistry process design and development 16 (2), 206–214.
- Gilbert (1914) Gilbert, G. K., 1914. The transportation of debris by running water. Professional Papers 86, U.S. Geological Survey.
- Giri and Shimizu (2006) Giri, S., Shimizu, Y., 2006. Numerical computation of sand dune migration with free surface flow. Water Resources Research 42 (10).
- Goniva et al. (2012) Goniva, C., Kloss, C., Deen, N. G., Kuipers, J. A. M., Pirker, S., 2012. Influence of rolling friction on single spout fluidized bed simulation. Particuology 10 (5), 582–591.
- Goniva et al. (2009) Goniva, C., Kloss, C., Pirker, S., 12-13 November 2009. Towards fast parallel CFD–DEM: an open-source perspective. In: Proc. of Open Source CFD International Conference.
- Gupta (2015) Gupta, P., 2015. Verification and validation of a DEM–CFD model and multiscale modelling of cohesive fluidization regimes.
- Gupta et al. (2016) Gupta, P., Sun, J., Ooi, J. Y., 2016. DEM–CFD simulation of a dense fluidized bed: Wall boundary and particle size effects. Powder Technology 293, 37–47.
- Guy et al. (1966) Guy, H. P., Simons, D. B., Richardson, E. V., 1966. Summary of alluvial channel data from flume experiments, 1956-61. USGS Professional Paper 462-I.
- Han et al. (2003) Han, T., Levy, A., Kalman, H., 2003. DEM simulation for attrition of salt during dilute-phase pneumatic conveying. Powder Technology 129 (1), 92–100.
- Issa (1986) Issa, R. I., 1986. Solution of the implicitly discretised fluid flow equations by operator-splitting. Journal of Computational Physics 62 (1), 40–65.
- Jasak (1996) Jasak, H., 1996. Error analysis and estimation for the finite volume method with applications to fluid flows. Ph.D. thesis, Imperial College London (University of London).
- Kafui et al. (2002) Kafui, K., Thornton, C., Adams, M., 2002. Discrete particle–continuum fluid modelling of gas–solid fluidised beds. Chemical Engineering Science 57 (13).
- Kempe and Fröhlich (2012) Kempe, T., Fröhlich, J., 2012. Collision modelling for the interface-resolved simulation of spherical particles in viscous fluids. Journal of Fluid Mechanics 709, 445–489.
- Kempe et al. (2014) Kempe, T., Vowinckel, B., Fröhlich, J., 2014. On the relevance of collision modeling for interface-resolving simulations of sediment transport in open channel flow. International Journal of Multiphase Flow 58, 214 – 235.
- Kennedy (1963) Kennedy, J., 1963. The mechanics of dunes and antidunes in erodible-bed channels. Journal of Fluid Mechanics 16 (4), 521–544.
- Khosronejad and Sotiropoulos (2014) Khosronejad, A., Sotiropoulos, F., 2014. Numerical simulation of sand waves in a turbulent open channel flow. Journal of Fluid Mechanics 753, 150–216.
- Kidanemariam and Uhlmann (2014a) Kidanemariam, A. G., Uhlmann, M., 2014a. Direct numerical simulation of pattern formation in subaqueous sediment. Journal of Fluid Mechanics 750 (R2), 1–13.
- Kidanemariam and Uhlmann (2014b) Kidanemariam, A. G., Uhlmann, M., 2014b. Interface-resolved direct numerical simulation of the erosion of a sediment bed sheared by laminar channel flow. International Journal of Multiphase Flow 67, 174–188.
- Kidanemariam and Uhlmann (2017) Kidanemariam, A. G., Uhlmann, M., 2017. Formation of sediment patterns in channel flow: minimal unstable systems and their temporal evolution. Accepted for publication in Journal of Fluid Mechanics. Available at http://arxiv.org/abs/1702.06648.
- Kloss et al. (2012) Kloss, C., Goniva, C., Hager, A., Amberger, S., Pirker, S., 2012. Models, algorithms and validation for opensource DEM and CFD–DEM. Progress in Computational Fluid Dynamics, an International Journal 12 (2), 140–152.
- Kostaschuk et al. (2009) Kostaschuk, R., Shugar, D., Best, J., Parsons, D., Lane, S., Hardy, R., Orfeo, O., 2009. Suspended sediment transport and deposition over a dune: Río paraná, argentina. Earth Surface Processes and Landforms 34 (12), 1605–1611.
- Kostaschuk et al. (2004) Kostaschuk, R., Villard, P., Best, J., 2004. Measuring velocity and shear stress over dunes with acoustic doppler profiler. Journal of hydraulic engineering 130 (9), 932–936.
- Kuipers and van Swaaij (1997) Kuipers, J. A. M., van Swaaij, W. P. M., 1997. Application of computational fluid dynamics to chemical reaction engineering. Reviews in Chemical Engineering 13 (3), 1.
- Lajeunesse et al. (2010) Lajeunesse, E., Malverti, L., Charru, F., 2010. Bed load transport in turbulent flow at the grain scale: Experiments and modeling. Journal of Geophysical Research 115 (F4), F04001.
- Luque (1974) Luque, R. F., 1974. Erosion and transport of bed-load sediment. Ph.D. thesis, TU Delft, Delft University of Technology.
- McElroy and Mohrig (2009) McElroy, B., Mohrig, D., 2009. Nature of deformation of sandy bed forms. Journal of Geophysical Research: Earth Surface 114 (F3).
- Mohrig and Smith (1996) Mohrig, D., Smith, J. D., 1996. Predicting the migration rates of subaqueous dunes. Water Resources Research 32 (10), 3207–3217.
- Nabi et al. (2013a) Nabi, M., Vriend, H., Mosselman, E., Sloff, C., Shimizu, Y., 2013a. Detailed simulation of morphodynamics: 2. sediment pickup, transport, and deposition. Water resources research 49 (8), 4775–4791.
- Nabi et al. (2013b) Nabi, M., Vriend, H., Mosselman, E., Sloff, C., Shimizu, Y., 2013b. Detailed simulation of morphodynamics: 3. ripples and dunes. Water resources research 49 (9), 5930–5943.
- Naqshband et al. (2015) Naqshband, S., Duin, O., Ribberink, J., Hulscher, S., 2015. Modeling river dune development and dune transition to upper stage plane bed. Earth surface processes and landforms.
- Naqshband et al. (2014a) Naqshband, S., Ribberink, J. S., Hulscher, S. J. M. H., 2014a. Using both free surface effect and sediment transport mode parameters in defining the morphology of river dunes and their evolution to upper stage plane beds. Journal of Hydraulic Engineering 140 (6), 06014010.
- Naqshband et al. (2014b) Naqshband, S., Ribberink, J. S., Hurther, D., Hulscher, S. J. M. H., 2014b. Bed load and suspended load contributions to migrating sand dunes in equilibrium. Journal of Geophysical Research: Earth Surface 119 (5), 1043–1063.
-
OpenCFD (2013)
OpenCFD, 2013. OpenFOAM User Guide. See also
http://www.opencfd.co.uk/openfoam. - Ouriemi et al. (2009) Ouriemi, M., Aussillous, P., Guazzelli, E., 2009. Sediment dynamics. Part 2. Dune formation in pipe flow. Journal of Fluid Mechanics 636, 321–336.
- Paarlberg et al. (2006) Paarlberg, A., Dohmen-Janssen, C., Hulscher, S., Van den Berg, J., Termes, A., 2006. Modelling morphodynamic evolution of river dunes. In: Proceedings of the International Conference on Fluvial Hydraulics, 6–8 September 2006, Lisbon, Portugal. pp. 969–978.
- Parker et al. (2000) Parker, G., Paola, C., Leclair, S., 2000. Probabilistic Exner sediment continuity equation for mixtures with no active layer. Journal of Hydraulic Engineering 126 (11), 818–826.
- Plimpton (1995) Plimpton, J., 1995. Fast parallel algorithms for short-range molecular dynamics. J. Comp. Phys. 117, 1–19.
- Roseberry et al. (2012) Roseberry, J. C., Schmeeckle, M. W., Furbish, D. J., 2012. A probabilistic description of the bed load sediment flux: 2. particle activity and motions. Journal of Geophysical Research: Earth Surface 117, F03032.
- Saffman (1965) Saffman, P., 1965. The lift on a small sphere in a slow shear flow. Journal of fluid mechanics 22 (02), 385–400.
- Schmeeckle (2014) Schmeeckle, M. W., 2014. Numerical simulation of turbulence and sediment transport of medium sand. Journal of Geophysical Research: Earth Surface 119, 1240–1262.
- Shimizu et al. (2009) Shimizu, Y., Giri, S., Yamaguchi, S., Nelson, J., 2009. Numerical simulation of dune–flat bed transition and stage-discharge relationship with hysteresis effect. Water Resources Research 45 (4).
- Simons et al. (1965) Simons, D. B., Richardson, E. V., Nordin Jr., C. F., 1965. Bedload equation for ripples and dunes. Tech. Rep. 462-H, 1-9, U.S. Geological Survey Professional Papers.
- Smith and McLean (1977) Smith, J. D., McLean, S. R., 1977. Spatially averaged flow over a wavy surface. Journal of Geophysical Research 82 (12), 1735–1746.
- Southard and Boguchwal (1990) Southard, J. B., Boguchwal, L. A., 1990. Bed configurations in steady unidirectional water flows. Part 2. Synthesis of flume data. Journal of Sedimentary Research 60 (5).
- Sun et al. (2007) Sun, J., Battaglia, F., Subramaniam, S., 2007. Hybrid two-fluid DEM simulation of gas-solid fluidized beds. Journal of Fluids Engineering 129 (11), 1394–1403.
- Sun and Xiao (2015a) Sun, R., Xiao, H., 2015a. Diffusion-based coarse graining in hybrid continuum–discrete solvers: Applications in CFD–DEM. International Journal of Multiphase Flow 72, 233–247.
- Sun and Xiao (2015b) Sun, R., Xiao, H., 2015b. Diffusion-based coarse graining in hybrid continuum–discrete solvers: Theoretical formulation and a priori tests. International Journal of Multiphase Flow 77, 142 – 157.
- Sun and Xiao (2016a) Sun, R., Xiao, H., 2016a. CFD–DEM simulations of current-induced dune formation and morphological evolution. Advances in Water Resources 92, 228–239.
- Sun and Xiao (2016b) Sun, R., Xiao, H., 2016b. Realistic representation of grain shapes in CFD–DEM simulations of sediment transport: A bonded-sphere approach. Submitted, available at http://arxiv.org/abs/1608.01049.
- Sun and Xiao (2016c) Sun, R., Xiao, H., 2016c. SediFoam: A general-purpose, open-source CFD–DEM solver for particle-laden flow with emphasis on sediment transport. Computers & Geosciences 89, 207 – 219.
- Sun and Xiao (2016d) Sun, R., Xiao, H., 2016d. Sediment micromechanics in sheet flows induced by asymmetric waves: A CFD–DEM study. Computers & Geosciences 96, 35–46.
- Syamlal et al. (1993) Syamlal, M., Rogers, W., O’Brien, T., 1993. MFIX documentation: Theory guide. Tech. rep., National Energy Technology Laboratory, Department of Energy.
- Tsuji et al. (1993) Tsuji, Y., Kawaguchi, T., Tanaka, T., 1993. Discrete particle simulation of two-dimensional fluidized bed. Powder Technolgy 77 (79-87).
- van Rijn (1984a) van Rijn, L., 1984a. Sediment transport, part I: Bed load transport. Journal of hydraulic engineering 110 (10), 1431–1456.
- van Rijn (1984b) van Rijn, L. C., 1984b. Sediment pick-up functions. Journal of Hydraulic Engineering 110 (10), 1494–1502.
- van Rijn (1984c) van Rijn, L. C., 1984c. Sediment transport, part II: Suspended load transport. Journal of Hydraulic Engineering 110 (11).
- van Rijn (1984d) van Rijn, L. C., 1984d. Sediment transport, part III: Bed forms and alluvial roughness. Journal of Hydraulic Engineering 110 (12), 1733–1754.
- Venditti et al. (2016) Venditti, J. G., Lin, C. M., Kazemi, M., 2016. Variability in bedform morphology and kinematics with transport stage. Sedimentology 63 (4), 1017–1040.
- Vowinckel et al. (2014) Vowinckel, B., Kempe, T., Fröhlich, J., 2014. Fluid–particle interaction in turbulent open channel flow with fully-resolved mobile beds. Advances in Water Resources 72, 32 – 44.
- Yoshizawa and Horiuti (1985) Yoshizawa, A., Horiuti, K., 1985. A statistically-derived subgrid-scale kinetic energy model for the large-eddy simulation of turbulent flows. Journal of the Physical Society of Japan 54 (8), 2834–2839.
- Zhao and Shan (2013) Zhao, J., Shan, T., 2013. Coupled CFD–DEM simulation of fluid–particle interaction in geomechanics. Powder technology 239, 248–258.
- Zhao (2014) Zhao, T., 2014. Investigation of landslide-induced debris flows by the DEM and CFD. Ph.D. thesis, University of Oxford.
- Zhu et al. (2007) Zhu, H., Zhou, Z., Yang, R., Yu, A., 2007. Discrete particle simulation of particulate systems: theoretical developments. Chemical Engineering Science 62 (13), 3378–3396.
Appendix: Grain Avalanching Test
If the angle of the lee side of the bedform is larger than the angle of repose, the sediment particles are falling along the lee side to the bottom. In the present simulations, the motions of individual sediment particles are captured, and there is no ad-hoc modeling of the grain avalanching. In this section, the grain avalanching test is performed to validate that SediFoam can capture the repose angle of the sediment particles.
The parameters of the computational domain and mesh resolution of the grain avalanching test are shown in Table A.1. The properties of fluid and sediment particles are consistent with those detailed in Table 1. The fluid flow is quiescent initially. A separate simulation of particle settling is performed to obtain an initial configuration of the particles, and the particles fall from random positions under gravity with inter-particle collisions. To provide a bottom boundary condition for the moving particles, the bottom wall is covered with one layer of fixed particles with random perturbations. The physical parameters of the simulation are also shown in Table 1. The particle diameter is 0.5 mm and initial hight and width of the particle pile is 15 mm. The velocity of the sediment particles is smaller than m/s after 0.6 s. The time step is s for the fluid flow and s for the particles.
The snapshots of the arrangement of the sediment particles are shown in Fig. A.1. When the grains stop moving, the repose angle is measured by using the steepest angle of the profile (Zhao, 2014). The repose angle obtained in the present simulation is . This angle is consistent with the results obtained by using mono-dispersed spheres ( in Goniva et al. (2012) , in Zhao and Shan (2013)). Note that the repose angles of poly-dispersed or irregular sand particles are larger than that of mono-dispersed spheres (Zhao and Shan, 2013; Zhao, 2014).
| Domain dimensions | |
| length, height, thickness (, , ) | |
| length, height, thickness in mm (, , ) | |
| Mesh resolutions | |
| length, height, thickness (, , ) | |
| Particle properties | |
| total number | 6,000 |
| diameter [mm] | 0.5 |
| density [] | 2.5 |
