Crossing the Road Without Traffic Lights:
An Android-based Safety Device
Abstract
In the absence of pedestrian crossing lights, finding a safe moment to cross the road is often
hazardous and challenging, especially for people with visual impairments.
We present a reliable low-cost solution, an Android device attached
to a traffic sign or lighting pole near the crossing, indicating whether it is safe to cross the road.
The indication can be by sound, display, vibration, and various communication modalities provided by
the Android device. The integral system camera is aimed at approaching traffic.
Optical flow is computed from the incoming video stream, and projected onto an influx map,
automatically acquired during a brief training period. The crossing safety is determined
based on a 1-dimensional temporal signal derived from the projection.
We implemented the complete system on a Samsung Galaxy K-zoom Android smartphone,
and obtained real-time operation. The system achieves promising experimental results,
providing pedestrians with sufficiently early warning of approaching vehicles.
The system can serve as a stand-alone safety device, that can be installed where pedestrian
crossing lights are ruled out. Requiring no dedicated infrastructure, it can be powered by a solar panel and
remotely maintained via the cellular network.
Keywords:
pedestrian crossing, traffic analysis, optical flow, blind & visually impaired,
resource-limited computer vision, Android device
1 Introduction
Safe road crossing requires conflict-free sharing of road surface. Pedestrian crossing lights bring traffic to a halt to ensure secure crossing. Other right of way regulations, such as zebra-crossings, are less reliable. Drivers do not consistently yield to pedestrians [27, 25], even to blind persons holding a white cane. Thus, for safe crossing in the absence of crossing lights, pedestrians need to identify occasional traffic gaps [8].
The duration of a traffic gap allowing safe crossing is determined by the crossing time. US data [1] indicates a representative crossing speed of about 1.2m/s and urban road widths of 5.5m (one-way single lane) or 8.5m (two-way or two-lane one-way) with shoulders. The corresponding crossing times are 4.5s and 7s respectively. The necessary traffic gap, equivalent to the needed advance warning of an approaching vehicle, must be at least that long.
Recognizing an approaching vehicle 7s ahead of contact time is possible for people with normal or corrected vision and solid cognitive function. For blind and visually impaired people, as well as for elderly persons, children [20] and others, sufficiently early recognition of an approaching vehicle can be implausible. Blind people are trained to rely on hearing and follow the “cross when quiet” strategy [24]. Auditory-based performance is less than ideal [11, 4] and further difficulties arise where background urban noise masks the low noise emitted by a modern car [7], or when the pedestrian has less than perfect hearing.
lmage and video processing methods to assist visually handicapped people were reviewed in [23, 12, 18]. Many techniques convert visual data to auditory or haptic signals. These include systems to locate street crossings [26, 14, 21]. Converting traffic light status to an auditory or other indication was considered in [3, 5, 15]. Sensor-rich “smart canes” have been developed [16, 9, 6] for close-range obstacle detection and path planning. However, the problem of road crossing at unsignalized crosswalks has remained open. A noteworthy exception is the work of [2], aimed at providing a robotic system with street-crossing capability.
We recently presented [22] a system positioned near a road crossing, alerting pedestrians of approaching traffic and detecting traffic-gaps suitable for safe crossing. The experimental results reported in [22] were obtained using a laptop computer connected to an external USB camera with an add-on narrow field of view lens. The major open question concerned the feasibility of implementation on a platform powerful enough to achieve real-time operation and meet the optical requirements, cheap enough to allow widespread installation, and power-frugal to permit stand-alone solar-powered operation. This paper expands [22] by satisfying these requirements using an off-the-shelf Android device, and by demonstrating successful autonomous operation at actual road crossings111Video: www.eng.tau.ac.il/~nk/crosswalk-safety.html.
2 Stationary Location-Specific Solution
Consider a vehicle approaching a crosswalk at 50km/h. Detecting this vehicle 7s in advance, implies detection at about 100m away from the crosswalk. At that distance, the viewing angle of the front of a typical car is about horizontally and slightly less vertically. In many suburban and country roads, speeds up to 100km/h are not unusual, corresponding to roughly at the required detection distance.
Assuming a straight road towards the crosswalk, the tiny-looking approaching vehicle appears near the vanishing point in the picture plane. Reliable detection requires predetermination of the point of first appearance, and narrow field of view monitoring centered at that point. With some exaggeration, this can be illustrated as watching the scene through a straw. One might wish for a smartphone application warning the holder of approaching vehicles. However, typical mobile phones have wide field of view lenses. Worse, a hand-held device would require careful pointing towards the point of first appearance, a challenge for anyone, and a formidable undertaking for people with visual, cognitive or motoric impairments.
We suggest a stationary and location-specific solution, where the system is attached, for example, to a traffic sign or a lighting pole, facing the approaching traffic. The absence of substantial ego-motion improves robustness, facilitates training and adaptation, and reduces the computational requirements, thus minimizing cost and power consumption. Beyond its technical advantages, the location-specific approach does not require a personal device, and is thus accessible to all members of society.
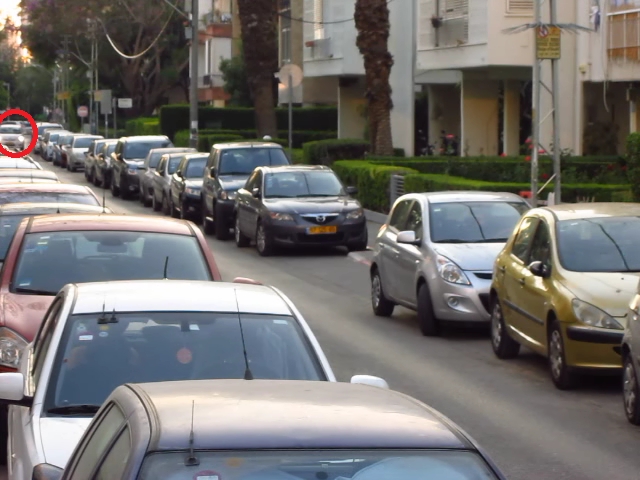
The essential system elements are a video camera with a narrow field of view lens, a processing unit, and a user interface. Optional elements include a compact solar panel and a rechargeable battery, enabling off-grid operation, and a communication unit (cellular, WiFi, etc.), allowing remote maintenance as well as cooperation with nearby instances of the system, e.g. in two-way multi-lane road crossings. As discussed in the sequel, we successfully implemented the system on the Samsung Galaxy K-Zoom smartphone, see Fig. 1.

Indication of incoming traffic, or lack thereof, can be delivered to the user as an audio, tactile or visual signal, or via a local networking interface (such as Bluetooth or WLAN) to a smartphone or a dedicated receiver.
3 Principles of Operation
Vehicles approaching a crosswalk emerge as tiny blobs at the point of first appearance. A key design choice has been to provide the pedestrian with the earliest possible warning of an approaching vehicle, rather than the latest warning that would allow crossing at the assumed walking speed. This implies that the task at hand is early detection, rather than precise estimation of the time to contact (TTC) [17, 13].
We transform the incoming video to a scalar temporal signal, referred to as Activity, quantifying the overall risk-inducing motion in the scene. Vehicles approaching the camera lead to pulses in the Activity signal, so that substantial activity ascent reflects an approaching vehicle. Timely detection of incoming traffic, with sparse false alarms, calls for reliable separation between meaningful Activity ascent and random-like fluctuations.
3.1 Activity Estimation
Motion in the scene leads to optical flow. Parts of the optical flow field may correspond to vehicles approaching the camera. Other optical flow elements are due to harmless phenomena, such as traffic in other directions, crossing pedestrians, animals on the road, moving leaves and slight camera vibrations. The suggested activity signal , where is the temporal index, is computed as the projection of the optical flow field onto an influx map. The influx map is a vector field, representing the location-dependent typical course of traffic approaching the camera. The effective support of the influx map largely corresponds to incoming traffic-lanes. Mathematically,
| (1) |
The scalar activity signal quantifies the overall hazardous traffic in the scene, sequentially obtained as the dot product between the current optical flow field and the influx map.
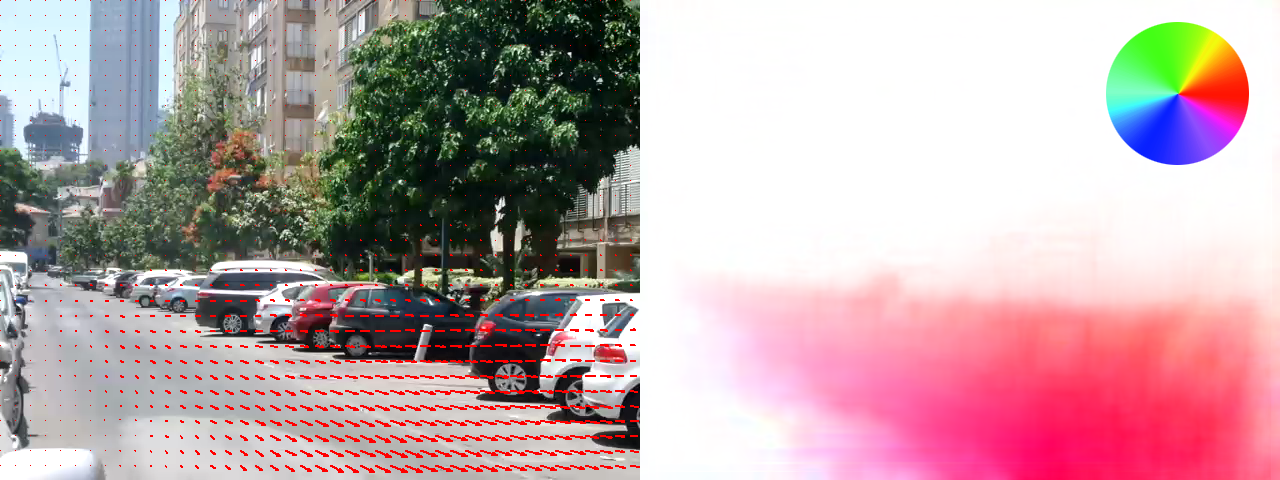
Assuming a one-way street, the influx map can be obtained by temporal averaging the optical flow field over a training period, as illustrated in Fig. 2. Temporal averaging cancels randomly oriented motion elements due to vibrations, wind and similar effects, while maintaining the salient hazardous traffic motion patterns in the road area.
The influx-map vectors can be intensified to emphasize motion near the point of first appearance, thus increasing the advance warning time, see Fig. 3. Note that the point of first appearance can be identified during training, e.g. by back-tracking the influx-map vectors to the source. Minor adjustment of the influx map computation procedure is necessary for handing two-way roads, where consistent outbound traffic is also expected.
We have tacitly presented optical flow and influx map computation in dense form, meaning that their spatial resolution is uniform and commensurate with the resolution of the video frame. However, sparse computation of the optical flow and influx map, at spatially variant density, is beneficial with regard to both performance and computational cost. Foveated computation of Eq. 1, dense near the point of first appearance and sparse elsewhere, has the desirable effect of emphasizing motion in that critical region.
3.2 Detecting Approaching Vehicles
Based on the raw Activity signal, we wish to generate a binary indication, suggesting whether risk-inducing traffic is approaching (‘TRAFFIC’ state), or a sufficient traffic gap allows safe crossing (’GAP’ state).
As a vehicle approaches the camera, the peak of the corresponding Activity pulse is usually evident. However, early warning requires detection at an early stage of ascent, where the signal to noise ratio is poor.
Reliable, timely detection cannot be achieved by direct thresholding of the Activity signal. The signal is therefore evaluated within a sliding temporal window of samples. This improves the effective signal to noise ratio, consequently increasing the detection probability and reducing the false alarm rate. However, sliding window computation inherently introduces detection latency. The extent of the sliding window must therefore be limited, to maintain the advance warning period required for safe crossing.
Suppose that the sliding window falls either on a traffic gap, modelling the Activity signal as , where is random noise, or at the precise moment a vehicle emerges, such that , where is the clean Activity pulse shape for the specific vehicle and viewing conditions. The ‘TRAFFIC’ and ‘GAP’ state hypotheses are thus
| (2) |
where is modelled as zero-mean additive white Gaussian noise.
The Activity values within a sliding window of length can be represented as a Gaussian random vector , with the likelihood functions
| (5) |
To discriminate between the two hypotheses we apply the Likelihood Ratio Test
| (6) |
where is a discriminative threshold. This leads to the detection rule:
| (7) |
where denotes the correlation of the Activity signal with the pulse template. The pulse shape depends on the particular installation, and can be learned during training. For a given installation, specific vehicle characteristics lead to some variability. The right hand side is an application-dependent threshold denoted . We determine the threshold using the Neyman-Pearson criterion, tuned to obtain a specified false-alarm probability.
Given either hypothesis, the random variable is Gaussian with variance . The probability of false alarm is determined by the tail distribution of the ‘GAP’ hypothesis :
| (8) |
where is the cumulative distribution function of the standard normal distribution and is its tail probability, i.e., . The threshold
thus depends on the admissible false-alarm rate, the noise and the Activity pulse template. The decision rule can be reformulated as
| (9) |
which is the familiar matched filter result, correlating the input sequence with the Activity pulse template we wish to detect. The corresponding probability of detection can be shown to be
| (10) |
So far, we have discussed the most demanding detection condition, the earliest detection of an incoming vehicle. The Activity pulse typically increases as the vehicle approaches; thus, once the correlator output crosses the threshold, it generally exceeds the threshold as long as the vehicle has not reached the crossing. When a vehicle appears late (e.g. leaving a parking space close to the crossing), the Activity pulse rapidly ascends, and the correlator promptly crosses the threshold.
3.3 Setting Detector Parameters
The detector is tuned according to the noise variance and the Activity pulse template. During training, by the time the influx map is computed, the system produces Activity measurements. After sufficient training, the measurements are used to automatically estimate the Activity pulse template and the noise variance.
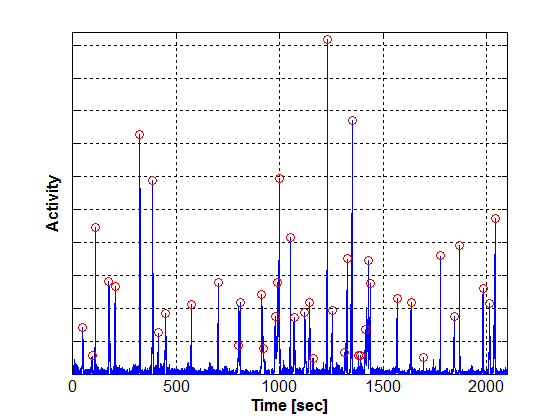
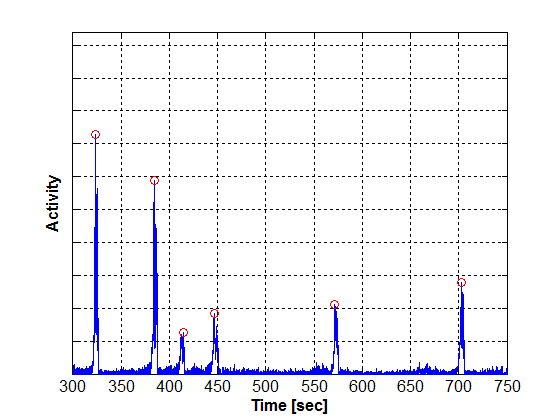
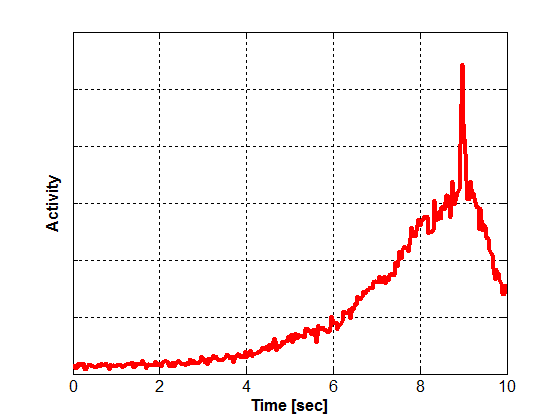
The system locates the salient local maxima of the Activity signal during training, and sets a temporal window containing each maximum, where most of the window precedes the maximum. We set the Activity pulse template as the median of the Activity signal windows, see Fig. 4.
4 Examples and Evaluation
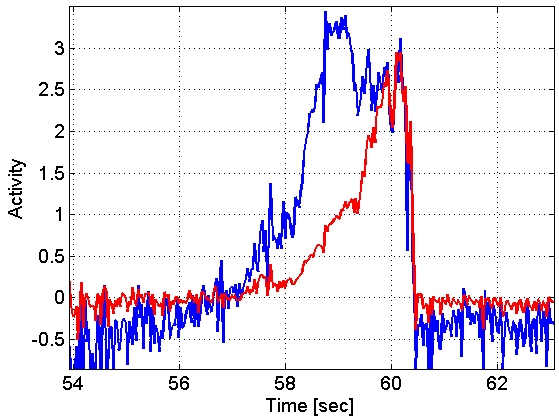
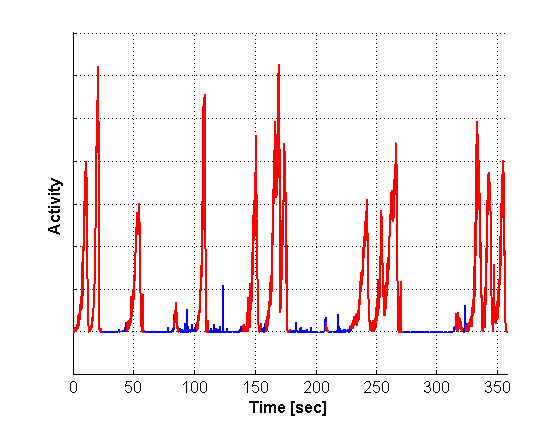
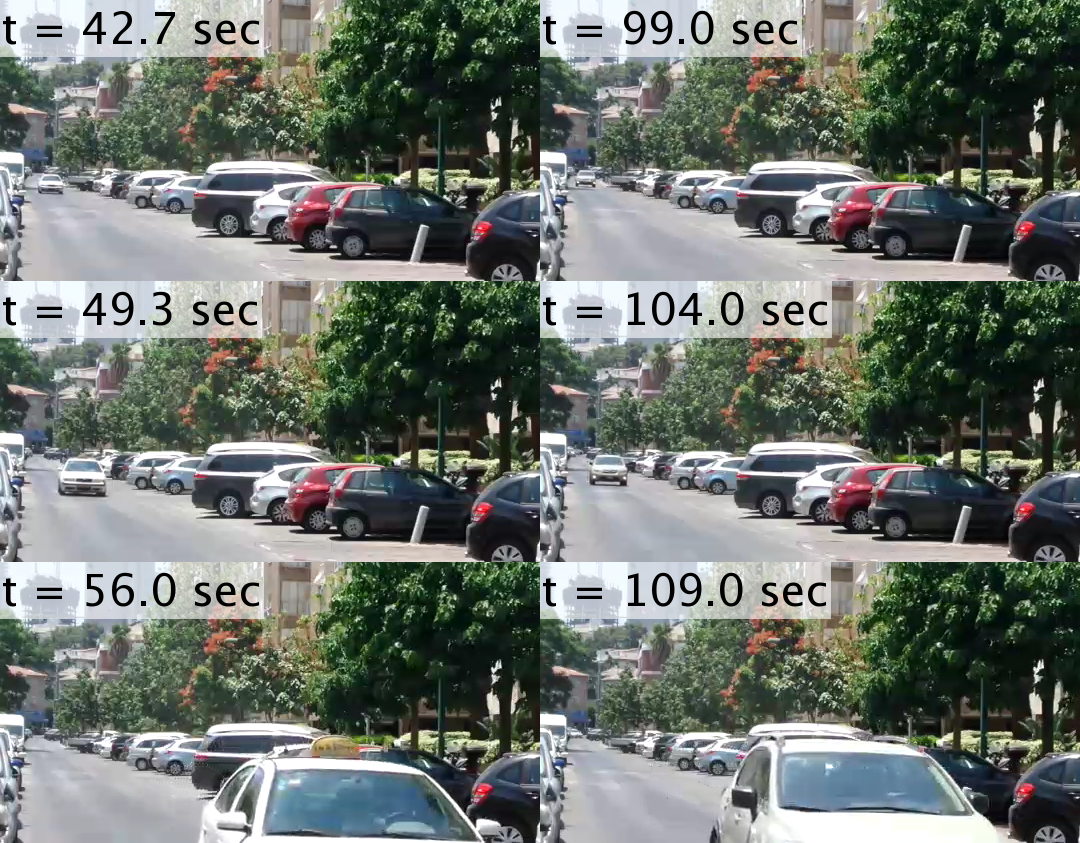
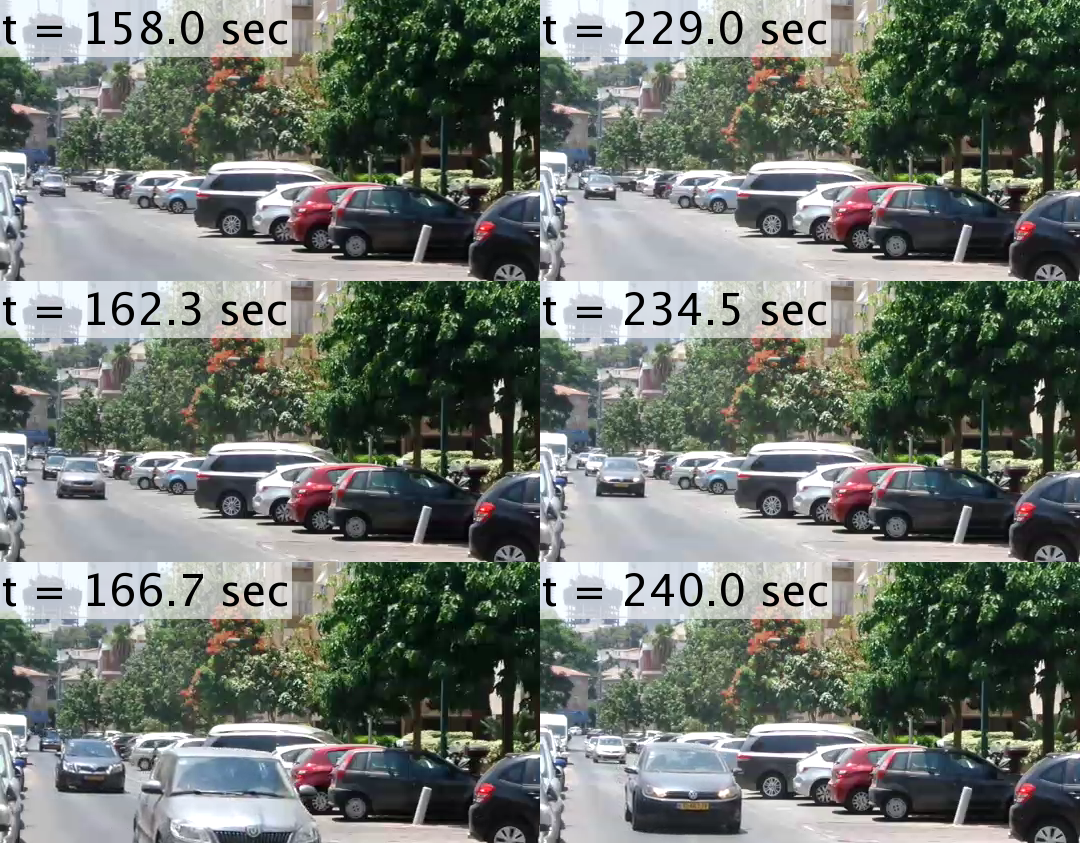
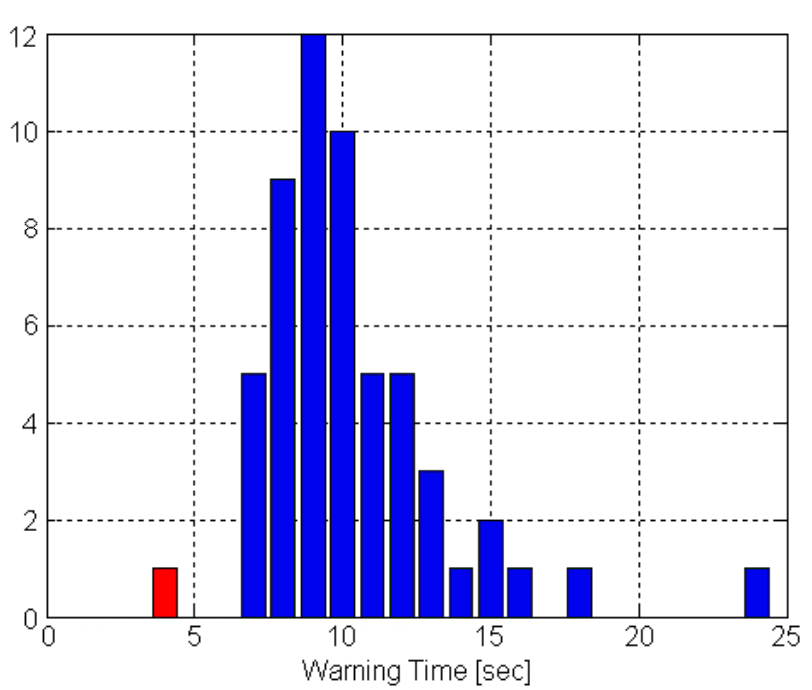
Fig. 5 shows the activity signal computed during six minutes at a test site. The color represents the prediction issued to the pedestrian, red signifying TRAFFIC and blue meaning GAP. TRAFFIC is typically indicated about 8-10 seconds before the Activity signal peak, i.e. before the car reaches the camera, allowing secure crossing with sufficient margin. Fig. 6 presents selected frames from two approaching car events, corresponding to the unimodal activity pulses at and at . Multimodal activity pulses, e.g. at and at are each due to several cars arriving in sequence. Corresponding snapshots are shown in Fig. 7. The false alarms at and are not due to random noise: the first was caused by a person on the road, the second by a cat. The random noise level is rather low, as seen circa in Fig. 5. Fig. 8 is the histogram of advance warning times provided by the system during two hours of testing.
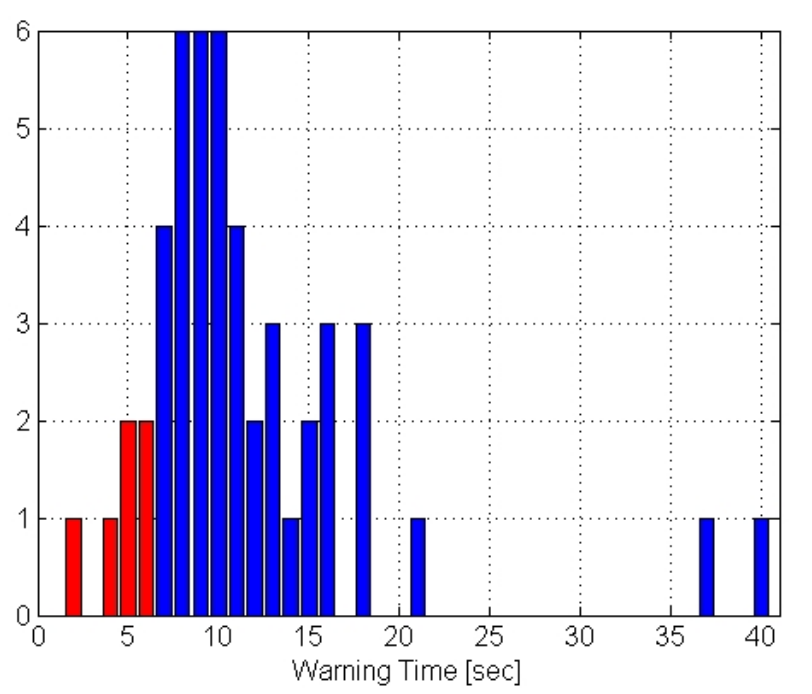
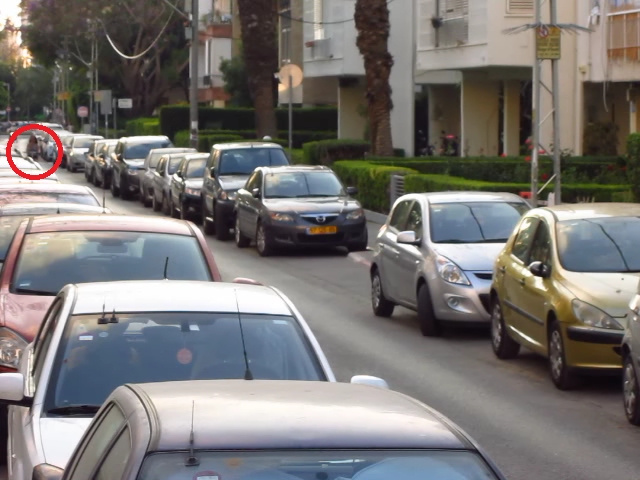
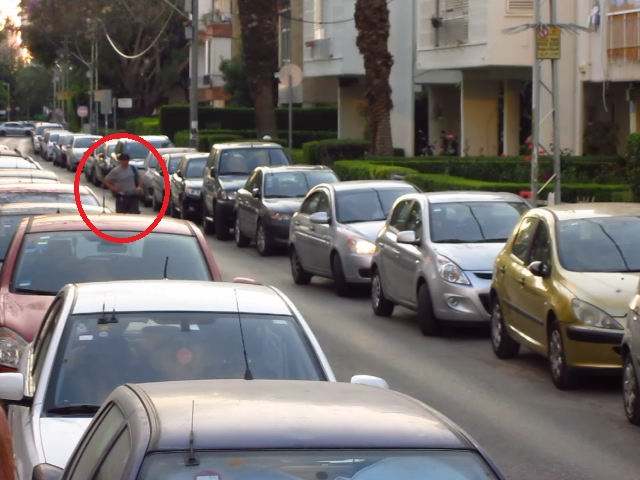
In the archetypal case, an approaching vehicle emerges close to the point of first appearance, thus maximizing the achievable warning time. However, in various urban or suburban settings, a vehicle can exit a parking place close to the camera, or turn into the monitored road from an adjacent driveway. Thus, while the typical visibility period of an incoming vehicle is often greater than 10s, in unusual cases it can be as short as 1s, providing neither the system nor an alert human with sufficient warning. Fig. 9 is the histogram of the advance warning times obtained during one hour at the challenging installation shown in Fig. 10, characterized by substantial occlusion near the point of first appearance and a residential afternoon activity pattern, including parking, biking and strolling. Short warning times usually correspond to bikes and very slow vehicles, that impose minimal hazard. Irregular events acquired by the system, leading to unusually short or long advance warnings, are exemplified in Fig. 10. Additional results, including ROC curves, can be found in [22].
5 Real-Time Implementation
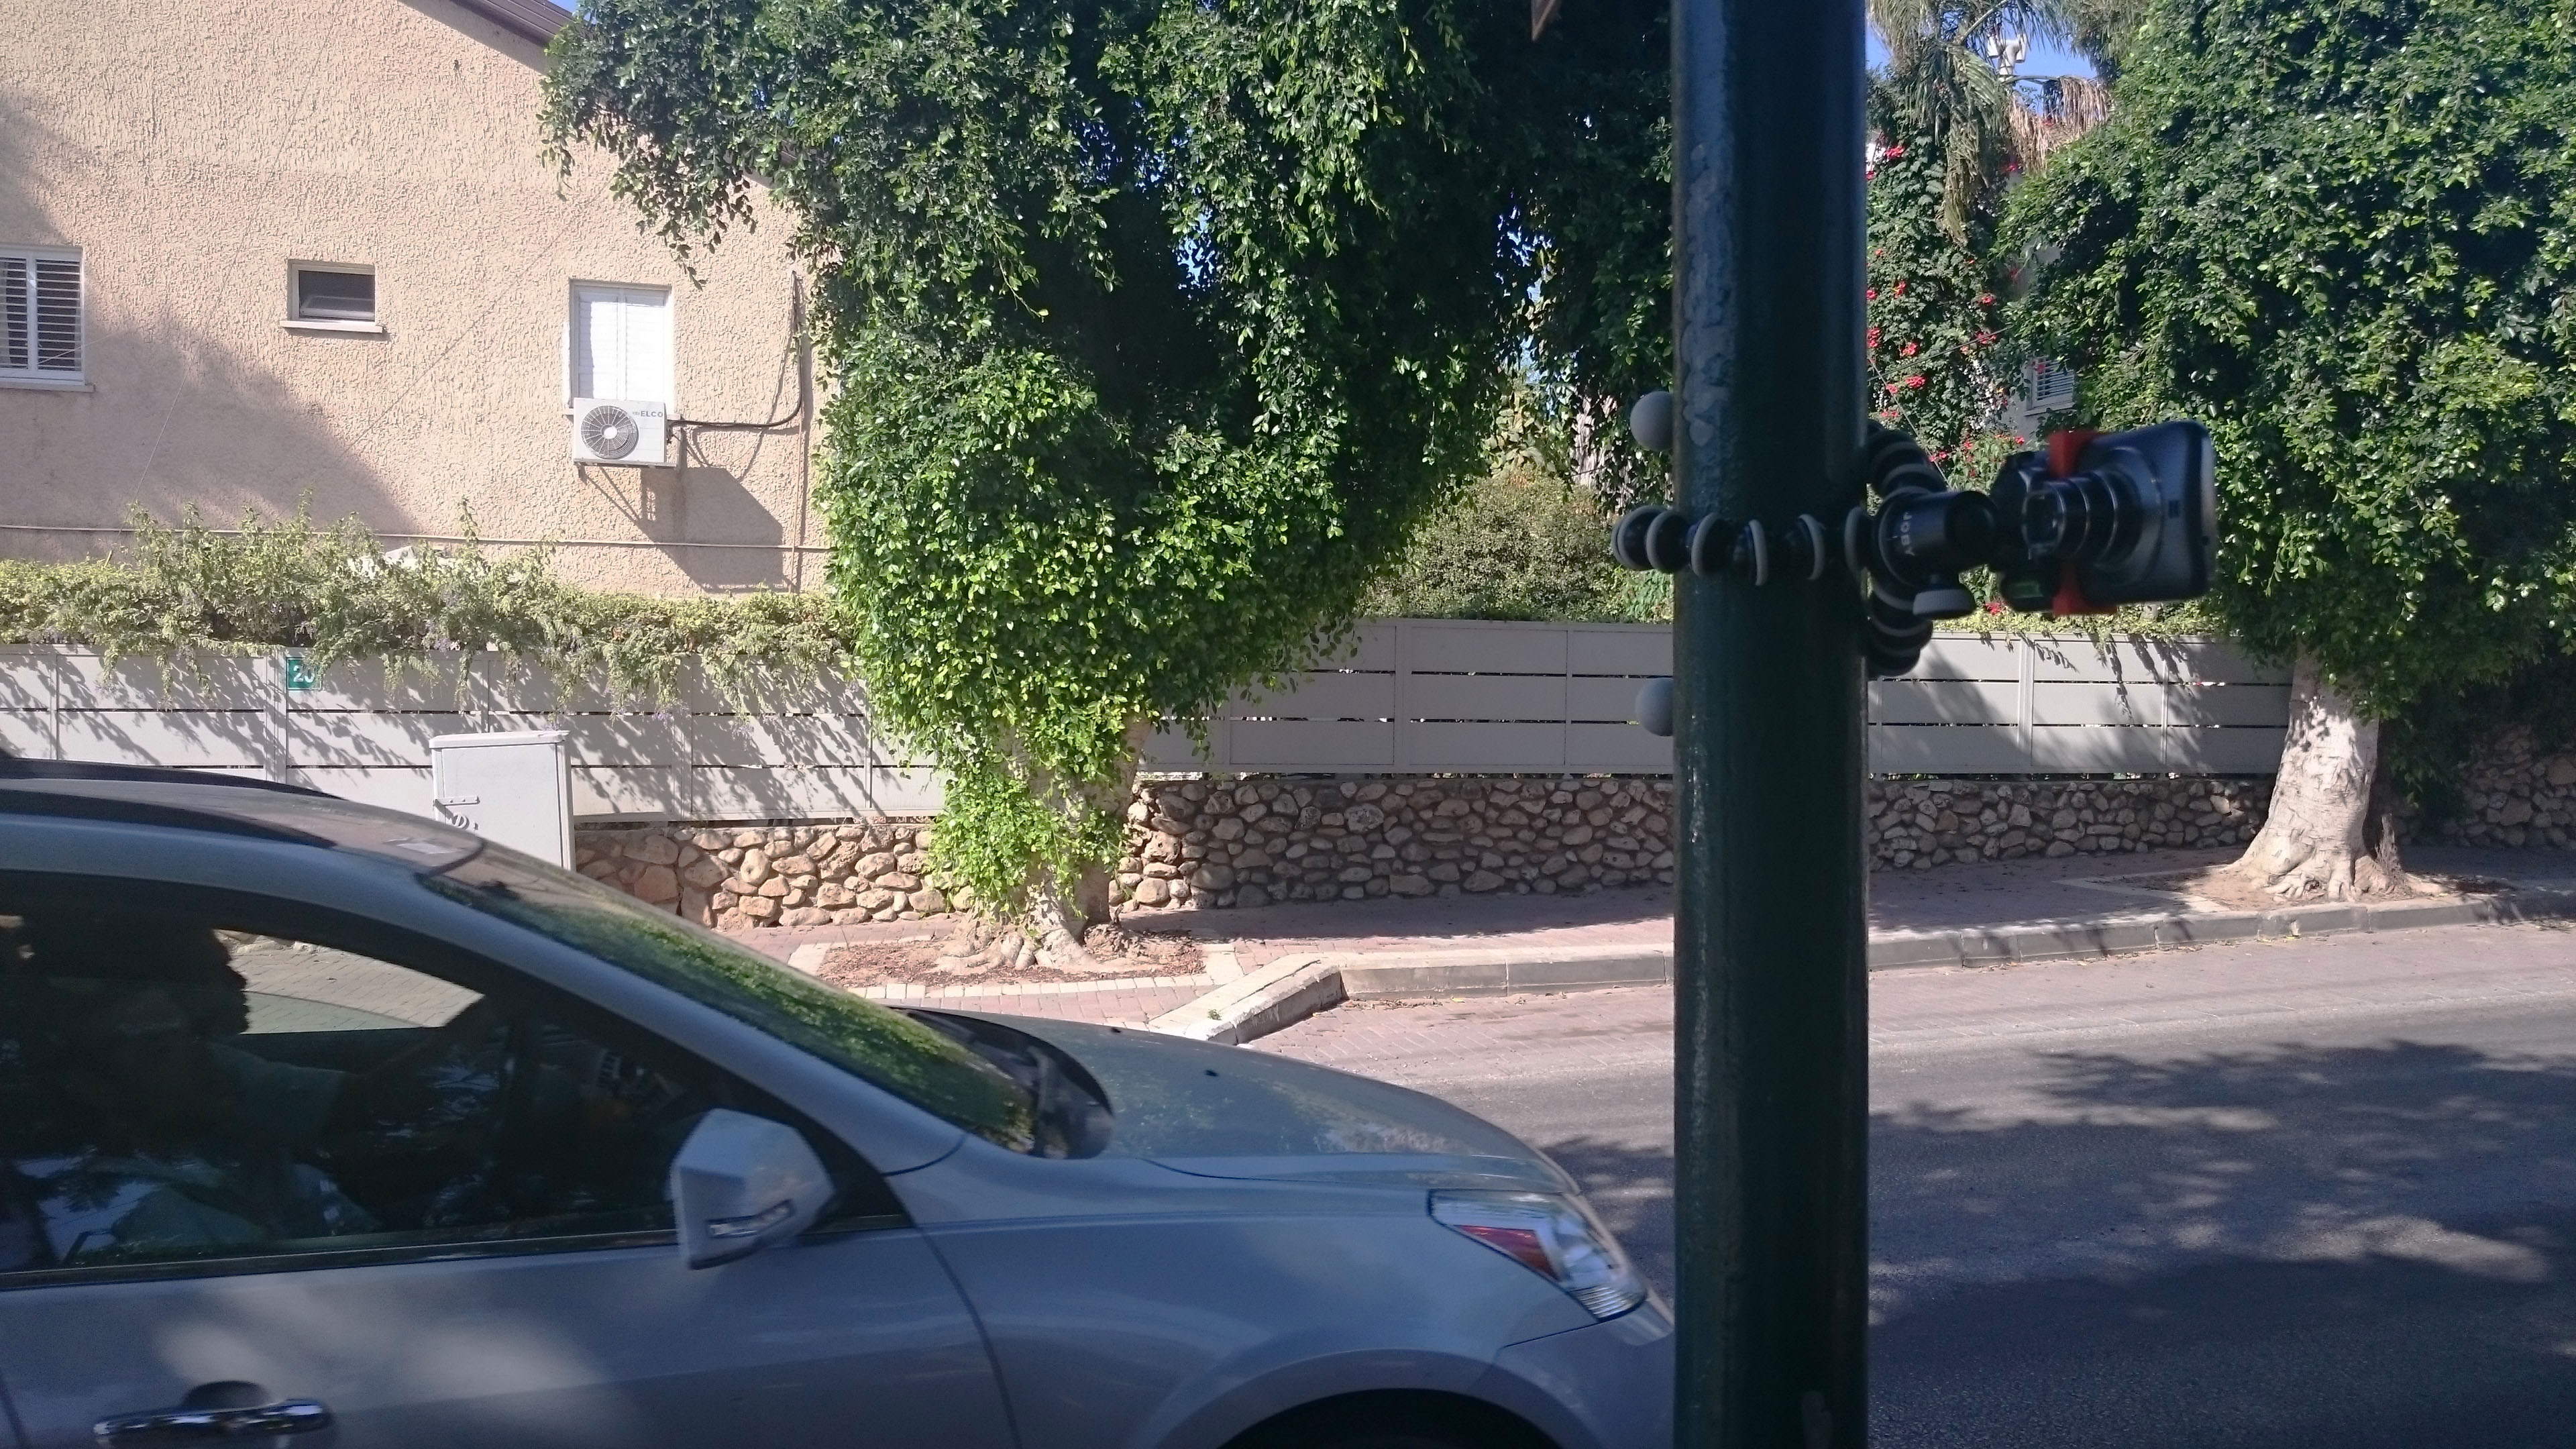
To show that low-cost realization and wide deployment are possible, we implemented the system using an off-the-shelf Android device. Since the solution requires a narrow field-of-view lens, we selected the Samsung Galaxy K-zoom smartphone, that has a built-in variable zoom lens. Note that the variability of the optical zoom lens is not necessary, and the system can be readily built and operated using a fixed-zoom lens. Fixed-zoom lenses are widely available as low-cost smartphone accessories. Furthermore, unless remote management and distributed cooperative operation are sought, the cellular communication parts of the smartphone are redundant. In addition, although the K-zoom has a GPU capable of reducing computation time and increasing the frame rate, our implementation only utilized the smartphone’s CPU. Thus, the system can be implemented on extremely low-cost Android tablet-like devices. In many applications, the screen of the Android device is not in use, and can be shut down or removed altogether to further reduce the power consumption and cost.
Other than its variable zoom lens, the Samsung Galaxy K-zoom, introduced in 2014, is similar to smartphones of its generation, with Android v4.4.2 (KitKat) as its native operating system. Fig. 11 shows an installation of the system at a test site, attached to a lighting pole, with its zoom lens extended.
The target system software was developed using OpenCV4Android SDK version 2.4.10, FFmpeg and JavaCPP. The most demanding computational task is optical flow estimation. During training, dense optical flow estimation is required for generating the influx map. For that purpose, we used the OpenCV4Android implementation of Farnebäck’s algorithm [10], skipping frames to improve the estimation of the tiny optical flow vectors near the point of first appearance. Following the identification of that point, a subset of 2000 image points was sampled using a Gaussian density function centered at the point of first appearance. In the online phase, sparse optical flow is evaluated only at those points, using the OpenCV4Android implementation of the Lucas-Kanade [19] algorithm. The Activity signal is computed by projecting the sparse optical flow field onto the corresponding sparse subset of the influx map. A rate of 8 frames per second is easily obtained on the K-zoom smartphone. To reduce power consumption, the rate can be decreased to two frames per second without significant performance degradation. The template matching process (7) is carried out at 30 frames per second using temporal interpolation. The results shown in Figs. 5-8 were obtained using the real-time smartphone-based implementation.
Two way streets, as encountered for example in the test site shown in Fig. 1, raise two issues. First, warning about traffic approaching the crossing from the opposite direction can be obtained by installing an additional instance of the system with its camera pointing in that direction. Cellular, WiFi or Bluetooth communication between the two systems allows issuing a mutually agreed indication to the pedestrian. Second, in a two way road, as the camera monitors incoming traffic, distancing vehicles may be seen in the field of view. To distinguish incoming from outgoing traffic based on optical flow, one might compute vector field measures such as divergence. In practice, assuming that the camera is installed higher than typical vehicles, the distinction can be based on the sign of the vertical component of the optical flow vector: incoming vehicles are associated with descending optical flow vectors. In the Android implementation, upwards-pointing vectors in the influx map are simply nullified. Indeed, the system works well at the test site shown in Fig. 1 using that method.
6 Discussion
The global number of visually impaired people worldwide has been estimated to be 285 millions [28], and many more have age-related disabilities limiting their road-crossing skills. Reliable mobile personal assistive devices for road crossing without traffic lights are yet to be invented, but in any case are likely to be beyond the means of needy people worldwide. The goal of this research has been the development of an effective, easy to use, low cost solution. It is facilitated by the stationary, location-specific approach, avoiding system ego-motion altogether. System installation is simple, as the location-dependent influx map and the Activity pulse template are automatically obtained by training.
In this expanded version of [22], the major additional accomplishment is the demonstration of real-time stand-alone operation using an off-the-shelf Android device. The retail price of a suitable Android tablet, including all necessary components, is less than US$ 40 at the time of writing, and the marginal cost of a fixed narrow field lens is negligible. The mass-production manufacturing bill of materials, especially for a screen-less version of the system, is therefore likely to be widely affordable.
Interestingly, in their future work section [2] imagined a stationary solution for the unsignalized road crossing problem. Nevertheless, our approach is substantially more robust, computationally lighter and better exploits stationarity when compared to the tracking-based method applied by [2] in their robotic system.
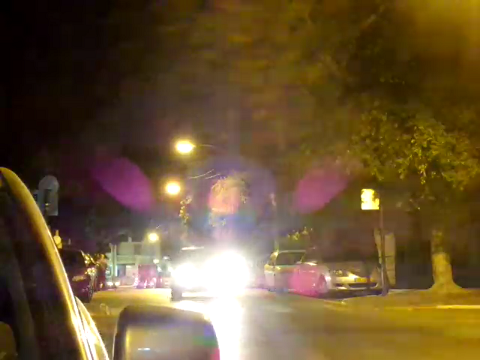
We evaluated the system at several test locations, obtaining promising results. These experiments were carried out at fair weather conditions. Additional work is needed to ensure reliable operation in the presence of rain or snow. Night-time operation is an additional challenge; the powerful headlights of an approaching car, aimed directly at the camera in the dark of night, create various imaging artifacts as seen in Fig. 12. Advance warning of an approaching vehicle after dark might be based on the presence of significant camera saturation.
References
- [1] American Association of State Highway and Transportation Officials. A Policy on geometric design of highways and streets. Washington, D.C., 2004.
- [2] M. Baker and H. Yanco. Automated street crossing for assistive robots. In Proc. 9th Int Conf on Rehabilitation Robotics. IEEE, 2005.
- [3] J. Barlow, B. Bentzen, and L. Tabor. Accessible Pedestrian Signals: Synthesis and Guide to Best Practice. National Cooperative Highway Research Program, 2003.
- [4] B. Barton, A. Ulrich, and R. Lew. Auditory detection and localization of approaching vehicles. Accident Analysis & Prevention, 49:347–353, 2012.
- [5] S. Bohonos, A. Lee, A. Malik, C. Thai, and R. Manduchi. Universal real-time navigational assistance (URNA): an urban bluetooth beacon for the blind. In Proc. Healthnet, pages 83–88. ACM, 2007.
- [6] G. Buchs, S. Maidenbaum, and S. Amedi. Obstacle identification and avoidance using the ‘EyeCane’. Proc. EuroHaptics, Springer LNCS, 8619:96–103, 2014.
- [7] R. Emerson, K. Naghshineh, J. Hapeman, and W. Wiener. A pilot study of pedestrians with visual impairments detecting traffic gaps and surges containing hybrid vehicles. Transportation Research Part F Traffic Psychol. Behav., 14(2):117–127, 2012.
- [8] R. Emerson and D. Sauerburger. Detecting approaching vehicles at streets with no traffic control. Journal of Visual Impairment & Blindness, 102(12):747–760, 2008.
- [9] J. Fallon. Systems and methods for laser radar imaging for the blind and visually impaired, 2008. US Patent App. 12/139,828.
- [10] G. Farnebäck. Two-frame motion estimation based on polynomial expansion. Proc. SCIA, Springer LNCS, pages 363–370, 2003.
- [11] S. Hassan. Are normally sighted, visually impaired, and blind pedestrians accurate and reliable at making street crossing decisions? Investigative Ophthalmology & Visual Science, 53(6):2593–2600, 2012.
- [12] M. Hersh and M. Johnson. Assistive Technology for Visually Impaired and Blind People. Springer, 2008.
- [13] B. Horn, Y. Fang, and I. Masaki. Time to contact relative to a planar surface. In Proc. IEEE Intelligent Vehicles Symposium, pages 68 –74, 2007.
- [14] V. Ivanchenko, J. Coughlan, and H. Shen. Crosswatch: A camera phone system for orienting visually impaired pedestrians at traffic intersections. Proc. ICCHP, Spronger LNCS, 5105:1122–1128, 2008.
- [15] V. Ivanchenko, J. Coughlan, and H. Shen. Real-time walk light detection with a mobile phone. Comput Help People Spec Needs, 6180:229–234, 2010.
- [16] L. Kay. A sonar aid to enhance spatial perception of the blind: engineering design and evaluation. Radio and Electronic Engineer, 44:605, 1974.
- [17] D. Lee. A theory of visual control of braking based on information about time-to-collision. Perception, 5:437–459, 1976.
- [18] M. Leo, G. Medion, M. Trivedi, T. Kanade, and G. Farinella. Computer vision for assistive technologies. Computer Vision and Image Understanding, in press, 2016.
- [19] B. Lucas and T. Kanade. An iterative image registration technique with an application to stereo vision. In Proc. 7th IJCAI, Vol. 2, pages 674–679, 1981.
- [20] B. Morrongiello, M. Corbett, M. Malinovic, and J. Beer. Using a virtual environment to examine how children cross streets: Advancing our understanding of how injury risk arises. J. Pediatr. Psychol., 41(2):265–275, 2016.
- [21] V. Murali and J. Coughlan. Smartphone-based crosswalk detection and localization for visually impaired pedestrians. In Proc. Int Conf Multimed Expo Workshops, pages 1–7. IEEE, 2013.
- [22] A. Perry and N. Kiryati. Road-crossing assistance by traffic flow analysis. Proc. ACVR, ECCV 2014 Workshops, Springer LNCS, 8927:361–374, 2014.
- [23] T. Pun, P. Roth, G. Bologna, K. Moustakas, and D. Tzovaras. Image and video processing for visually handicapped people. EURASIP Journal on Image and Video Processing, 2007, 2007.
- [24] D. Sauerburger. Developing criteria and judgment of safety for crossing streets with gaps in traffic. Journal of Visual Impairment & Blindness, 93(7):447–450, 1999.
- [25] B. Schroeder and N. Rouphail. Event-based modeling of driver yielding behavior at unsignalized crosswalks. Journal of Transportation Engineering, 137(7):455–465, 2011.
- [26] T. Shioyama and M. Uddin. Detection of pedestrian crossings with projective invariants from image data. Measurement Science and Tech., 15:2400, 2004.
- [27] D. Wei, H. Liu, and Z. Tian. Vehicle delay estimation at unsignalised pedestrian crosswalks with probabilistic yielding behaviour. Transportmetrica A: Transport Science, 11(2):103–118, 2015.
- [28] World Health Organization. Global data on visual impairments. http://www.who.int/blindness/GLOBALDATAFINALforweb.pdf, 2010.