NEDindex: A new metric for community structure in networks
Abstract
There are several metrics (Modularity, Mutual Information, Conductance, etc.) to evaluate the strength of graph clustering in large graphs. These metrics have great significance to measure the effectiveness and they are often used to find the strongly connected clusters with respect to the whole graph. In this paper, we propose a new metric to evaluate the strength of graph clustering and also study its applications. We show that our proposed metric has great consistency which is similar to other metrics and easy to calculate. Our proposed metric also shows consistency where other metrics fail in some special cases. We demonstrate that our metric has reasonable strength while extracting strongly connected communities in both simulated (in silico) data and real data networks. We also show some comparative results of our proposed metric with other popular metric(s) for Online Social Networks (OSN) and Gene Regulatory Networks (GRN).
Index Terms:
Social network, Graph clustering, Community structure, Complex network.I Introduction
Analysis of graph is very important in OSN, GRN, Distributed Computing Systems (DCS), Multi-Core Architecture (MCA) and so on. In OSN, we can easily represent the interactions among users by a graph where we can map users as nodes and interactions among users as edges. Similarly, we can reproduce a graph from other fields (GRN, DCS, MCA) as well. It is important to note that all users do not communicate with all other users in OSN. They form community and interact with other users in that community. All the regulators do not interact with all other genes in GRN. A set of regulators interacts with a particular set of genes i.e., they also form groups or communities. Thus, effective graph clustering has become an important research area where several groups or communities are formed in large graph. A large body of research works have been carried out in these areas [1, 2, 3, 4]. Notably, some research works have been done to measure the effectiveness of such graph clustering or graph partitioning [5, 6].

An undirected graph, is represented as , where is the total number of vertices (nodes) and is the total number of edges (link between any two nodes) in graph . Clusters are represented as , where is a cluster that consists of a set of nodes and associated edges from the graph, . In Figure 1, we see a graph, where and all links between any two vertices. There are two clusters, such that and . We have shown and by dotted circles in Figure 1 as ‘Cluster X’ and ‘Cluster Y’. We use the term component to represent all the vertices and associated edges of a cluster.
Any size of clusters provide necessary information and these are not helpful in general to analyze complex networks. If we want to break a given network into clusters, we do not know how many clusters there are going to be and it is true that all clusters should not be the same size. If we consider Facebook, there are billions of users (nodes) as well as billions of interactions (edges) and we do not know how many clusters or communities are there. While clustering, we do not even need to minimize inter-community edges as more such edges may be present between large communities compared to small ones. Sometimes, a small strongly connected community is superior to other weakly connected communities. So, effective clustering is a difficult but important task in large graphs.
Now, the question is how can we cluster such large graphs of OSN or GRN and measure the effectiveness of such clustering. For example, what would be the problem if we clustered the graph in Figure 1 as such that , and ? It seems that there would have weekly connected cluster(s). We observe in Figure 1 that two clusters have greater strength than three clusters. So, we need some metrics that evaluate such strength. A lot of research works have been done to discover such metrics. In this paper, we also focus on presenting a metric that is more effective and efficient to calculate. More specifically, we propose a graph clustering metric named Node-Edge-Degree index (NEDindex) and successfully apply this on both simulated data and real-world data. We use popular graph theories to estimate the value of NEDindex which varies between . We also show that NEDindex has greater consistency than some other metrics. In fact, NEDindex gives consistent measurement where some popular metrics fail to evaluate effectiveness. In addition, we apply NEDindex in some real-world application like community detection in social networks and sub-network classification in gene regulatory networks. In the rest of the paper, we use cluster, community, sub-network and group interchangeably.
We organize rest of the discussion as follows. We give some existing metrics in section II. In section III, we discuss our proposed metric and show how to calculate it. We give experimental results in section IV and provide two real world applications in section IV-A. Finally, we conclude briefly in section V.
II Related Works
In the literature, there are lots of works regarding graph clustering. As we are more concerned with determining strength of a cluster in a graph, a more useful technique is used in social network analysis known as hierarchical clustering. In this technique, clusters are discovered from natural divisions depending on some similarity metrics or strong interactions between nodes. We can divide these into two broad classes namely agglomerative and divisive [7]. This classification depends on whether we add or remove edge(s) to or from the social graphs. Sometimes, we may observe some built-in similarity. For example, in filmography, network of collaborations between film celebrities has been studied in [8, 9] where actress/actors are interlinked if they perform in the same film. One can also measure the similarity by how many movies in which actress/actors act together [10].
In [6], authors focus on divisive methods. This method actually starts with the network of interest and try to locate the weakly connected pairs of nodes and then unlink the edges between them. They use betweenness measure of graph theory. The simplest example of such measure is that based on shortest (geodesic) paths: they find the shortest paths between all pairs of vertices and count how many run along each edge. They call it modularity and according to authors, this measure was first introduced by Anthonisse in a never-published technical report in 1971 [11]. Anthonisse named it “rush”, but they use the term edge betweenness, since the measurement is a natural generalization to edges of the strongly connected (vertices) betweenness measure of Freeman [12]. Now, modularity has become a very popular metric in graph clustering. In [13], authors provide another reliable metric named Normalized Mutual Information (NMI) which is a measure of similarity for groupings taken from information theory.
In this work, we focus more on degree centrality of a graph. This technique has been relatively little explored in the previous literature, either in OSN or GRN, but, as we will see, seems to provide a lot of consistency.
III The NEDindex metric
In this section, we present all the necessary equations to estimate NEDindex metric. For the sake of simlicity, here, we use undirected unweighted graph to calculate NEDindex. But, we can also calculate NEDindex for other kinds of graph like directed-weighted, undirected-weighted and directed-unweighted. At first, we give a popular formula from graph theory in Equation 1. It says that the total degree of an undirected graph is equal to twice the number of edges in that graph.
| (1) |
Here, represents edge(s) in graph such that , . We present Equation 2 to calculate , where is a cluster in graph .
| (2) |
Here, is the number of vertices in cluster , is the number of edges among all vertices () in cluster , is the total degree of cluster considering edges and is the total number of degree of vertices in original graph, . Note that is the total number of edges in a complete graph of vertices such that . Finally, we calculate NEDindex using Equation 3 as follows.
| (3) |
Here, represents clusters where, is the total number of clusters in graph .

We show a graph in Figure 2 as an example of three clusters. In this Figure, we denote ‘Cluster X’, ‘Cluster Y’ and ‘Cluster Z’ as , and respectively. So, we calculate NEDindex for this graph (Figure 2) as follows:
Similarly, we get .
The value of NEDindex will vary between 0 to 1. When the value of NEDindex is more close to 1, then all the nodes of that clusters are more strongly connected with respective to the whole graph. Similarly, nodes of clusters are weekly connected if value of NEDindex is close to 0. According to [6], modularity metric is calculated using following formula, where is modularity.
Here, indicates the number of edges with respect to adjacency matrix , indicates the degree of node , indicates the community membership of node and if .
The value of modularity metric generally varies between [-1,+1] but sometimes it also varies between [0, 1] based on the representation. The value of NMI also varies between [0-1]. In case of modularity or NMI, the same information holds true about performance i.e., higher value indicates strongly connected community and lower value indicates weakly connected community. For the graph shown in Figure 2, we get the value of modularity metric as 0.5238.
IV Experimental Results
In this section, we illustrate experimental results on our proposed metric. To conduct experiments, we implement NEDindex metric in Matlab language. We conduct all the experiments in a laptop PC configured as 4GB RAM, Intel Corei3 @ 1.9GHz and 64-bit Windows 8. First, we calculate NEDindex value for two simple graphs shown in Figures 2 and 5. Then, we estimate the value of NEDindex for Karate club network given from [14]. In both cases, we show corresponding value of modularity metric. Finally, we present two exceptional results where modularity metric does not show consistency but NEDindex performs well.
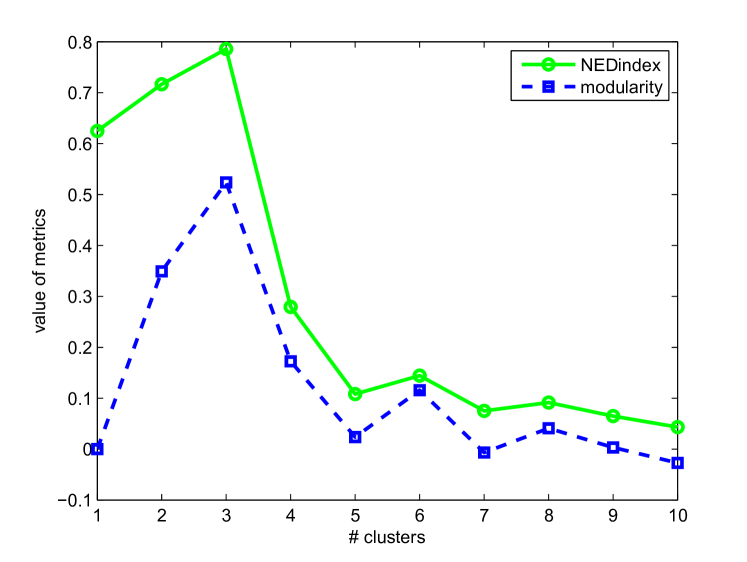
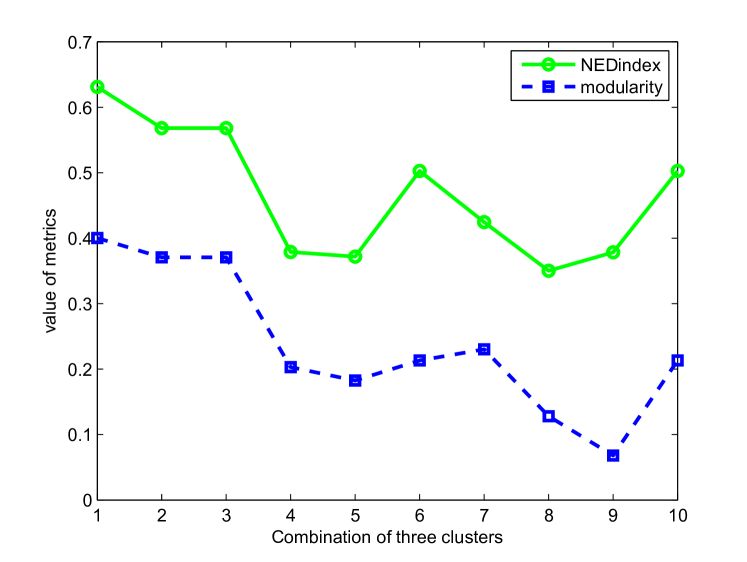
In Figure 3, we show the measurement of both NEDindex and modularity for various size of clusters based on Figure 2. We observe that, we get peak value in both cases for the cluster of size 3. To investigate further, we keep the cluster size as 3 but take different number of nodes in different clusters. We see that the value of NEDindex goes up and down with strong clusters and weak clusters respectively. We report the results in Figure 4.

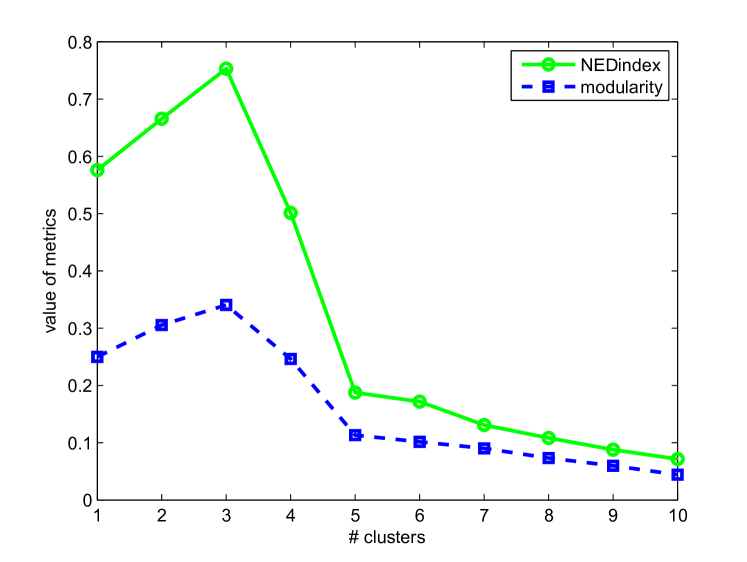
We conduct experiments on another graph shown in Figure 5. From this graph, we can easily observe that there are three strongly connected clusters, where , and . However, while doing experiments, we vary the size of clusters. We report experimental results in Figure 6. We clearly see that experimental results support our observation i.e., forms strongly connected clusters and we get the peak value for that .
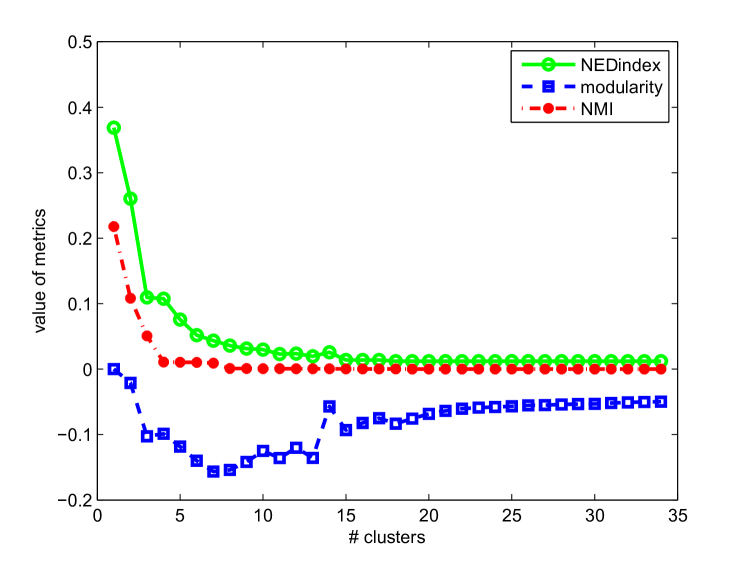
Now, we consider Karate club network from [14]. There are 34 vertices and 78 edges. We conduct random experiment on Karate network varying cluster size (also called number of clusters in a graph) from 1 to 34. For each of the cluster size, we use linkage and cluster functions of Matlab language and generate components for each of the clusters. We use Algorithm 1 to conduct experiments and compare different metrics. Input of the algorithm is an adjacent matrix. According to our computation, we consider that the maximum number of clusters will be the total number of vertices in the graph. We calculate all three metrics (NEDindex, modularity, NMI) for the same size and components of clusters. We run the experiments five times for each size of cluster and take average value of each metric. We report the results in Figure 7. We see that NEDindex is consistent with increasing number of clusters. From Figure 7, we also get that clusters become weakly connected when number of clusters increase unnecessarily.

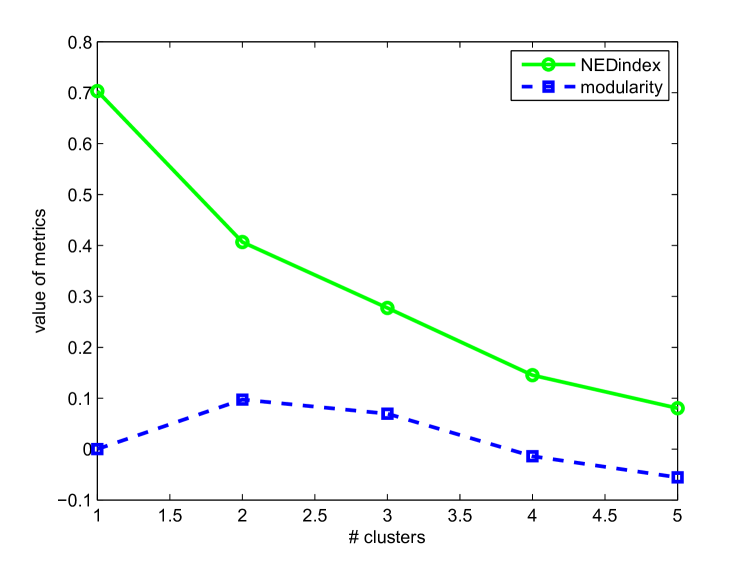
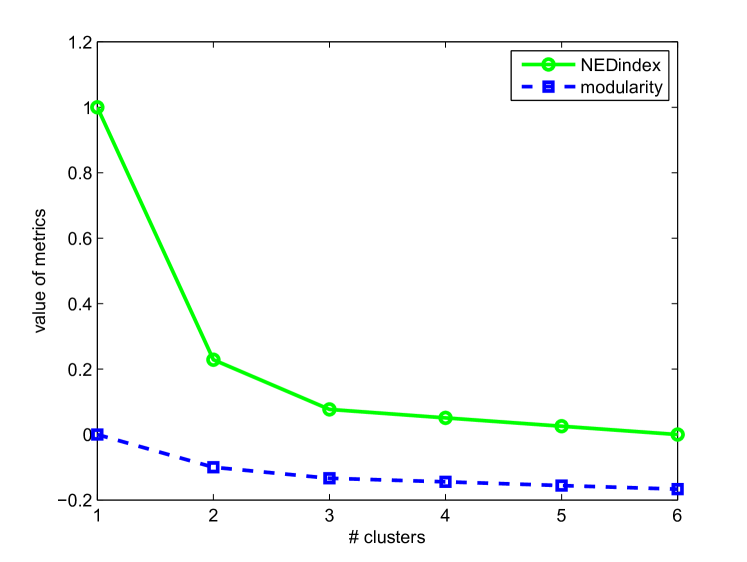
In Figure 8, we also show two exceptional graphs where modularity seems inconsistent. For the complete graph shown in Figure 8 (right), when we consider the cluster size 1, the modularity metric is very close to 0. But, it should be close to 1 as cluster is strongly connected. After that the value of modularity metric decreases with increasing number of cluster size. Our NEDindex is very close to 1 if the size of cluster is 1 for a complete graph. This shows high consistency while evaluating strongly connected components. After that the value of NEDindex decreases with increasing number of cluster size which also shows consistency. For the wheel graph shown in Figure 8 (left), we also see the same characteristics for NEDindex. In case of modularity metric, we see that the value of measurement increases when cluster size is 2. But, that should not be the usual case because the strength of connectedness is higher for cluster size 1 rather than 2. From cluster size 3 to upwards, the value of modularity metric decreases again. We report the results of these two special cases in Figure 9 and 10.
IV-A Applications
IV-A1 Community Detection in Social Networks
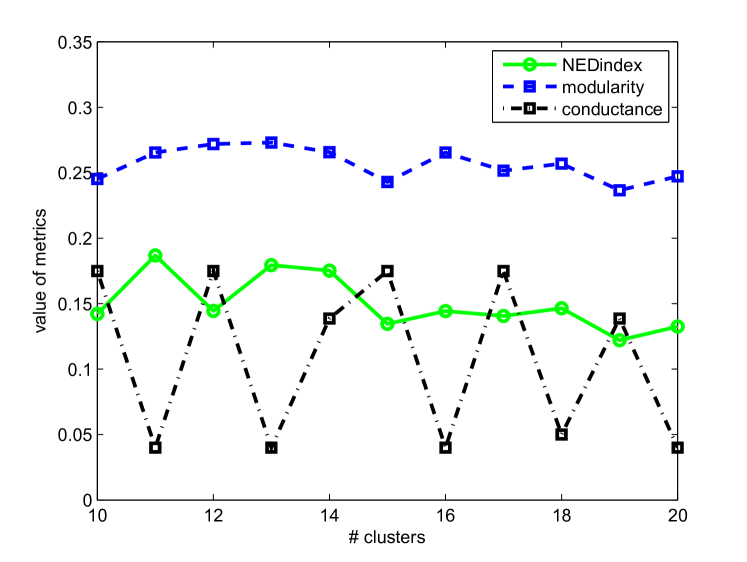
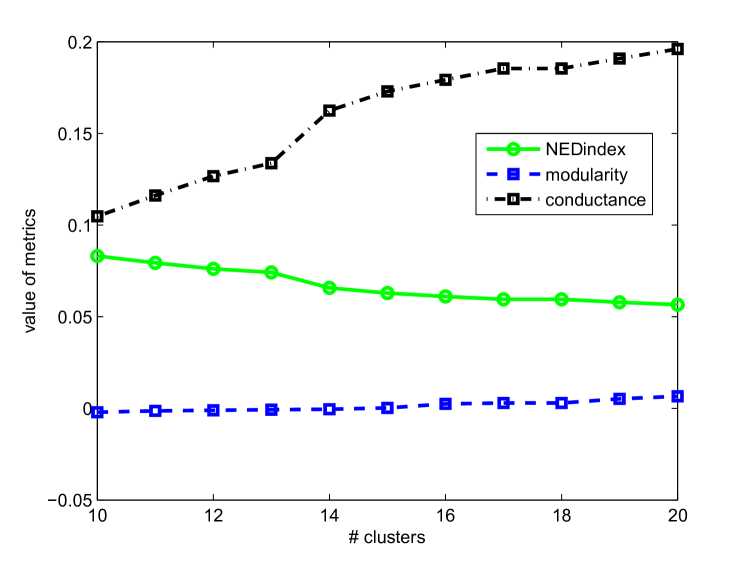
Detecting strongly connected communities in social networks has become an area of interests in graph clustering. A large bodies of research have been carried out in this area. Sometimes, community detection algorithm consider overlapping clusters and sometimes it considers non-overlapping clusters. In [15], authors propose an overlapping community detection technique. In [16], authors show comparative analyses of different methods of community detection algorithms. They also provide extensive discussions on performance metrics (conductance, exxpansion, internal density, cut ratio, modularity ratio, etc). There are several benchmark datasets on social networks specially for large networks in [17]. So, we can easily apply NEDindex metric to any of them to detect strongly connected clusters in large graphs of social networks. We select facebook network (undirected graph) and use NEDindex metric to evaluate the strength of communities. There are 347 nodes and 5038 edges in the selected graph. We vary cluster size from 10 to 20. We measure other metrics as well and report comparative results in Figure 11. For Figure 11, we use k-means clustering algorithm of Matlab language and for Figure 12, we use Algorithm 1. Here (in Figure 11), we see that conductance fluctuates with the changes of cluster size. We also see that our proposed NEDindex shows consistency.
IV-A2 Discovering Sub-network in Gene Regulatory Network
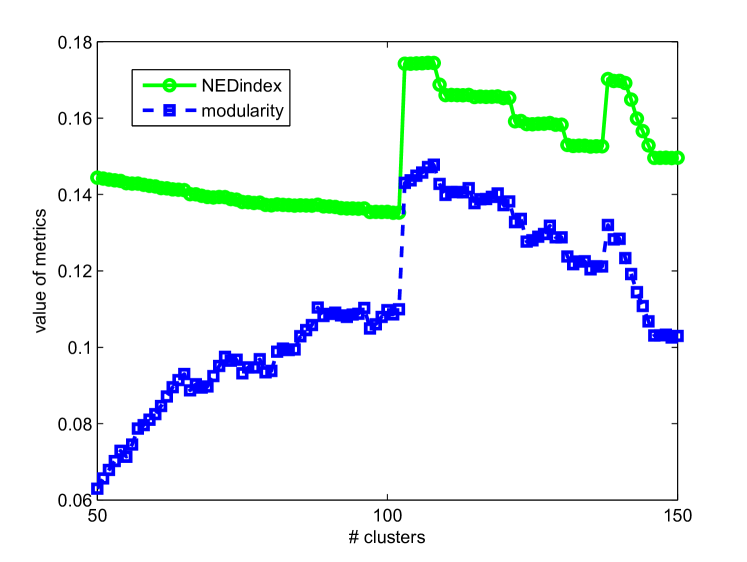
Re-construction of GRN is a highly growing field of applied bioinformatics. There are lots of works in this field where different reverse engineering techniques are used to construct GRN. Sometimes, finding suitable cluster accelerate the progress. Basically, the main task in GRN clustering is to find a sub-network which performs a specific task. It is also possible that overlapping may exist in network i.e., same transcirption factor, regulator or gene may be component of two different sub-networks. In addition, such networks clustering are also used to re-construct GRN. For example, in [18], authors use Bayesian Clustering technique to infer GRN. In GRN, most of the in silico benchmark datasets are found in DREAM challange [19]. To apply NEDindex to evaluate such clustering in GRN, we use a data set of DREAM4 which is found in [20]. In the tested dataset, there are 7115 nodes and 103689 edges. We report the results in Figure 13. In this experiment, we use Algorithm 1 and vary the size of clusters from 50 to 150. We see in Figure 13 that both of the metrics jump when cluster size is close to 105. This is because of the strength in clusters i.e., it shows an improved and strongly connected clustering with all cluster components.
V Conclusion
In this paper, we present NEDindex metric for graph clustering which evaluates the effectiveness of a cluster according to the respective graph. NEDindex has higher value for strongly connected clusters and lower value for weekly connected clusters. We show that our proposed metric can evaluate the effectiveness well and show greater consistency with all kinds of graph clustering 111We show experiments for undirected graphs. We also achieve similar performance for directed graphs.. We also show some comparative results with other popular graph clustering metrics. Finally, we present two successful experiments of NEDindex for real-world applications (community detection in social networks and sub-networks in GRN). In both of the cases, we see that our proposed NEDindex shows consistency with the variations of cluster size. We would like to use NEDindex, as a future development task, for finding exact and strongly connected communities in social networks.
References
- [1] R. M. May and A. L. Lloyd, Infection dynamics on scalefree networks, Phys. Rev. E 64, 066112, 2001.
- [2] S. Redner, How popular is your paper? An empirical study of the citation distribution, Eur. Phys. J. B 4, 131–134, 1998.
- [3] M. E. J. Newman, The structure of scientific collaboration networks, Proc. Natl. Acad. Sci. USA 98, 404–409, 2001.
- [4] H. Jeong, B. Tombor, R. Albert, Z. N. Oltvai, and A.-L. Barabasi, The large-scale organization of metabolic networks, Nature 407, 651–654, 2000.
- [5] R. Albert and A.-L. Barabasi, Statistical mechanics of complex networks, Rev. Mod. Phys. 74, 47–97, 2002.
- [6] M. E. J. Newman and M. Girvan, Finding and evaluating community structure in networks, Physical Review E 69, 026113, 2004.
- [7] J. Scott, Social Network Analysis: A Handbook, Sage Publications, London, 2nd edition, 2000.
- [8] D. J. Watts and S. H. Strogatz, Collective dynamics of ‘small-world’ networks, Nature 393, 440–442, 1998.
- [9] L. A. N. Amaral, A. Scala, M. Barthelemy, and H. E. Stanley, Classes of small-world networks, Proc. Natl. Acad. Sci. USA 97, 11149–11152, 2000.
- [10] M. Marchiori and V. Latora, Harmony in the smallworld, Physica A 285, 539–546, 2000.
- [11] J. M. Anthonisse, The rush in a directed graph, Technical Report BN 9/71, Stichting Mathematicsh Centrum, Amsterdam, 1971.
- [12] L. Freeman, A set of measures of centrality based upon betweenness, Sociometry 40, 35–41, 1977.
- [13] L. Danon, A. Diaz-Guilera, J. Duch and A. Arenas, J. Stat. Mech., P09008, 2005.
- [14] W. W. Zachary, An information flow model for conflict and fission in small groups, Journal of Anthropological Research 33, 452–473, 1977.
- [15] S. Lim, S. Ryu, S. Kwon, K. Jung, and J.-G. Lee, LinkSCAN*: Overlapping Community Detection Using the Link-Space Transformation, In Proceedings of ICDE, 292-303, Chicago, IL, USA, 2014.
- [16] J. Leskovec, K. J. Lang and M. Mahoney, Empirical comparison of algorithms for network community detection, In Proceedings of WWW, 631-640, Raleigh, North Carolina, USA, 2010.
- [17] http://snap.stanford.edu/data/index.html [Last accessed 01:04 AM, 29 July, 2015]
- [18] B. Godsey, Improved Inference of Gene Regulatory Networks through Integrated Bayesian Clustering and Dynamic Modeling of Time-Course Expression Data, PLOS ONE 8(7): e68358, 2013.
- [19] http://dreamchallenges.org/ [Last accessed 02:14 AM, 29 July, 2015]
- [20] https://github.com/briangodsey/bacon-for-gene-networks/tree/master/data/DREAM4 [Last accessed 02:44 AM, 29 July, 2015]