Modeling the time-periodicity of in-degree distributions in scientific citation networks
Abstract
In a range of citation networks, the in-degree distributions boast time-periodicity—the distributions of citations per article published each year present similar scale-free tails. This phenomenon can be regarded as a consequence of the emergence of hot topics and the existence of the “burst” phenomenon. With this inference considered, a geometric model based on our previous study is established, in which the sizes of the influence zones of nodes follow the same power-law distribution and decrease with their ages. The model successfully reproduces the time-periodicity of the in-degree distributions of the empirical data, and accounts for the presence of citation burst as well. Moreover, a reasonable explanation for the emergence of the scale-free tails by regarding the citation behavior between articles as a “yes/no” experiment is presented. The model can also predict the time-periodicity of the local clustering coefficients, which indicates that the model is a good tool in researches on the evolutionary mechanism of citation networks.
Introduction
Articles and their citations can be pictured as a network[1, 2], in which articles are regarded as nodes and a directed edge will be drawn from article to article if cites . Those graphs are acyclic. Since new articles usually only cite the published articles[3], directed loops cannot be obtained in this way.
A growing body of literature on citation networks has focused on the research of the probability distribution of the number of citations per article, i.e. the in-degree distribution. In his articles, Price[1, 2] pointed out the cumulative advantage to explain the scale-free tails of the in-degree distributions of citation networks. He believes that the rate at which an article is cited should be proportional to the citations that it already has. George et al[4] did not only penetrate into the scale-free tails of the in-degree distributions of citation networks but also the forepart behavior and the tipping point between the two different regions via a two-mechanism model. Moreover, Xie et al[5, 6, 7, 8] contributed to the study of in-degree distributions of citation networks by proposing a series of geometric models. The aforementioned studies all serve to reveal the fundamental feature of the in-degree distributions that the majority of articles are rarely cited while few articles are frequently cited. However, some problems remained unanswered: What is the publication time of the highly cited articles? Are there such articles published each year?
| Networks | Nodes | Links | ASP | CC | PG | MO |
|---|---|---|---|---|---|---|
| Science | 36642 | 28460 | 11.3270 | 0.1374 | 0.3855 | 0.9178 |
| Nature | 36787 | 34949 | 10.6000 | 0.1255 | 0.4198 | 0.8916 |
| PNAS | 55358 | 86534 | 9.9328 | 0.1178 | 0.7975 | 0.8706 |
| Modeled network | 60600 | 87053 | 14.5063 | 0.2064 | 0.0701 | 0.9927 |
In fact, highly cited articles emerge each year. A more interesting phenomenon is that the in-degree distributions of citation networks boast time-periodicity—the in-degree distributions of articles published each year in many citation networks boast similar scale-free tails. The overall in-degree distributions of citation networks have been successfully predicted in our previous study[7] in which the citation attractiveness of an article is expressed as a geometric area, whose size is inversely proportional to its birth time. To penetrate into the evolutionary mechanism of citation networks leading to this phenomenon, a new concentric circles model is developed based on the previous model. In the new model, the sizes of the geometric areas of nodes (articles) follow the same power-law distribution. Considering the fact that novelty of an article will eventually wear off, these sizes decrease with the age of nodes. The model serves to reproduce the features of in-degree distributions of articles published each year of the empirical data and accounts for the presence of the citation burst as well. Moreover, in a reasonable interpretation for the emergence of the similar scale-free tails of those distributions, whether one article cites another or not is regarded as a “yes/no” experiment[8]. Besides, we also examine the ability of the model to predict the relation between the local clustering coefficients of articles published each year and their in-degrees.
This article is structured as follows. Some real data are introduced in Section 2. The model is illustrated in Section 3. The time-periodicity of the in-degree distribution and that of the local clustering coefficients are analysed in Section 4 and Section 5. The conclusion is given in the last section.
Data
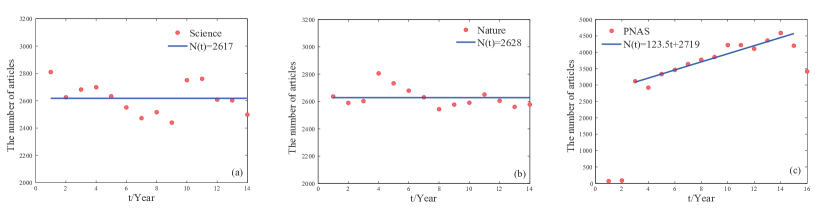
Three empirical networks (Table 1) mined from web of science (http://www.webofscience.com) are analysed in this paper. One of the networks is from Science, including 36642 articles published during 2002-2015. Another network is from Nature, constituting 36787 articles published during 2002-2015. The evolutionary trends of the number of articles published each year in these two citation networks are approximately constant (Figure 1a,1b). The last citation network derived from Proceeding of the National Academy of Science of the United States of America (PNAS) covers 55358 articles from January 2000 to November 2015. An increase is palpable in the changing trend of the number of articles published each year, which increases in an approximately linear fashion (Figure 1c), despite the numbers of articles published in 2000, 2001 and 2015 deviate from the fitting curve due to the absence of articles in the data source.
Since some properties of the articles published later in the empirical data have not evolved completely, the study of the properties of these articles is bypassed. And those articles with palpable properties are highlighted.
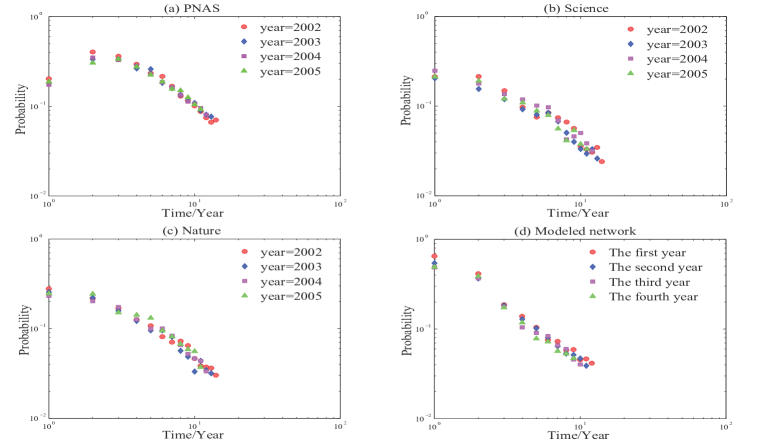
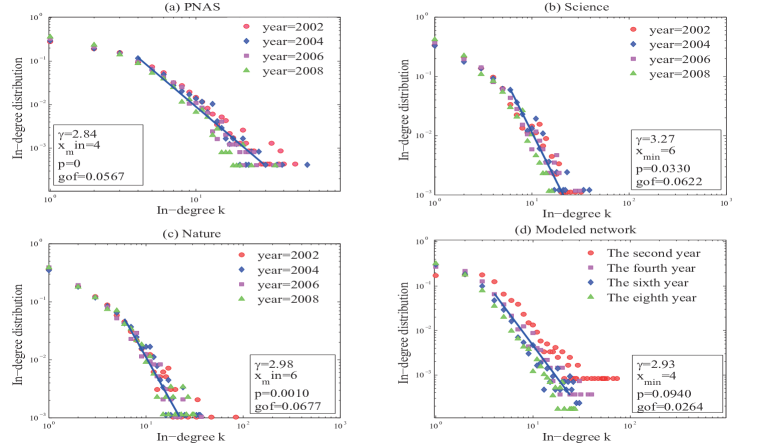
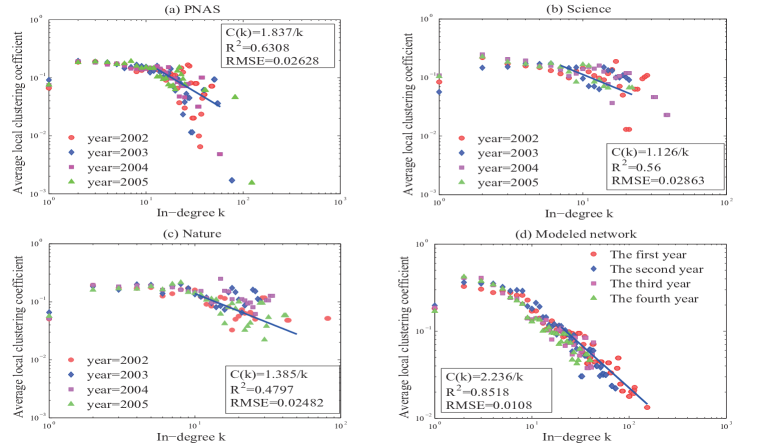
The probability that articles published in one year receive citations from ones published in another year is calculated to evaluate the rate of citations that articles published in one year can get. It shows that articles in these three citation networks are highly likely to have received citations within a few years since their publication while beyond this period the likelihood decreases (Figure 2a,2b,2c), which demonstrates the existence of the “burst” phenomenon. Meanwhile, a comparison of the in-degree distributions of articles published in 2002, 2004, 2006 and 2008 has been drawn. Surprisingly, it (Figure 4a,4b,4c) turns out that the in-degree distributions in the empirical data are periodic in the time dimension—the in-degree distributions of articles published each year boast the similar scale-free tails. It means that there are highly cited articles each year. The local clustering coefficients of articles in these empirical data also boast the time-periodic property (Figure 5a,5b,5c)—the large in-degree articles published each year have low local clustering coefficients while they are higher for small ones.
Model
The scale-free property of the in-degree distributions of citation networks is usually interpreted as a consequence of the preferential attachment in substantial previous studies. Nevertheless, in those models only based on the preferential attachment (or cumulative advantage), e.g. the Price model, the nodes with large in-degree are always born early[9], which runs counter to the case that there exist highly cited articles each year. The same problem also exists in our previous study[7]. As a result, it is necessary to identify a new mechanism to illuminate why the in-degree distributions of articles published each year in the empirical data have similar scale-free tails. Acoordingly, based on two points of cognition, a promotion of the model we have built[7] is completed:
A) The citation attractiveness of an article is an outward manifestation of its novelty, importance and readability[9, 10, 11]. If an article is more attractive, more valuable, it will receive more citations. In Ref[3], Eom et al give the node (article) a value to represent its citation attractiveness. In this paper, the attractiveness of a node is expressed as a geometric area with the node at center. Since there are highly cited articles each year, the sizes of the influence zones of nodes in the model follow the same power-law distribution.
B) The “burst” phenomenon shows that the attractiveness of an article wears off eventually[11, 12, 13, 14]. Therefore, the influence zones of nodes in the model shrink with the passage of time.
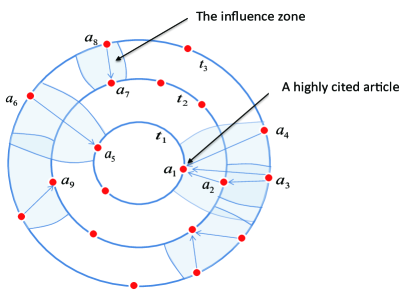
Combining A and B, an illustration of the model is shown in Figure 3, and the generating process is listed as follows.
-
1.
Generate a new circle with radius () centered at point at each time , sprinkle nodes (articles) on it randomly and uniformly, and fix nodes with their coordinates, e.g. node with .
-
2.
For each node with coordinate , the influence zone of the node is defined as an interval of angular coordinate with center and arc-length , where , , is the current time, and is an integer randomly selected from ( is an integer), which corresponds to the node one to one .
-
3.
For node and node , if the distance of angular coordinates and , a directed edge is drawn from to under a probability .
Aside from cognition A and B, there are some intuitive explanations for the formula of zonal sizes. Firstly, if the contents of two highly cited articles are concerned with the same hot topics, the cumulative advantage generally would make the older one get more citations. So is set to be inversely proportional to . Secondly, it is easy to understand that different articles have different citation attractiveness, so is adopted into the formula. At last, aging of the citation attractiveness of articles occurs so that the probability of an article receiving citations decreases with its ages, Therefore, the formula is a decreasing function of the node’s age , and the parameter is used to tune the rate at which the formula decreases with . In addition, the exponents of in-degree distributions of many networks generated by some existing models are fixed[15], which is inconsistent with the fact that the exponents vary from data to data. So the parameter is employed to tune the exponent of the modeled in-degree distributions in the formula of zonal sizes.
Copying citations is considered as a reasonable interpretation for why citation networks have a non-zero global clustering coefficient[17]. The global clustering coefficients in the empirical data are often lower than those predicted by the complete copying, which can be interpreted as a consequence of the aging of the citation attractiveness of an article (older articles hardly get citations). So incomplete copying is more realistic[17, 18, 19]. In this paper, the model adopts the parameter to avoid complete copying and simultaneously considers aging of articles (expressed by the sizes of the influence zones of articles which shrink with the passage of time).
A modeled network (Table 1) is generated to test validity of the model to reproduce the properties of PNAS (the fitting function of the annual number of articles in which is ). To make the scale consistent with the empirical data, we set and . Moreover, time units is regarded as one year so that the time span of the modeled network is nearly equal to 12 “years”, which is approximate to that of the empirical data. Furthermore, we set other parameters to make the modeled average degree similar to that of the empirical data.
Simulations (Figure 4d) show that the in-degree distributions of articles published each year in the modeled network have similar scale-free tails, which result from the similar inhomogeneous citation attractiveness of articles published each year in the modeled network. Moreover, the“burst” phenomenon exists in this network (Figure 2d), as a result of aging of the citation attractiveness. In addition, the local clustering coefficient of the modeled network is time-periodic—the tails of the average local clustering coefficients of nodes with in-degree published each year are roughly proportional to (Figure 5d).
Time-periodicity of the in-degree distribution
The validity of the model (Figure 4d) in reproducing the time-periodicity of the in-degree distribution in the empirical data convincingly indicates that the existence of the “burst” phenomenon and the emergence of hot topics are behind it. The emergence of hot topics each year results in the similarity of the in-degree distributions in the empirical data. The existence of the “burst” phenomenon increases articles finite, which ensures the scale-free tails of the in-degree distributions. Accordingly, a further explanation is presented to show why the tails of these distributions are scale-free by analysing and simulating the evolutionary mechanism of citation networks.
The event that whether one article cites another can be regarded as a “yes/no” experiment. So the number of citations an article gets is the number of successes in a sequence of experiments, where is the number of articles which are likely to cite this article.
The probability of “yes” is approximated through its expected value , and those “yes/no” experiments are supposed to be independent. Subsequently, the number of citations articles get follows a binomial distribution . When is large and is small, can be approximated by a Poisson distribution with mean (Poisson limit theorem).
Since the process of sprinkling nodes in our model follows a Poisson point process, the number of nodes located in one influence zone is a random variable drawn from a Poisson distribution with an expected value in proportion to the zonal size, which is different from that of others’. In addition, the “yes/no” experiments could be affected by previous occurrences. For example, articles tend to cite the articles written by distinguished authors.
Therefore, we should make an approximation. As for articles with large influence zones, the numbers of their potential citers are large enough to suppose that the “yes/no” experiments are independent. And the numbers of the citations of these articles could be considered as random variables drawn from a range of Poisson distributions with sufficiently large means. A “fat” tail appears when those Poisson distributions are averaged (Eq (A) in Appendix).
In the empirical data, since the highly cited articles are generally considered to be of great citation attractiveness, the behaviors that highly cited articles get citations can be regarded as mutually independent. As a result, the tails of the in-degree distributions of articles published each year are scale-free. It shows that the emergence of scale-free tails partly stems from many Poisson processes, consequently from many “yes/no” experiments.
Time-periodicity of the local clustering coefficient
The local clustering coefficient (LCC) is tantamount to the probability that two vertices, both neighbors of the third vertex, will be the neighbors of one another. In the empirical data, the articles published each year exhibit similar feature that the large in-degree articles have low LCCs while the small in-degree ones have high LCCs. Such time-periodicity of LCC can be interpreted as a consequence of the time-periodicity of the in-degree distribution. There are both small in-degree articles and large in-degree articles each year. The small in-degree articles tend to quote the discussion of some highly cited articles in their research fields to enhance the reliability of their points of view. The later articles that cite those small in-degree articles also tend to cite these highly cited articles. So two articles, both neighbors of a small in-degree article, are very likely to be the neighbors of one another. On the contrary, the large in-degree articles attract considerate attention of the small in-degree articles, and these large in-degree articles may not cite each other even if they cite a common article. So the LCCs of the large in-degree articles are low.
Conclusion
We have looked at the citation dynamics of some real networks. The fact that the in-degree distributions of articles published each year in these networks present similar scale-free tails, leads to the conclusion that their in-degree distributions are time-periodic. The emergence of hot topics and the existence of the “burst” phenomenon are cogent reasons behind the generation of time-periodicity of the in-degree distribution. With these two reasons synthetically considered, a geometric model based on our previous study is developed. The model boasts two new features: 1) the sizes of the influence zones of nodes follow the same power-law distribution; 2) the sizes of the influence zones of nodes decrease with the passage of time. The model manages to reproduce the time-periodicity of the in-degree distribution and that of the local clustering coefficient of the empirical data, and accounts for the presence of citation burst as well. Moreover, a sound explanation is presented for the emergence of the scale-free tails of the in-degree distributions of articles published each year by regarding the citation behavior as a “yes/no” experiment. However, some defects of this model have yet to be overcome in future work, including how to identify the coordinates of articles, when the real citation networks are mapped onto the geometric space, and how to design a more realistic strategy for articles to get citations rather than the random and uniform selection strategy employed in the present context.
References
References
- [1] Price D S. Networks of scientific papers[J]. Science, 1965, 149(3683): 510-515.
- [2] Price D S. A general theory of bibliometric and other cumulative advantage processes[J]. Journal of the American society for Information science, 1976, 27(5): 292-306.
- [3] Eom Y H, Fortunato S. Characterizing and modeling citation dynamics[J]. PloS one, 2011, 6(9): e24926.
- [4] Peterson G J, Press S, Dill K A. Nonuniversal power law scaling in the probability distribution of scientific citations[J]. Proceedings of the National Academy of Sciences, 2010, 107(37): 16023-16027.
- [5] Xie Z, Ouyang Z, Liu Q, et al. A geometric graph model for citation networks of exponentially growing scientific papers[J]. Physica A: Statistical Mechanics and its Applications, 2016, 456: 167-175.
- [6] Xie Z, Ouyang Z, Zhang P, et al. Modeling the citation network by network cosmology[J]. PloS one, 2015, 10(3): e0120687.
- [7] Liu Q, Xie Z, Dong E, et al. Geometric modeling for citation networks with linearly growing scientific paper increment[J]. arXiv preprint arXiv:1605.00826, 2016.
- [8] Xie Z, Dong E, Yi D, et al. Modelling tipping-point phenomena of scientific coauthorship networks[J]. arXiv preprint arXiv:1604.08891, 2016.
- [9] Bianconi G, Barab si A L. Competition and multiscaling in evolving networks[J]. EPL (Europhysics Letters), 2001, 54(4): 436.
- [10] Caldarelli G, Capocci A, De Los Rios P, et al. Scale-free networks from varying vertex intrinsic fitness[J]. Physical review letters, 2002, 89(25): 258702.
- [11] Wang D, Song C, Barab si A L. Quantifying long-term scientific impact[J]. Science, 2013, 342(6154): 127-132.
- [12] Wang M, Yu G, Yu D. Measuring the preferential attachment mechanism in citation networks[J]. Physica A: Statistical Mechanics and its Applications, 2008, 387(18): 4692-4698.
- [13] Hajra K B, Sen P. Phase transitions in an aging network[J]. Physical Review E, 2004, 70(5): 056103.
- [14] Hajra K B, Sen P. Aging in citation networks[J]. Physica A: Statistical Mechanics and its Applications, 2005, 346(1): 44-48.
- [15] Barab si A L, Albert R. Emergence of scaling in random networks[J]. science, 1999, 286(5439): 509-512.
- [16] Clauset A, Shalizi C R, Newman M E J. Power-law distributions in empirical data[J]. SIAM review, 2009, 51(4): 661-703.
- [17] Xie Z, Ouyang Z, Liu Q, et al. A geometric graph model for citation networks of exponentially growing scientific papers[J]. Physica A: Statistical Mechanics and its Applications, 2016, 456: 167-175.
- [18] Wu Z X, Holme P. Modeling scientific-citation patterns and other triangle-rich acyclic networks[J]. Physical review E, 2009, 80(3): 037101.
- [19] Goldberg S R, Anthony H, Evans T S. Modelling citation networks[J]. Scientometrics, 2015, 105(3): 1577-1604.
- [20] Krioukov D, Kitsak M, Sinkovits R S, et al. Network cosmology[J]. Scientific reports, 2012, 2.
- [21] Cevher V, Guerra R, Bower B, et al. Laplace Approximation Thursday, September 11, 2008[J].
- [22] Marsaglia G, Marsaglia J C W. A New Derivation of Stirling’s Approximation to n![J]. American Mathematical Monthly, 1990: 826-829.
Appendix A
The edges in this model are linked according to Step 3. Then the expected in-degree of node with coordinate is
| (1) |
The process of sprinkling nodes in the suppositional year follows Poisson process, so the actual in-degree of the nodes born in this year are not exactly equal to the expected degree. As Ref [6, 20] said, we have to average the Poisson distribution,
| (2) |
which is the probability that the in-degree of node is , with the temporal density in a suppositional year. Since a suppositional year contains units, the in-degree distribution of the nodes born in a “year” from to is
| (3) |
where , , and is the gamma function. Here, we have used the Laplace approximation[21] and the Stirling’s approximation[22] in the last two steps. Moreover, it can be proved that the integral term of is approximately independent of . The process is as follows:
| (4) |
when the in-degree or is big enough, the integration is approximately equal to a constant. Therefore, the in-degree distributions of the nodes born at each suppositional year have fat tails with exponent .
Appendix B
Suppose is a highly cited article. Article and article are the new published articles which are the neighbors of article . If has coordinate , we make a reasonable assumption that the overlap of the influence zones of and in circle ( is the current time) is approximate because of the small and large . Particularly, if the connection probability , the probability that article is the common neighbor of article and article is approximately equal to . So for the general connection probability , the conditional probability . Summing over possible values of , we find
| (5) |
where denotes the number of the articles in the influence zone of article at time , is a constant depending on and is the average of of all the possible node .
Since article is a highly cited article, the articles citing dominate the neighbors of and the effect of those articles cited by could be ignored. The expected in-degree of the highly cited article is Eq (1). Substituting it into Eq (5), we get
| (6) |
which is inversely proportional to the in-degree of article .