The Gould’s Belt Distances Survey (GOBELINS) III.
The distance to the Serpens/Aquila Molecular Complex
Abstract
We report on new distances and proper motions to seven stars across the Serpens/Aquila complex. The observations were obtained as part of the Gould’s Belt Distances Survey (GOBELINS) project between September 2013 and April 2016 with the Very Long Baseline Array (VLBA). One of our targets is the proto-Herbig AeBe object EC 95, which is a binary system embedded in the Serpens Core. For this system, we combined the GOBELINS observations with previous VLBA data to cover a total period of 8 years, and derive the orbital elements and an updated source distance. The individual distances to sources in the complex are fully consistent with each other, and the mean value corresponds to a distance of pc for the Serpens/W40 complex. Given this new evidence, we argue that Serpens Main, W40 and Serpens South are physically associated and form a single cloud structure.
=1 \fullcollaborationNameThe Friends of AASTeX Collaboration
1 Introduction
The Serpens molecular cloud is a region rich in low-mass star formation selected for observations as part of the Gould’s Belt Distances Survey (GOBELINS; Ortiz-León et al. 2016). There are two smaller regions, of deg2 in size, associated with this cloud: Serpens Main and Serpens South. Serpens Main (centered on R.A. , Dec. ; Eiroa et al., 2008) consists of three prominent sub-regions; namely the Serpens core, Serpens G3-G6 and VV Serpentis. Its northernmost sub-region is the Serpens core (also called Serpens North or Cluster A; Harvey et al., 2006), a cluster of YSOs deeply embedded with extinction exceeding 40 mag in the visual. This sub-region has numerous observations from X-rays to the submillimeter that have revealed a large population of protostars (e.g., Kaas et al., 2004; Eiroa et al., 2005; Harvey et al., 2006, 2007; Winston et al., 2007, 2009; Oliveira et al., 2010). Serpens G3-G6 Cohen & Kuhi (1979), also referred to as Cluster B, was identified by Harvey et al. (2006) as a cluster of star formation harboring many previously unknown young stellar objects (YSOs). Finally, VV Serpentis is the southernmost sub-region associated to the eponymous star. Presently, the most extensive study of the young stellar population in Serpens Main was conducted by the Spitzer Legacy Program “From Molecular Cores to Planet-Forming Disks” (c2d; Evans et al., 2003), where more than two hundred Class 0 to Class III YSOs associated with IR excess were identified in an area of 0.85 deg2 (Dunham et al., 2015). Serpens South (centered on R.A. , Dec. , i.e. at an angular distance of to the south of Serpens Main) was discovered by Gutermuth et al. (2008). Since then, it has received a lot of attention because of the large number of extremely young objects that it contains. It shows an unusually large fraction of protostars (Gutermuth et al., 2008), presenting an excellent laboratory to study the earliest stages of star formation.
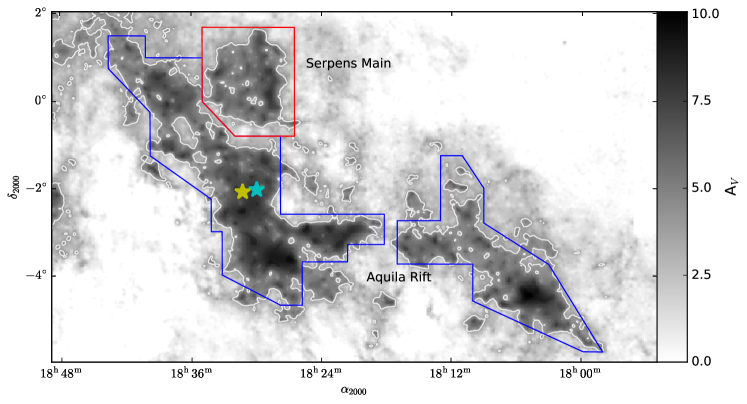
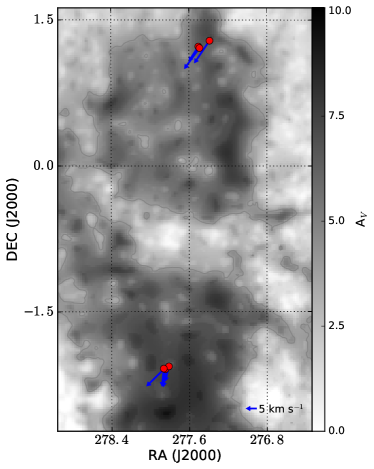
To the east of Serpens South, at R.A. , Dec. , lies the W40 complex, named after the H II region, also known as Sharpless 2-64 (Smith et al., 1985; Vallee, 1987). This complex shows evidence for ongoing star formation, since it contains dense molecular cores (Dobashi et al., 2005), millimeter-wave sources (Molinari et al., 1996; Maury et al., 2011), and YSOs (Kuhn et al., 2010; Rodríguez et al., 2010; Mallick et al., 2013). There is also a cluster of massive stars which ionizes the H II region (Smith et al., 1985; Shuping et al., 2012). Both Serpens South and W40 belong to a larger complex of molecular clouds collectively known as the Aquila Rift, a large elongated feature seen in 2MASS extinction maps (Bontemps et al., 2010). The Aquila Rift was one of the clouds targeted by the Herschel (André et al., 2010; Könyves et al., 2015) and Spitzer (Dunham et al., 2015) Gould Belt Surveys, which revealed hundreds of YSOs all across the complex. Figure 1 shows the location of the Serpens Main region, as well as the position of W40 and Serpens South within the Aquila Complex. We note that, although Serpens and the Aquila Rift do not formally belong to the Gould’s Belt, they are usually included in Gould Belt Surveys because of their star-formation activity, and because they were previously thought to be closer to the Sun.
1.1 The distance to the clouds in Serpens/Aquila
The distances to the different regions in the Serpens/Aquila Complex have been a matter of controversy. For Serpens Main, there is an ample range of distances reported in the literature, from pc (Chavarria-K. et al., 1988) to pc (Zhang et al., 1988). Most of these estimates are indirect, since they are often based on spectroscopic parallaxes and extinction measurements. Winston et al. (2010) constructed the X-ray luminosity function of the Serpens cluster using different distances to calculate the X-ray luminosity, and fitted the data with the distribution determined by Feigelson & Getman (2005) for Orion, IC 348 and NGC 1333. The best fit to the data was found to be at a distance to Serpens of pc. The only direct measurement of the distance to Serpens Main has been obtained by Dzib et al. (2010) and Dzib et al. (2011) from Very Long Baseline Interferometry (VLBI) trigonometric parallax of the YSO EC 95 associated with the Serpens Core. These authors derived a distance to the Serpens Core of pc and a mean distance to the Serpens cloud of pc. Later, they updated the distance to the Core to pc. However, the usually adopted distance for Serpens Main and the Aquila Rift as well is pc, which was derived by Straižys et al. (1996) from photometry of optically visible stars, of which belong to Serpens Main. In a more recent paper, Straižys et al. (2003) used 80 stars from their original sample, as well as 400 other stars, to measure the distance to the front edge of the dark clouds (the extinction wall) in the Serpens/Aquila complex. They placed this wall at pc, and suggested that the cloud is about 80 pc deep.
As we mentioned earlier, W40 and Serpens South are embedded within the Aquila Rift. Estimates of the distance to W40 seem to favor values between 455 and 600 pc (Kolesnik & Iurevich, 1983; Shuping et al., 2012), which suggests this cloud lies somewhat further away than the extinction wall of the Aquila Rift. So far, there are no distance measurements to sources in Serpens South, but many authors argue that the region is at the same distance as Serpens Main, and adopt either 260 or 429 pc (e.g., Gutermuth et al., 2008; Maury et al., 2011; Plunkett et al., 2015; Kern et al., 2016; Heiderman & Evans, 2015). It has also been argued that W40 and Serpens South belong to the same continuous extinction feature and should be part of the same complex, likely at the same distance (Maury et al., 2011).
In this paper, we report on the distance to 3 stars in the Serpens cloud core and 4 objects in the W40 cluster. The observations were obtained as part of the GOBELINS project (Ortiz-León et al. 2016) with the Very Long Baseline Array (VLBA). We describe our targets and observations in Section 2. The astrometry of our sources is given in Section 3. Finally, we discuss our findings in Section 4 and provide a summary in Section 5.
2 Target selection and Observations
While both thermal and non-thermal processes produce radio emission in young stars, only brightness temperatures K will be detectable on VLBI baselines (Thompson et al., 2007), which limits VLBI observations to non-thermal radiation. Thus, our targets consist of young stars with potentially non-thermal radio emission. This kind of emission is expected to be produced in the coronae of magnetically active stars by energetic electrons gyrating around the magnetic field lines (Feigelson & Montmerle, 1999).
In Ortiz-León et al. (2015), we reported on deep radio observations carried out with the Karl Jansky Very Large Array (VLA) of three of the most prominent regions in the Serpens/Aquila Complex, namely, the Serpens Core, W40 and Serpens South. A total of 18 possible targets (known or candidate YSOs) for VLBA astrometry were identified across these three regions, based on their compactness, negative spectral index and/or variability. The VLBA was pointed at the positions of the 18 candidates, however we also correlated (i.e., changed the phase center of the correlation) at the positions of other sources which lay in the primary beam of the individual VLBA telescopes (of in size at 5 GHz). This provided an additional 63 sources, of which 3 turned out to be YSOs with detectable non-thermal radio emission.
We refer the reader to Ortiz-León et al. (2016) for a detailed description of our observing approach. Briefly, the VLBA observations of GOBELINS were taken between 2013 September and 2016 April at 4.9 or 8.3 GHz (C- and X-band, respectively). The data were recorded in dual polarization mode with 256 MHz of bandwidth in each polarization, covered by 8 separate 32-MHz intermediate frequency (IF) channels. VLBA project codes, observing dates, pointing positions, and corresponding observing bands are given in Table 1. Several sets of phase calibrators were chosen according to their angular separations relative to target positions and used for multi-source phase referencing. The corresponding sets of calibrators for each pointing position (target) are listed in Table 2. One or two targets were observed in each observing session. These consisted of cycles alternating between the target(s) and the main phase calibrator: target — calibrator for single-target sessions, and target 1 — calibrator — target 2 — calibrator for those sessions where two targets were observed simultaneously. The secondary calibrators were observed every minutes. The total integration time for each target was hours in projects that observed at 8.3 GHz, and hour at 4.9 GHz. Geodetic-like blocks, consisting of observations of many calibrators over a wide range of elevations, were taken before and after each session. These were observed with 512 MHz total bandwidth covered by 16 IFs and centered at 4.6 and 8.1 GHz for projects observing at C- and X-band, respectively.
Data reduction was performed using AIPS (Greisen, 2003), following the strategy described in Ortiz-León et al. (2016). Calibrated visibilities were imaged using a pixel size of 50–100 as and pure natural weighting. Typical angular resolutions were 4 mas 2 mas ( AU at a distance of 429 pc) at 4.9 GHz and 3 mas 0.9 mas ( AU) at 8.3 GHz. Noise levels were typically 30 and at C- and X-band, respectively.
In addition, we will use of data from VLBA projects BL155 and BL160 (P.I.: L. Loinard) and BD155 (P.I.: S. Dzib) which were designed to only observe the source EC 95 between 2007, December and 2016, January at GHz. The images corresponding to these old observations have noise levels of .
3 Results
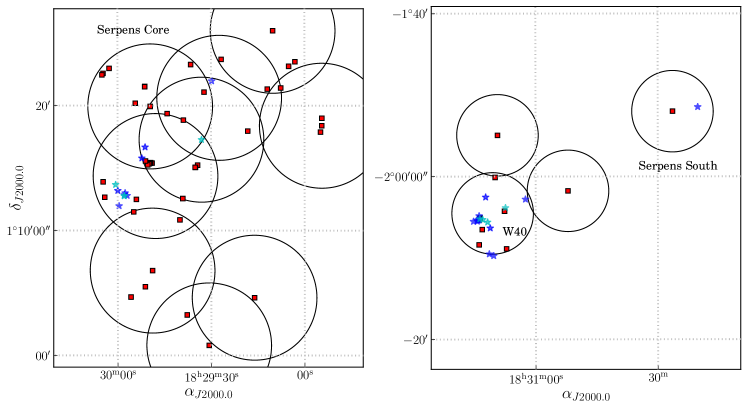
As mentioned earlier, we observed a total of 81 sources in the Serpens/Aquila region. Their spatial distribution is shown in Figure 2, while source VLA coordinates, names, source types, fluxes and brightness temperatures, , are given in the first eight columns in Table 3. Out of the total observed sources, 30 have been firmly detected. These are sources detected in several epochs, with at least one detection at , or sources detected just in one epoch but at , where is the rms noise measured in the images. All sources show K, consistent with the brightness temperature expected for non-thermal emission.
3.1 Individual distances: Single stars
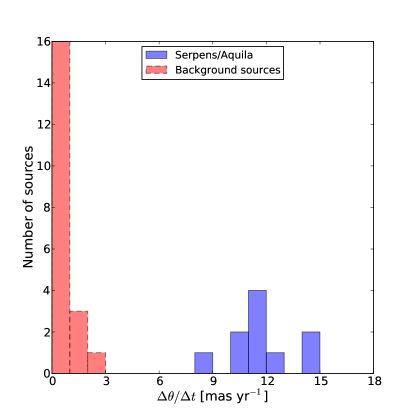
Source positions at individual epochs were extracted by performing two-dimensional Gaussian fits with the AIPS task JMFIT. These and the associated uncertainties provided by JMFIT, which are based on the expected theoretical astrometric precision of an interferometer (Condon, 1997), are listed in Table 7. We analyze the motion of all objects detected in at least 2 epochs. A total of 20 objects, which do not have a firm classification in the literature, show a motion consistent with that expected for background sources, i.e., their positions remain systematically unchanged within the positional errors, or even if they move, their derived parallaxes correspond to distances larger than 1 kpc. This can be seen grapically in Figure 3. The horizontal axis of this plot corresponds to the position change rate in milli-arcseconds (mas) per year, which we define as the shift in position between consecutive epochs, normalized to one year, and averaged over all consecutive pairs of epochs. The 20 unclassified objects have position change rates below 3 mas yr-1, while objects that belong to Serpens or W40 clearly show larger values because of the significant contribution of their parallax and proper motion. We identify these 20 objects as background sources and give a “B” flag in Column 3 of Table 3. Note that not all these sources are necessarily extragalactic. Some might be Galactic objects located behind the Serpens/Aquila complex. For example, the fit to the positions of the source PMN 1829+0101 yields a distance of kpc (Section 3.3). The large number of background sources detected here with the VLBA is not surprising. Oliveira et al. (2009) determined that of the YSO candidates with IR excess in the Serpens/Aquila complex are actually background giants. As stated by these authors, this is consistent with the location of the regions being close to the Galactic plane.
Only 8 VLBA-detected objects are previously known YSOs, and one more object is a B1V star. Out of these 9 objects, two are resolved into double components in the GOBELINS data, while 7 are single stars. This gives a total of 11 individual objects. The astrometry of 5 single stars is given in the present section; the other two single objects will be presented in a later paper because they were not detected often enough to do astrometric fits. The two binaries are discussed in Section 3.2.
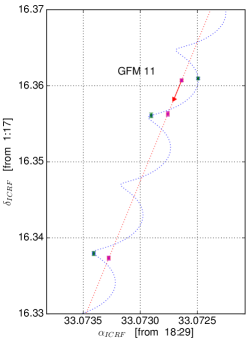
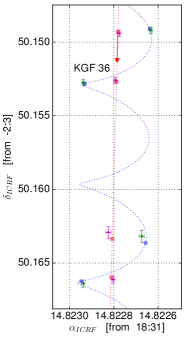
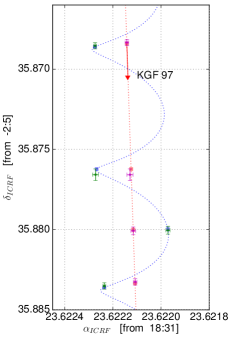
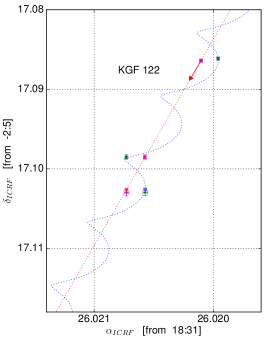
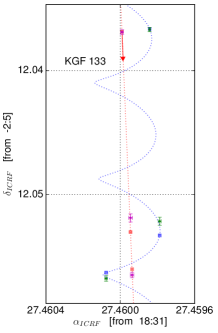
Parallax, , position at median epoch, , and proper motions , and are derived by fitting the equations
| (1) |
| (2) |
to the measured positions and minimizing separately and along the right ascension and declination directions, respectively. Here, and are the projections of the parallactic ellipse over and , respectively. The values of the parallax determined in right ascension () and declination () were then weighted-averaged to produce a single parallax value. The fit is then repeated to solve for the remaining parameters while holding the best fit parallax solution constant. We show the resulting best fits in Figure 4, and summarize the derived astrometric parameters in Table 5. Errors in the model parameters depend on the positional uncertainties of all the individual detections as measured by JMFIT. However, systematic offsets in positions could be introduced by errors in station coordinates, Earth rotation parameters, reference source coordinates, and tropospheric zenith delays (Pradel et al., 2006). When data from many epochs are available, these systematic offsets can be estimated by scaling the positional errors provided by JMFIT until the reduced of the fit becomes equal to 1 (e.g., Menten et al., 2007). Here we are not able to apply this approach given that we have typically 3–4 epochs available for each source. We thus estimate systematic errors by using the empirical relations found by Pradel et al. (2006), according to which the VLBA astrometric accuracy scales linearly with the target to reference source angular separation. We obtain mas and mas by extrapolating the astrometric errors given in Tables 3 and 4 in Pradel et al. (2006) for a source at a declination of (the range in errors corresponds to the different source to calibrator angular separations). In order to estimate the offsets introduced by ionospheric phase delays, we follow the approach outlined in Kounkel et. al. (2016, submitted). Source positions were referenced to a secondary phase calibrator by adding offsets such that the position of this secondary calibrator remains fixed in all epochs. We repeat the astrometric fits to the re-referenced target positions obtaining a different solution to that derived when all positions are referenced to the main phase calibrator. We take the difference in the distance solutions divided by the angular separation between the two phase calibrators as the phase gradient across the sky introduced by ionospheric delays. On average, this yields additional systematic offsets of mas and mas in declination. In total, systematic errors of mas and mas were added quadratically to the statistical errors provided by JMFIT at each individual epoch and used in the last iteration of the fits.
We discuss separately the properties of these objects in the following sections. Sources names come from the X-ray surveys by Giardino et al. (2007, GFM) and Kuhn et al. (2010, KGF).
3.1.1 GFM 11 = GBS-VLA J182933.07+011716.3
GFM 11 is a Class III YSO (Giardino et al., 2007). Its spectral type remains somewhat uncertain: between G2.5 (Winston et al., 2010) and K0 (Erickson et al., 2015). The source has a spectral index111From VLA measurements published in Ortiz-León et al. (2015). The spectral index was taken between 4.5 and 7.5 GHz. of , and shows high levels of variability in both VLA (; Ortiz-León et al., 2015) and VLBA observations. Based on optical spectroscopy, Erickson et al. (2015) estimated a mass of for the source.
3.1.2 KGF 36 = GBS-VLA J183114.82-020350.1
This source, identified as a main sequence star of B1 spectral type by Shuping et al. (2012), is located in the W40 cluster. Its radio flux as measured by the VLA shows variations of on time scales of months at 4.5 GHz, and it has a spectral index of . Shuping et al. (2012) also suggested that KGF 36 is probably a binary source due to the presence of strong He I 1.083 m absorption in the star spectra. However, our VLBA observations have detected a single source with no sign of a close companion in the parallax fit. Non-thermal emission has been confirmed in other early-type B stars. The source S1 in Ophiuchus (Andre et al., 1988) is perhaps the most documented case. Kuhn et al. (2010) derived a photometric mass of from a color–magnitude J vs. J–H diagram assuming distance of 600 pc and age of 1 Myr.
3.1.3 KGF 97 = GBS-VLA J183123.62-020535.8
KGF 97, whose spectral type is unknown, is also a YSO also located in the W40 cluster. Since the source does not show excess in the infrared -Band, it is classified as a Class III object, with a mass of (Kuhn et al., 2010, reduced by a factor of given a distance of 436 pc). The source is found to be very variable in our VLBA observations by a factor . Additionally, it is one of the few sources of the cluster detected in circular polarization (Ortiz-León et al., 2015), a strong signature of gyrosynchrotron radiation. The spectral index is .
3.1.4 KGF 122 = GBS-VLA J183126.02-020517.0
This source was classified as a low-mass Class II YSO by Shuping et al. (2012) based on the analysis of infrared data. It shows high flux variations in both VLA ( at 4.5 GHz) and VLBA observations, and has a negative spectral index of . Kuhn et al. (2010) estimated a photometric mass of for the source, and a bolometric luminosity of , assuming 600 pc as the distance to the cluster (a lower distance of 436 pc reduces the luminosity and mass by a factor of ). Thus, the source may be associated to an early-type source. We discard the last measured source position for the derivation of the astrometric parameters because it significantly deteriorates the quality of the fit and, since we ignore the source of any positional error that may be introduced in this particular epoch, we cannot correct the source position.
3.1.5 KGF 133 = GBS-VLA J183127.45-020512.0
KGF 133 was identified as a Class II/III YSO by Mallick et al. (2013) based on Spitzer and near-IR data. Like the rest of the VLBA-detected YSOs, the source is very variable in radio, with fluctuations of at 4.5 GHz (Ortiz-León et al., 2015). The spectral index of the source is . The mass of the source is not yet well constrained. Kuhn et al. (2010) derived a photometric mass of (reduced to for a distance of 436 pc), but the associated error is uncertain and not provided by these authors.
3.2 Multiple systems
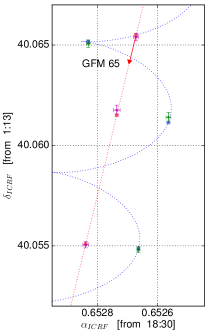
3.2.1 GFM 65 = GBS-VLA J183000.65+011340.0
This source is a M0.5, star (Winston et al., 2010) located in the Serpens Core. It was classified as a Class III object by Giardino et al. (2007). Based on multi-epoch VLA observations, Ortiz-León et al. (2015) found that the source shows large flux variations () on time scales of months, and measured a spectral index of . Both properties of the radio emission are fully consistent with its non-thermal nature. Because of this variability, the source has been detected with the VLBA just in 3 of the 6 observed epochs. Another source, possible a gravitationally bound companion, was detecetd in two epochs separated by 5 mas from the primary. We are not able to constrain the orbit of the system using our present small number of detections. We perform the parallax fit for only one component following the procedure described in Section 3.1.
3.2.2 EC 95 = GBS-VLA J182957.89+011246.0
EC 95 is located in the Serpens core. The system is formed by two close components first observed by Dzib et al. (2010). Early estimations of its spectral type (K2 star), age ( yr) and mass (4 M⊙) indicated that the source is a proto-Herbig AeBe star (Preibisch, 1999). Dzib et al. (2011) reported observations from 11 epochs taken with the VLBA at 8 GHz and reported a distance to the source of pc. Earlier, Dzib et al. (2010) performed a circular Keplerian orbit fit to the data from 8 of these 11 epochs, constraining the orbital period of the system to years.
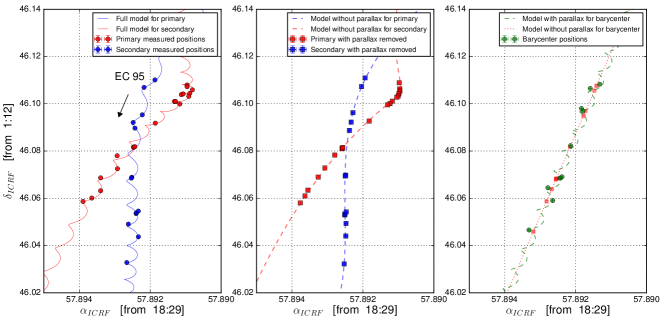
In order to derive the full orbital parameters of EC 95, we carried out follow-up VLBA observations as part of the project coded BD155, which observed the system at 8 GHz in 5 new epochs. The source has also been monitored with GOBELINS at 5 GHz, and 6 additional epochs are available. The new observations together with those previously reported by Dzib et al. (2011) cover a baseline timescale of years, i.e. a significant fraction of the orbit. Old data were recalibrated homogeneously applying the same calibration strategy as for the new data, and combined with the GOBELINS observations to form a single data set. The data were fitted with two models. In the first “Full model”, we fit the orbital and astrometric parameters of the system simultaneously. Orbital elements in this model are period (), time of periastron passage (), eccentricity (), angle of line of nodes (), inclination (), angle from node to periastron (), semimajor axis () of the primary, and mass ratio (). Astrometric parameters include center of mass at first epoch of the GOBELINS observations where the primary is detected (, ), parallax (), and proper motion (, ) of the system. For this fit, a grid of initial guesses of , , , and is explored. The final values of these parameters are fine-tuned by the code, and the remaining model parameters are fitted directly. The first panel of Figure 5 shows the resulting best-fit curve and the measured positions of both components of the system, while the second panel shows the same fit without parallax and measured positions with parallax signature removed. Finally, the motion of the barycenter is shown in the last panel of the same figure.
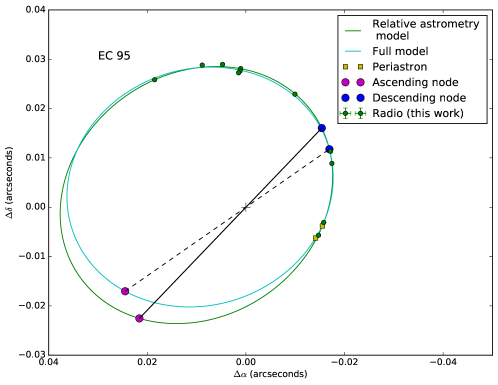
In the second “Relative Model”, we use the Binary Star Combined Solution Package to fit the positions of the secondary relative to the primary component and solve for , , , , , , and . The total mass of the system is then derived from Kepler’s law. The solutions found by the “Full model” are used as initial guesses for this fit. Uncertainties in the orbital elements are computed from the scatter on model parameters. The best-fit solution is shown in Figure 6, and compared with the solution found by the “Full model”. Solutions for the orbital elements from both models are given in Table 6. Dzib et al. (2010) argued that one of the system components should be considerably more massive than the other, however, their reported observations only covered a small fraction of the complete orbit. Here, based on a larger number of observations, we have derived a similar mass for both components, while the total mass of is consistent with that estimated in past works (Preibisch, 1999; Pontoppidan et al., 2004), and with the spectral type of the source.
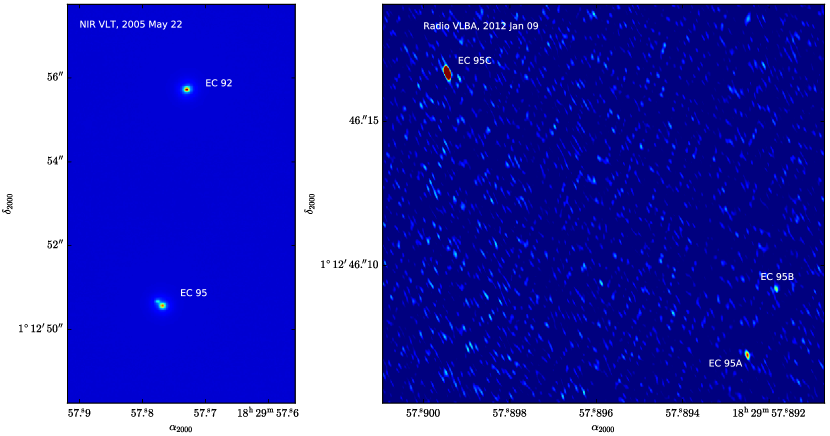
A third source is detected in the EC95 system at two epochs at 8 and 61, respectively. This source was located mas to the North-east of the barycenter of the close binary, at a position angle of on 2008 September 15, and mas in the same direction, at a position angle of on 2012 January 9 (See Table 4). The third source was also detected in near-IR (NIR) observations taken at the VLT on 2005, May 11 and 22 (Duchêne et al., 2007). A map of the system as seen in NIR emission is shown in the first panel of Figure 7. The northernmost source is EC 92, a young ( yr), Class I (Pontoppidan et al., 2004) and low-mass (; Preibisch, 1999) star. EC 95 is the brightest source to the south in the map. While the two close components of EC 95 are unresolved, the third component is clearly visible, at a position angle of , and separation of from the close binary, i.e. at a position similar to that of the radio source seen in our VLBA images (Figure 7, right). Given the short angular separation of the third component relative to the close binary, it is possible that the three sources form a bound system. To investigate this possibility, we include two more free parameters in the “Full model”, corresponding to the acceleration terms in right ascension, , and declination, . We find that these acceleration terms are zero within the errors, and that the motion of the barycenter of the close binary remains linear during the timescale covered by our observations. This suggests that the third source may be much less massive than the close binary and following a very long period orbit. Actually, if we assume that the total mass of the system is , i.e. that the mass of the third source is negligible, we estimate an orbital period yr. The change in angular separation of the third companion (detected first in the NIR and then in the VLBA images) relative to the barycenter of the close binary is mas in 6.7 yr, while the position angle only changes degrees over this time scale. This is consistent, within the errors, with the expected motion of the companion on a circular orbit that has the period estimated above. Unfortunately, the third companion has remained undetectable in the radio since 2012. If there were more detections, we would constrain its astrometric parameters and investigate a possible acceleration induced by its orbital motion around the close binary.
Finally, we note that Dzib et al. (2011) estimated a distance to EC 95 of pc by modeling separately the source motion of each component as a superposition of parallax and uniform accelerated proper motion. The derived distance from the “Full model” is pc, which is consistent within with the previous determination.
3.3 Comments on other sources: PMN 1829+0101
PMN 1829+0101 = GBS VLA J182930.71+010048.3 is a strong radio source with reported VLA fluxes of mJy at 1.4 GHz (Ofek & Frail, 2011) and mJy at 4.5 GHz (Ortiz-León et al., 2015). The source shows an extended structure of in the 4.5 GHz VLA images, but this emission is filtered out by the VLBA. There is a counterpart in X-ray emission at (Xmm-Newton Survey Science Centre, 2013), and in the IRAC 3.6 m-band (Evans et al., 2003) at from the radio peak. The fit to the data yields mas, corresponding to a distance of pc. Using this distance we derive the location of the source in the Milky Way. This position is expressed in the rectangular frame centered on the location of the Sun, with the () axis pointing toward the Galactic Center, the () axis perpendicular to () and pointing in the direction of the Galactic rotation, and () pointing toward the Galactic North Pole. The source coordinates in this system are pc: it is located in the direction of the Scutum arm, which hosts newly formed OB-type stars, but at 377 pc above the Galactic mid-plane.
4 Discussion
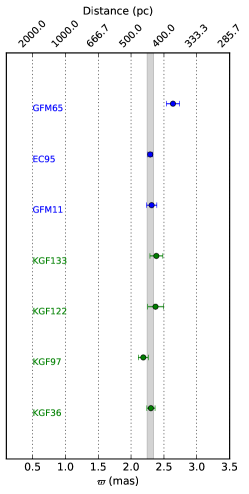
We have derived the distance to 7 objects in the Serpens/Aquila complex. The parallaxes for these objects are shown graphically in Figure 8, where we see clearly that sources in Serpens and Aquila share similar values. Proper motions, on the other hand, show a large spread, but this is expected as Serpens and W40 are different clusters. The weighted mean value of the 7 parallaxes is mas, with a weighted standard deviation of mas. Only the source GMF 65, for which we derive pc, differs from the rest by more than 1 sigma. As discussed in Section 3.2.1, this source seems to be a binary system, whose orbital motion remains unmodelled because of the low number of detections. Ignoring this source yields a mean weighted parallax of mas. This corresponds to a weighted mean distance of pc, with a standard deviation of pc. The standard deviation on the mean reflects only the uncertainties in the distance measurements because typical errors on individual distances are larger than 10 pc.
Note that Straižys et al. (2003) determined the near edge of the Aquila/Serpens cloud complex to be at pc, with a depth of 80 pc. Therefore, according to their estimates, the far edge of the complex lies at a distance (assuming a deviation) of pc (Winston et al., 2010). Assuming a deviation, we place the far edge of the cloud at a maximum distance of 470 pc, which is consistent with the mean distance to the cloud obtained here from parallax measurements.
Our measurements not only confirm the early estimation by Dzib et al. (2010) of a larger distance to Serpens than previously thought, but also show that Serpens and W40 are part of the same complex, lying at the same distance along the line of sight. Earlier estimates based on indirect methods, e.g. by Kuhn et al. (2010) and Shuping et al. (2012), suggested a mean distance to W40 of pc. Based on these measurements, W40 and the Serpens region have been treated in the literature as separated objects, as such works used the value obtained by Straižys et al. (1996) of 260 pc for the Serpens/Aquila Rift (see e.g. Straižys et al., 2003; Gutermuth et al., 2008). When it was first discovered, Serpens South was associated with Serpens Main because both regions share similar local standard of rest (LSR) velocities (6–11 km s-1; White et al., 1995; Gutermuth et al., 2008; Bontemps et al., 2010), indicating that they are comoving. Until recently, it has become more common to consider that Serpens South and W40 form a single cloud structure. This is because the LSR velocities measured by molecular line observations in the entire W40/Serpens South region are 4–10 km s-1 (Zeilik & Lada, 1978; Maury et al., 2011), which are in the range of the LSR velocities measured in Serpens Main. We do not have any astrometric measurement to sources in Serpens South (because known YSOs in the cluster are intrinsically radio weak, Ortiz-León et al., 2015; Kern et al., 2016), but given its proximity and similarity in LSR velocities to W40, we speculate that these two clusters are physically associated. If this last statement is confirmed, it would represent a meaningful evidence for an association between Serpens Main, W40, and Serpens South.
Proper motions are plotted in Figure 8 after the correction for the solar peculiar motion is applied. Mean values are for Serpens sources, and for W40 sources. Uncertainties in the mean values correspond to the standard deviation of individual measurements in each cluster. It appears that the clusters are moving in similar directions, which is an additional support for our interpretation of Serpens Main and W40 being part of the same cloud complex.
Finally, we note that a larger distance to the Serpens and Aquila regions imply luminosities and dust masses larger by a factor of relative to those derived assuming 260 pc, and makes young stellar objects younger with respect to evolutionary tracks. This implies that the physical interpretation of the stellar and core population in the regions needs to be revised.
5 Summary
We have analyzed multi-epoch VLBA observations taken as part of the GOBELINS project toward young stars in the Serpens and W40 regions in the Aquila complex. The astrometric fits to 7 sources, including one confirmed binary (posible triple) system, provide us with parallaxes and proper motions for single sources, as well as with the orbital parameters for the multiple system. Since individual parallaxes of sources in Serpens are consistent with those of W40 sources, we conclude that both Serpens and W40 are located at the same distance. The mean parallax value yields pc, confirming the early distance estimation obtained solely for the source EC 95 in the Serpens Core, which was also derived from a parallax measurement with the VLBA. The other sources detected during the survey resulted to be background sources, not associated with the Aquila Rift.
References
- Andre et al. (1988) Andre, P., Montmerle, T., Feigelson, E. D., Stine, P. C., & Klein, K.-L. 1988, ApJ, 335, 940
- André et al. (2010) André, P., Men’shchikov, A., Bontemps, S., et al. 2010, A&A, 518, L102
- Bobylev (2016) Bobylev, V. V. 2016, Astronomy Letters, 42, 544
- Bontemps et al. (2010) Bontemps, S., André, P., Könyves, V., et al. 2010, A&A, 518, L85
- Cambrésy (1999) Cambrésy, L. 1999, A&A, 345, 965
- Chavarria-K. et al. (1988) Chavarria-K., C., de Lara, E., Finkenzeller, U., Mendoza, E. E., & Ocegueda, J. 1988, A&A, 197, 151
- Cohen & Kuhi (1979) Cohen, M., & Kuhi, L. V. 1979, ApJS, 41, 743
- Condon (1997) Condon, J. J. 1997, PASP, 109, 166
- Dobashi et al. (2005) Dobashi, K., Uehara, H., Kandori, R., et al. 2005, PASJ, 57, S1
- Duchêne et al. (2007) Duchêne, G., Bontemps, S., Bouvier, J., et al. 2007, A&A, 476, 229
- Dunham et al. (2015) Dunham, M. M., Allen, L. E., Evans, II, N. J., et al. 2015, ApJS, 220, 11
- Dzib et al. (2010) Dzib, S., Loinard, L., Mioduszewski, A. J., et al. 2010, ApJ, 718, 610
- Dzib et al. (2011) —. 2011, RMxAC, 40, 231
- Eiroa & Casali (1995) Eiroa, C., & Casali, M. M. 1995, A&A, 303, 87
- Eiroa et al. (2008) Eiroa, C., Djupvik, A. A., & Casali, M. M. 2008, The Serpens Molecular Cloud, ed. B. Reipurth, 693
- Eiroa et al. (2005) Eiroa, C., Torrelles, J. M., Curiel, S., & Djupvik, A. A. 2005, AJ, 130, 643
- Erickson et al. (2015) Erickson, K. L., Wilking, B. A., Meyer, M. R., et al. 2015, ApJ, 149, 103
- Evans et al. (2003) Evans, II, N. J., Allen, L. E., Blake, G. A., et al. 2003, PASP, 115, 965
- Feigelson & Getman (2005) Feigelson, E. D., & Getman, K. V. 2005, ArXiv:astro-ph/0501207
- Feigelson & Montmerle (1999) Feigelson, E. D., & Montmerle, T. 1999, ARA&A, 37, 363
- Giardino et al. (2007) Giardino, G., Favata, F., Micela, G., Sciortino, S., & Winston, E. 2007, A&A, 463, 275
- Greisen (2003) Greisen, E. W. 2003, Information Handling in Astronomy - Historical Vistas, 285, 109
- Gutermuth et al. (2008) Gutermuth, R. A., Bourke, T. L., Allen, L. E., et al. 2008, ApJ, 673, L151
- Harvey et al. (2007) Harvey, P., Merín, B., Huard, T. L., et al. 2007, ApJ, 663, 1149
- Harvey et al. (2006) Harvey, P. M., Chapman, N., Lai, S.-P., et al. 2006, ApJ, 644, 307
- Heiderman & Evans (2015) Heiderman, A., & Evans, II, N. J. 2015, ApJ, 806, 231
- Kaas et al. (2004) Kaas, A. A., Olofsson, G., Bontemps, S., et al. 2004, A&A, 421, 623
- Kern et al. (2016) Kern, N. S., Keown, J. A., Tobin, J. J., Mead, A., & Gutermuth, R. A. 2016, AJ, 151, 42
- Kolesnik & Iurevich (1983) Kolesnik, I. G., & Iurevich, L. V. 1983, Astrofizika, 19, 761
- Könyves et al. (2015) Könyves, V., André, P., Men’shchikov, A., et al. 2015, A&A, 584, A91
- Kuhn et al. (2010) Kuhn, M. A., Getman, K. V., Feigelson, E. D., et al. 2010, ApJ, 725, 2485
- Mallick et al. (2013) Mallick, K. K., Kumar, M. S. N., Ojha, D. K., et al. 2013, ApJ, 779, 113
- Maury et al. (2011) Maury, A. J., André, P., Men’shchikov, A., Könyves, V., & Bontemps, S. 2011, A&A, 535, A77
- Menten et al. (2007) Menten, K. M., Reid, M. J., Forbrich, J., & Brunthaler, A. 2007, A&A, 474, 515
- Molinari et al. (1996) Molinari, S., Brand, J., Cesaroni, R., & Palla, F. 1996, A&A, 308, 573
- Ofek & Frail (2011) Ofek, E. O., & Frail, D. A. 2011, ApJ, 737, 45
- Oliveira et al. (2009) Oliveira, I., Merín, B., Pontoppidan, K. M., et al. 2009, ApJ, 691, 672
- Oliveira et al. (2010) Oliveira, I., Pontoppidan, K. M., Merín, B., et al. 2010, ApJ, 714, 778
- Ortiz-León et al. (2015) Ortiz-León, G. N., Loinard, L., Mioduszewski, A. J., et al. 2015, ApJ, 805, 9
- Plunkett et al. (2015) Plunkett, A. L., Arce, H. G., Corder, S. A., et al. 2015, ApJ, 803, 22
- Pontoppidan et al. (2004) Pontoppidan, K. M., van Dishoeck, E. F., & Dartois, E. 2004, A&A, 426, 925
- Pradel et al. (2006) Pradel, N., Charlot, P., & Lestrade, J.-F. 2006, A&A, 452, 1099
- Preibisch (1999) Preibisch, T. 1999, A&A, 345, 583
- Rodríguez et al. (2010) Rodríguez, L. F., Rodney, S. A., & Reipurth, B. 2010, AJ, 140, 968
- Shuping et al. (2012) Shuping, R. Y., Vacca, W. D., Kassis, M., & Yu, K. C. 2012, AJ, 144, 116
- Smith et al. (1985) Smith, J., Bentley, A., Castelaz, M., et al. 1985, ApJ, 291, 571
- Straižys et al. (1996) Straižys, V., Černis, K., & Bartašiute, S. 1996, BaltA, 5, 125
- Straižys et al. (2003) Straižys, V., Černis, K., & Bartašiute, S. 2003, A&A, 405, 585
- Thompson et al. (2007) Thompson, A. R., Moran, J. M., & Swenson, G. W. 2007, Interferometry and Synthesis in Radio Astronomy, John Wiley & Sons, 2007.
- Vallee (1987) Vallee, J. P. 1987, A&A, 178, 237
- White et al. (1995) White, G. J., Casali, M. M., & Eiroa, C. 1995, A&A, 298, 594
- Winston et al. (2007) Winston, E., Megeath, S. T., Wolk, S. J., et al. 2007, ApJ, 669, 493
- Winston et al. (2009) —. 2009, AJ, 137, 4777
- Winston et al. (2010) —. 2010, AJ, 140, 266
- Xmm-Newton Survey Science Centre (2013) Xmm-Newton Survey Science Centre, C. 2013, VizieR Online Data Catalog, 9044
- Zeilik & Lada (1978) Zeilik, II, M., & Lada, C. J. 1978, ApJ, 222, 896
- Zhang et al. (1988) Zhang, C. Y., Laureijs, R. J., Wesselius, P. R., & Clark, F. O. 1988, A&A, 199, 170
| Project | Observation | VLBA pointing positions | Observed | |
|---|---|---|---|---|
| code | Date | R.A. () | Decl. () | band |
| BL175E0 | 01 sep 2013 | 18:29:10.178 | +01:25:59.56 | C |
| 18:29:27.366 | +01:20:37.43 | |||
| BL175E1 | 02 sep 2013 | 18:29:30.714 | +01:00:48.31 | C |
| 18:29:47.838 | +01:14:21.66 | |||
| BL175E2 | 03 sep 2013 | 18:30:44.115 | –02:01:45.66 | C |
| 18:31:21.969 | –02:04:52.54 | |||
| BL175E3 | 05 sep 2013 | 18:29:49.507 | +01:19:55.88 | C |
| 18:29:52.736 | –01:51:59.93 | |||
| BL175E4 | 07 sep 2013 | 18:31:21.141 | –02:04:31.08 | X |
| 18:29:16.120 | +01:04:37.58 | |||
| 18:29:33.073 | +01:17:16.39 | |||
| BL175DX | 17 feb 2014 | 18:31:18.685 | –01:54:55.99 | X |
| BL175G0 | 01 mar 2014 | 18:29:10.178 | +01:25:59.56 | C |
| 18:29:27.366 | +01:20:37.43 | |||
| BL175G1 | 03 mar 2014 | 18:29:30.714 | +01:00:48.31 | C |
| 18:29:47.838 | +01:14:21.66 | |||
| BL175G2 | 04 mar 2014 | 18:31:21.969 | –02:04:52.54 | C |
| 18:30:44.115 | –02:01:45.66 | |||
| BL175G3 | 06 mar 2014 | 18:29:49.507 | +01:19:55.88 | C |
| 18:29:52.736 | –01:51:59.93 | |||
| BL175G4 | 09 mar 2014 | 18:29:16.120 | +01:04:37.58 | X |
| 18:29:33.073 | +01:17:16.39 | |||
| BL175GC | 01 apr 2014 | 18:28:54.46 | +01:18:23.78 | C |
| 18:29:48.83 | +01:06:47.46 | |||
| BL175CR | 07 oct 2014 | 18:29:10.178 | +01:25:59.56 | C |
| 18:29:27.366 | +01:20:37.43 | |||
| BL175CS | 12 oct 2014 | 18:29:30.714 | +01:00:48.31 | C |
| 18:29:47.838 | +01:14:21.66 | |||
| BL175CT | 15 oct 2014 | 18:31:21.969 | –02:04:52.54 | C |
| 18:30:44.115 | –02:01:45.66 | |||
| BL175EX | 27 feb 2015 | 18:29:10.178 | +01:25:59.56 | C |
| 18:29:27.366 | +01:20:37.43 | |||
| BL175EY | 02 mar 2015 | 18:29:47.838 | +01:14:21.66 | C |
| 18:31:18.685 | –01:54:55.99 | |||
| BL175EZ | 20 mar 2015 | 18:31:21.969 | –02:04:52.54 | C |
| 18:30:44.115 | –02:01:45.66 | |||
| BL175GT | 15 sep 2015 | 18:28:54.46 | +01:18:23.78 | X |
| 18:29:48.83 | +01:06:47.46 | |||
| BL175GU | 19 sep 2015 | 18:31:21.969 | –02:04:52.54 | C |
| 18:30:44.115 | –02:01:45.66 | |||
| BL175GW | 04 oct 2015 | 18:29:10.178 | +01:25:59.56 | C |
| 18:29:27.366 | +01:20:37.43 | |||
| BL175GX | 06 oct 2015 | 18:29:47.838 | +01:14:21.66 | C |
| 18:31:18.685 | –01:54:55.99 | |||
| BL175GV | 11 oct 2015 | 18:31:21.141 | –02:04:31.08 | C |
| 18:29:16.120 | +01:04:37.58 | |||
| 18:29:33.073 | +01:17:16.39 | |||
| BL175GY | 13 oct 2015 | 18:29:49.507 | +01:19:55.88 | C |
| 18:29:52.736 | –01:51:59.93 | |||
| BL175CU | 29 feb 2016 | 18:29:52.736 | –01:51:59.93 | C |
| 18:31:21.141 | –02:04:31.08 | |||
| BL175F4 | 20 mar 2016 | 18:29:33.073 | +01:17:16.39 | X |
| BL175F8 | 28 apr 2016 | 18:29:47.838 | +01:14:21.66 | C |
| R.A. | DEC. | Calibrators1 |
|---|---|---|
| (J2000) | (J2000) | |
| 18:29:52.736 | –01:51:59.93 | J1834–0301, J1833+0115, J1824+0119, J1821–0502 |
| 18:31:21.141 | –02:04:31.08 | |
| 18:29:47.838 | +01:14:21.66 | J1833+0115, J1826+0149, J1824+0119, J1832+0118 |
| 18:29:30.714 | +01:00:48.31 | |
| 18:28:54.460 | +01:18:23.78 | J1832+0118, J1833+0115, J1826+0149, J1824+0119 |
| 18:29:48.830 | +01:06:47.46 | |
| 18:31:21.969 | –02:04:52.54 | J1834–0301, J1833+0115, J1824+0119, J1821–0502 |
| 18:30:44.115 | –02:01:45.66 | |
| 18:29:16.120 | +01:04:37.58 | J1826+0149, J1833+0115, J1824+0119, J1832+0118 |
| 18:29:33.073 | +01:17:16.39 | |
| 18:29:10.178 | +01:25:59.56 | |
| 18:29:27.366 | +01:20:37.43 | |
| 18:29:33.073 | +01:17:16.39 | |
| 18:31:18.685 | –01:54:55.99 | J1834–0301, J1824+0119, J1819–0258, J1833+0115 |
| 18:29:49.507 | +01:19:55.88 | J1826+0149, J1832+0118, J1833+0115, J1824+0119 |
| GBS-VLA | Other | Type of | Minimum flux | Maximum flux | Minimum flux | Maximum flux | log [ (K) ]3 | SED |
|---|---|---|---|---|---|---|---|---|
| name1 | identifier | source | at 5 GHz | at 5 GHz | at 8 GHz | at 8 GHz | Class | |
| (mJy) | (mJy) | (mJy) | (mJy) | |||||
| (1) | (2) | (3) | (4) | (5) | (6) | (7) | (8) | (9) |
| Serpens Main | ||||||||
| J182854.44+011859.7 | – | ? | – | 0.260.05 | 6.4 | – | ||
| J182854.46+011823.7 | – | B | 3.880.05 | 6.040.07 | 8.5 | – | ||
| J182854.87+011753.0 | – | B | 0.210.04 | 0.240.07 | 7.2 | – | ||
| J182903.06+012331.0 | – | B | 0.490.05 | 0.760.07 | – | 7.5 | – | |
| J182905.07+012309.0 | – | B | 0.260.04 | 0.310.05 | – | 6.5 | – | |
| J182910.17+012559.5 | SSTc2d J182910.2+012560 | B | 2.700.05 | 3.450.05 | – | 9.3 | – | |
| J182911.94+012119.4 | – | B | 0.360.03 | 0.510.06 | – | 7.7 | – | |
| J182916.11+010437.5 | SSTSL2 J182916.10+010438.6 | B | 0.330.06 | 0.240.05 | 0.260.08 | 8.0 | – | |
| J182918.23+011757.7 | SSTc2d J182918.2+011758 | B | 0.190.05 | 0.250.05 | – | 7.3 | – | |
| J182926.71+012342.1 | SSTSL2 J182926.72+012342.4 | B | 0.170.05 | 0.250.06 | – | 6.6 | – | |
| J182930.71+010048.3 | PMN 1829+0101 | B | 3.870.05 | 7.440.10 | – | 8.7 | – | |
| J182933.07+011716.3 | GFM 11 | YSO | 0.190.04 | 0.270.05 | 0.330.06 | 6.6 | Class III | |
| J182935.02+011503.2 | DCE08-210 5 | B | 0.140.05 | 0.200.04 | – | 6.3 | – | |
| J182936.50+012317.0 | SSTc2d J182936.5+012317 | B | 0.140.04 | 0.260.05 | – | 6.4 | – | |
| J182944.07+011921.1 | NVSS 182944+011920 | B | 1.410.04 | 1.740.04 | – | 7.2 | – | |
| J182948.83+010647.4 | SSTc2d J182948.8+010648 | B | 0.350.05 | 0.630.07 | 7.5 | – | ||
| J182949.50+011955.8 | – | B | 1.960.07 | 2.400.07 | – | 7.6 | – | |
| J182951.04+011533.8 | ETC 8 | B | 0.350.06 | 0.590.05 | – | 8.0 | – | |
| J182957.89+011246.0 | EC 95A | YSO | 0.260.05 | 1.180.04 | – | 8.3 | P-HAeBe | |
| J182957.89+011246.0 | EC 95B | 0.160.04 | 1.170.04 | – | 8.4 | |||
| J182957.89+011246.0 | EC 95C2 | – | – | 0.860.19 | 3.680.10 | 7.4 | ||
| J183000.65+011340.0 | GFM 65A | YSO | 0.260.05 | 0.500.04 | – | 6.7 | Class III | |
| J183000.65+011340.0 | GFM 65B | 0.220.05 | 0.570.11 | – | 6.4 | |||
| J183004.62+012234.1 | GFM 70 | B | 0.410.05 | 0.420.05 | – | 6.6 | – | |
| J182952.73-015159.9 | – | B | 0.200.05 | 0.260.07 | – | 6.6 | – | |
| W40 | ||||||||
| J183044.11-020145.6 | 2M18304408–0201458 | B | 1.650.06 | 2.150.06 | – | 7.9 | – | |
| J183114.82-020350.1 | KGF 36 | Star | 0.410.08 | 0.480.05 | 0.360.09 | 0.480.08 | 7.3 | – |
| J183118.68-015455.9 | – | B | 0.430.10 | 0.520.06 | 1.140.18 | 7.0 | – | |
| J183122.32-020619.6 | KGF 82 | YSO | 0.410.05 | 0.260.06 | 7.6 | Class III | ||
| J183123.62-020535.8 | KGF 97 | YSO | 0.100.05 | 1.210.05 | – | 7.9 | Class III | |
| J183126.02-020517.0 | KGF 122 | YSO | 0.200.05 | 0.910.06 | – | 8.0 | Class II | |
| J183127.45-020512.0 | KGF 133 | YSO | 0.450.07 | 0.510.06 | 2.400.11 | 7.7 | Class II/III | |
| J183127.65-020509.7 | KGF 138 | YSO | 0.350.06 | – | 6.5 | HAeBe | ||
| Julian Day | Project1 | (J2000.0) | (J2000.0) | ||
|---|---|---|---|---|---|
| EC 95A | |||||
| 2454800.39885 | BL160 | 18 29 57.89186638 | 0.00000180 | 1 12 46.110101 | 0.000069 |
| 2454890.14136 | BL160 | 18 29 57.89217322 | 0.00000048 | 1 12 46.106940 | 0.000018 |
| 2455171.38315 | BL160 | 18 29 57.89222331 | 0.00000098 | 1 12 46.095333 | 0.000041 |
| 2455268.11855 | BL160 | 18 29 57.89247995 | 0.00000202 | 1 12 46.092081 | 0.000067 |
| 2455356.87555 | BL160 | 18 29 57.89242962 | 0.00000117 | 1 12 46.089683 | 0.000054 |
| 2455936.29042 | BD155 | 18 29 57.89251865 | 0.00000457 | 1 12 46.068868 | 0.000150 |
| 2455937.28769 | BD155 | 18 29 57.89253227 | 0.00000298 | 1 12 46.068531 | 0.000082 |
| 2456522.68545 | BD155 | 18 29 57.89239849 | 0.00000095 | 1 12 46.053528 | 0.000034 |
| 2456524.67999 | BD155 | 18 29 57.89238944 | 0.00000228 | 1 12 46.053868 | 0.000114 |
| 2456538.70634 | BL175 | 18 29 57.89232999 | 0.00000204 | 1 12 46.054528 | 0.000066 |
| 2456720.20849 | BL175 | 18 29 57.89263275 | 0.00000445 | 1 12 46.049701 | 0.000122 |
| 2456943.59865 | BL175 | 18 29 57.89233271 | 0.00000528 | 1 12 46.043694 | 0.000186 |
| 2457507.02912 | BL175 | 18 29 57.89266020 | 0.00000104 | 1 12 46.032795 | 0.000036 |
| EC 95B | |||||
| 2454457.31822 | BL156 | 18 29 57.89095609 | 0.00000120 | 1 12 46.107905 | 0.000038 |
| 2454646.81935 | BL160 | 18 29 57.89095848 | 0.00000481 | 1 12 46.107242 | 0.000186 |
| 2454724.60637 | BL160 | 18 29 57.89080948 | 0.00000083 | 1 12 46.105900 | 0.000029 |
| 2454800.39885 | BL160 | 18 29 57.89088405 | 0.00000217 | 1 12 46.104416 | 0.000089 |
| 2454890.14136 | BL160 | 18 29 57.89112095 | 0.00000388 | 1 12 46.103859 | 0.000138 |
| 2454985.89100 | BL160 | 18 29 57.89106970 | 0.00000414 | 1 12 46.104177 | 0.000240 |
| 2455074.64800 | BL160 | 18 29 57.89091190 | 0.00000082 | 1 12 46.103134 | 0.000032 |
| 2455268.11855 | BL160 | 18 29 57.89131814 | 0.00000402 | 1 12 46.100962 | 0.000162 |
| 2455356.87555 | BL160 | 18 29 57.89128563 | 0.00000363 | 1 12 46.101013 | 0.000176 |
| 2455442.64072 | BL160 | 18 29 57.89116731 | 0.00000472 | 1 12 46.099877 | 0.000202 |
| 2455936.29042 | BD155 | 18 29 57.89185545 | 0.00000614 | 1 12 46.091786 | 0.000156 |
| 2456522.68545 | BD155 | 18 29 57.89246953 | 0.00000063 | 1 12 46.081657 | 0.000023 |
| 2456524.67999 | BD155 | 18 29 57.89246863 | 0.00000421 | 1 12 46.081514 | 0.000137 |
| 2456538.70634 | BL175 | 18 29 57.89244323 | 0.00000760 | 1 12 46.081859 | 0.000200 |
| 2456720.20849 | BL175 | 18 29 57.89295395 | 0.00000877 | 1 12 46.078949 | 0.000243 |
| 2456943.59865 | BL175 | 18 29 57.89292358 | 0.00000378 | 1 12 46.072521 | 0.000108 |
| 2457084.21205 | BL175 | 18 29 57.89339762 | 0.00000179 | 1 12 46.068654 | 0.000071 |
| 2457302.61352 | BL175 | 18 29 57.89339468 | 0.00000865 | 1 12 46.063242 | 0.000279 |
| 2457391.30720 | BD155 | 18 29 57.89364862 | 0.00000016 | 1 12 46.060099 | 0.000006 |
| 2457507.02912 | BL175 | 18 29 57.89389465 | 0.00000108 | 1 12 46.058656 | 0.000036 |
| EC 95C | |||||
| 2454724.60637 | BL160 | 18 29 57.89856745 | 0.00000305 | 1 12 46.205651 | 0.000108 |
| 2455936.29042 | BD155 | 18 29 57.89945356 | 0.00000060 | 1 12 46.166823 | 0.000019 |
| GBS-VLA | Other identifier1 | Parallax | Distance | ||
|---|---|---|---|---|---|
| name | (mas) | (mas yr-1) | (mas yr-1) | (pc) | |
| (1) | (2) | (3) | (4) | (5) | (6) |
| J182933.07+011716.3 | GFM 11 | 2.313 0.078 | 3.634 0.050 | -8.864 0.127 | 432.3 14.6 |
| J182957.89+011246.0 | EC 95 | 2.291 0.038 | 3.599 0.026 | -8.336 0.030 | 436.4 7.1 |
| J183000.65+011340.0 | GFM 652 | 2.638 0.118 | 1.573 0.070 | -6.513 0.152 | 379.1 17.0 |
| J183114.82-020350.1 | KGF 36 | 2.302 0.063 | 0.186 0.053 | -6.726 0.121 | 434.5 11.8 |
| J183123.62-020535.8 | KGF 97 | 2.186 0.076 | -0.258 0.058 | -7.514 0.135 | 457.5 16.0 |
| J183126.02-020517.0 | KGF 122 | 2.372 0.120 | 4.586 0.074 | -7.946 0.167 | 421.5 21.4 |
| J183127.45-020512.0 | KGF 133 | 2.385 0.098 | -0.330 0.049 | -7.746 0.111 | 419.3 17.3 |
| Model | a | P | ||||||||
|---|---|---|---|---|---|---|---|---|---|---|
| (mas) | (yr) | (o) | (o) | (o) | (M⊙) | (M⊙) | (M⊙) | |||
| (1) | (2) | (3) | (4) | (5) | (6) | (7) | (8) | (9) | (10) | (11) |
| Full | 28.9 0.4 | 21.5 1.5 | 2008.85 2.0 | 0.397 0.001 | 124.8 2.1 | 31.6 0.9 | 477.5 1.8 | 2.0 0.2 | 2.3 0.1 | 4.3 0.2 |
| Rel. astr. | 30.7 1.4 | 23.1 1.4 | 2009.08 0.14 | 0.393 0.011 | 136.2 2.5 | 34.8 2.0 | 475.3 2.8 | – | – | 4.5 0.2 |
| Julian Day | (J2000.0) | (J2000.0) | ||
|---|---|---|---|---|
| SSTc2d J182910.2+012560 | ||||
| 2456537.71083 | 18 29 10.18111439 | 0.00000048 | 1 25 59.593986 | 0.000016 |
| 2456718.21396 | 18 29 10.18111515 | 0.00000048 | 1 25 59.593964 | 0.000016 |
| 2456938.61153 | 18 29 10.18111964 | 0.00000046 | 1 25 59.594012 | 0.000016 |
| 2457081.21921 | 18 29 10.18110324 | 0.00000063 | 1 25 59.594051 | 0.000020 |
| 2457300.62039 | 18 29 10.18110850 | 0.00000051 | 1 25 59.594058 | 0.000017 |
| SSTc2d J182918.2+011758 | ||||
| 2456537.71083 | 18 29 18.23057894 | 0.00000623 | 1 17 57.783157 | 0.000237 |
| 2456718.21396 | 18 29 18.23057676 | 0.00000432 | 1 17 57.782977 | 0.000165 |
| 2456938.61153 | 18 29 18.23060031 | 0.00000827 | 1 17 57.783177 | 0.000266 |
| 2457081.21921 | 18 29 18.23056481 | 0.00000605 | 1 17 57.782967 | 0.000199 |
| 2457300.62039 | 18 29 18.23058354 | 0.00000919 | 1 17 57.783323 | 0.000305 |
| GBS-VLA J182903.06+012331.0 | ||||
| 2456537.71083 | 18 29 03.06984956 | 0.00000319 | 1 23 31.087749 | 0.000103 |
| 2456718.21396 | 18 29 03.06986038 | 0.00000339 | 1 23 31.087530 | 0.000110 |
| 2456938.61153 | 18 29 03.06986699 | 0.00000383 | 1 23 31.087498 | 0.000101 |
| 2457081.21921 | 18 29 03.06987411 | 0.00000425 | 1 23 31.087780 | 0.000116 |
| 2457300.62039 | 18 29 03.06987273 | 0.00000382 | 1 23 31.087686 | 0.000132 |
| SSTc2d J182936.5+012317 | ||||
| 2456537.71083 | 18 29 36.50110691 | 0.00000859 | 1 23 17.076353 | 0.000169 |
| 2456718.21396 | 18 29 36.50114312 | 0.00000627 | 1 23 17.075662 | 0.000226 |
| 2456938.61153 | 18 29 36.50113297 | 0.00000496 | 1 23 17.076045 | 0.000161 |
| 2457081.21921 | 18 29 36.50112373 | 0.00001097 | 1 23 17.075484 | 0.000410 |
| 2457300.62039 | 18 29 36.50110998 | 0.00000771 | 1 23 17.076210 | 0.000196 |
| GBS-VLA J182905.07+012309.0 | ||||
| 2456537.71083 | 18 29 05.08095263 | 0.00000445 | 1 23 09.149373 | 0.000137 |
| 2456718.21396 | 18 29 05.08096153 | 0.00000384 | 1 23 09.149402 | 0.000155 |
| 2457081.21921 | 18 29 05.08094750 | 0.00000559 | 1 23 09.149718 | 0.000160 |
| 2457300.62039 | 18 29 05.08094627 | 0.00000762 | 1 23 09.150555 | 0.000146 |
| SSTSL2 J182926.72+012342.4 | ||||
| 2456537.71083 | 18 29 26.71049982 | 0.00000918 | 1 23 42.131201 | 0.000268 |
| 2456718.21396 | 18 29 26.71050367 | 0.00001050 | 1 23 42.130807 | 0.000385 |
| GBS-VLA J182911.94+012119.4 | ||||
| 2456537.71083 | 18 29 11.94832584 | 0.00000362 | 1 21 19.484862 | 0.000107 |
| 2456718.21396 | 18 29 11.94830530 | 0.00000283 | 1 21 19.485004 | 0.000112 |
| 2456938.61153 | 18 29 11.94832429 | 0.00000313 | 1 21 19.484997 | 0.000106 |
| 2457081.21921 | 18 29 11.94830236 | 0.00000478 | 1 21 19.485052 | 0.000132 |
| 2457300.62039 | 18 29 11.94833353 | 0.00000291 | 1 21 19.484955 | 0.000089 |
| NVSS 182944+011920 | ||||
| 2456537.71083 | 18 29 44.07658313 | 0.00000075 | 1 19 21.164119 | 0.000025 |
| 2456718.21396 | 18 29 44.07657402 | 0.00000085 | 1 19 21.164280 | 0.000028 |
| 2456938.61153 | 18 29 44.07659031 | 0.00000068 | 1 19 21.164227 | 0.000023 |
| 2457081.21921 | 18 29 44.07657708 | 0.00000112 | 1 19 21.164286 | 0.000035 |
| 2457300.62039 | 18 29 44.07655805 | 0.00000085 | 1 19 21.164512 | 0.000029 |
| PMN 1829+0101 | ||||
| 2456538.70634 | 18 29 30.72388371 | 0.00000033 | 1 0 48.005138 | 0.000010 |
| 2456720.20849 | 18 29 30.72391467 | 0.00000085 | 1 0 48.005243 | 0.000022 |
| 2456943.59865 | 18 29 30.72388420 | 0.00000045 | 1 0 48.004833 | 0.000016 |
| DCE08-210 5 | ||||
| 2456538.70634 | 18 29 35.02394353 | 0.00001739 | 1 15 03.254608 | 0.000371 |
| 2456720.20849 | 18 29 35.02397943 | 0.00001364 | 1 15 03.252858 | 0.000403 |
| 2457507.02912 | 18 29 35.02401622 | 0.00000701 | 1 15 03.253580 | 0.000198 |
| GFM 65 | ||||
| 2456720.20849 | 18 30 00.65283020 | 0.00000429 | 1 13 40.065067 | 0.000136 |
| 2456943.59865 | 18 30 00.65256389 | 0.00000712 | 1 13 40.061403 | 0.000205 |
| 2457302.61352 | 18 30 00.65266340 | 0.00000277 | 1 13 40.054815 | 0.000088 |
| second source: | ||||
| 2456720.20849 | 18 30 00.65296360 | 0.00002331 | 1 13 40.066599 | 0.000638 |
| 2456943.59865 | 18 30 00.65289182 | 0.00000696 | 1 13 40.061476 | 0.000276 |
| ETC 8 | ||||
| 2456720.20849 | 18 29 51.04143717 | 0.00000565 | 1 15 33.871396 | 0.000160 |
| 2456943.59865 | 18 29 51.04141126 | 0.00000725 | 1 15 33.870733 | 0.000178 |
| 2457084.21205 | 18 29 51.04142997 | 0.00000353 | 1 15 33.870437 | 0.000131 |
| 2457302.61352 | 18 29 51.04141829 | 0.00000270 | 1 15 33.870371 | 0.000080 |
| 2457507.02912 | 18 29 51.04142929 | 0.00000406 | 1 15 33.870259 | 0.000106 |
| KGF 122 | ||||
| 2456539.70380 | 18 31 26.01996029 | 0.00000276 | -2 5 17.086151 | 0.000086 |
| 2457102.16179 | 18 31 26.02073064 | 0.00000306 | -2 5 17.098461 | 0.000137 |
| 2457285.66188 | 18 31 26.02057197 | 0.00001863 | -2 5 17.102963 | 0.000368 |
| 2457448.21552 | 18 31 26.02087306 | 0.00001310 | -2 5 17.105731 | 0.000405 |
| 2M18304408–0201458 | ||||
| 2456539.70380 | 18 30 44.11485642 | 0.00000199 | -2 1 45.688322 | 0.000051 |
| 2456721.20565 | 18 30 44.11487547 | 0.00000271 | -2 1 45.689938 | 0.000071 |
| 2456946.58954 | 18 30 44.11484733 | 0.00000336 | -2 1 45.688604 | 0.000087 |
| 2457102.16179 | 18 30 44.11486486 | 0.00000140 | -2 1 45.688221 | 0.000038 |
| 2457285.66188 | 18 30 44.11485685 | 0.00000236 | -2 1 45.688281 | 0.000057 |
| KGF 138 | ||||
| 2457102.16179 | 18 31 27.65620135 | 0.00000709 | -2 5 09.799495 | 0.000178 |
| KGF 97 | ||||
| 2456721.20565 | 18 31 23.62227407 | 0.00000250 | -2 5 35.868544 | 0.000074 |
| 2456946.58954 | 18 31 23.62203557 | 0.00002812 | -2 5 35.873472 | 0.000761 |
| 2457102.16179 | 18 31 23.62227217 | 0.00001073 | -2 5 35.876576 | 0.000314 |
| 2457285.66188 | 18 31 23.62197113 | 0.00000699 | -2 5 35.880042 | 0.000161 |
| 2457448.21552 | 18 31 23.62223545 | 0.00000309 | -2 5 35.883516 | 0.000086 |
| KGF 36 | ||||
| 2456543.60141 | 18 31 14.82263201 | 0.00000386 | -2 3 50.149196 | 0.000131 |
| 2456726.05521 | 18 31 14.82293762 | 0.00000369 | -2 3 50.152750 | 0.000106 |
| 2457306.96324 | 18 31 14.82267359 | 0.00000980 | -2 3 50.163179 | 0.000371 |
| 2457448.21552 | 18 31 14.82293818 | 0.00000571 | -2 3 50.166392 | 0.000155 |
| GBS-VLA J182952.73–015159.9 | ||||
| 2456541.69591 | 18 29 52.73464125 | 0.00001627 | -1 51 59.925315 | 0.000561 |
| 2456723.19777 | 18 29 52.73465607 | 0.00002462 | -1 51 59.926572 | 0.000665 |
| 2457309.09678 | 18 29 52.73469573 | 0.00001149 | -1 51 59.925989 | 0.000363 |
| KGF 82 | ||||
| 2456543.60141 | 18 31 22.32975638 | 0.00000485 | -2 6 19.633463 | 0.000140 |
| 2457306.96324 | 18 31 22.32894475 | 0.00000404 | -2 6 19.660373 | 0.000166 |
| KGF 133 | ||||
| 2456543.60141 | 18 31 27.45984260 | 0.00000137 | -2 5 12.036684 | 0.000039 |
| 2457306.96324 | 18 31 27.45978832 | 0.00000657 | -2 5 12.052156 | 0.000273 |
| 2457448.21552 | 18 31 27.46007650 | 0.00000568 | -2 5 12.056771 | 0.000139 |
| GBS-VLA J183118.68–015455.9 | ||||
| 2456706.16961 | 18 31 18.68250486 | 0.00001724 | -1 54 56.073788 | 0.000262 |
| 2457084.21205 | 18 31 18.68250948 | 0.00001509 | -1 54 56.073322 | 0.000371 |
| 2457302.61352 | 18 31 18.68249661 | 0.00000858 | -1 54 56.072971 | 0.000207 |
| GBS-VLA J182949.50+011955.8 | ||||
| 2456541.69877 | 18 29 49.50633251 | 0.00000273 | 1 19 55.885107 | 0.000090 |
| 2456723.20062 | 18 29 49.50632851 | 0.00000189 | 1 19 55.885721 | 0.000123 |
| 2457309.09678 | 18 29 49.50633154 | 0.00000120 | 1 19 55.885384 | 0.000068 |
| GFM 70 | ||||
| 2456723.20062 | 18 30 04.62941667 | 0.00000502 | 1 22 34.131415 | 0.000132 |
| 2457309.09678 | 18 30 04.62940928 | 0.00000397 | 1 22 34.131168 | 0.000121 |
| GFM 11 | ||||
| 2456543.69416 | 18 29 33.07249309 | 0.00000229 | 1 17 16.360959 | 0.000098 |
| 2456726.19504 | 18 29 33.07290417 | 0.00000527 | 1 17 16.356120 | 0.000275 |
| 2457507.02912 | 18 29 33.07340833 | 0.00000593 | 1 17 16.337928 | 0.000238 |
| SSTSL2 J182916.10+010438.6 | ||||
| 2456543.69416 | 18 29 16.11947301 | 0.00000517 | 1 4 37.589379 | 0.000201 |
| 2456726.19504 | 18 29 16.11946492 | 0.00000667 | 1 4 37.589438 | 0.000220 |
| 2457307.60223 | 18 29 16.11947017 | 0.00000623 | 1 4 37.589495 | 0.000238 |
| GBS-VLA J182854.46+011823.7 | ||||
| 2456749.07794 | 18 28 54.46499411 | 0.00000049 | 1 18 23.813820 | 0.000015 |
| 2457281.61856 | 18 28 54.46500889 | 0.00000023 | 1 18 23.813619 | 0.000008 |
| GBS-VLA J182854.44+011859.7 | ||||
| 2457281.61856 | 18 28 54.44344643 | 0.00000226 | 1 18 59.737811 | 0.000112 |
| GBS-VLA J182854.87+011753.0 | ||||
| 2456749.07794 | 18 28 54.87254346 | 0.00000603 | 1 17 53.051049 | 0.000192 |
| 2457281.61856 | 18 28 54.87253760 | 0.00000534 | 1 17 53.051239 | 0.000208 |
| SSTc2d J182948.8+010648 | ||||
| 2456749.09635 | 18 29 48.82981795 | 0.00000628 | 1 6 47.450268 | 0.000181 |
| 2457281.61856 | 18 29 48.82980672 | 0.00000240 | 1 6 47.450032 | 0.000084 |