Interplay between magnetism and sodium vacancy ordering in Nax CoO2
Abstract
Using a combination of low temperature nano-calorimetry and X-ray diffraction we identify three temperature regimes characterized by distinct Na ordering patterns (low temperature up to 290 K, intermediate 290-340 K and high above 340 K). Through freezing-in of these patterns we established the two key roles sodium intercalation plays in the formation of the magnetic ground state: supplying the proper electron count for in-plane ferromagnetic interaction and through the 3D sodium ordering providing the inter-plane antiferromagnetic exchange path.
When first synthesized NaxCoO2 was considered a good candidate material for manufacturing rechargeable battery electrodes, yet it soon became clear that due to its higher ion mobility LixCoO2 would be the preferred material in energy storage. However because of the low abundance of lithium in earth crust and the high costs of its extraction NaxCoO2 has again attracted interest as a simplest possible alternative.
While Na acts as a charge reservoir in NaxCoO2 battery electrodes its role in defining the complex physical properties immanent to the CoO2layers is much more subtle. Na tends to order and thus provides a complex Coulomb potential landscape acting upon the cobalt 3d orbitals. This together with the highly correlated character of the electrons in the CoO2 layers leads to the emergence of a plethora of collective electronic ground states, including charge, spin density waves and even superconductivity when hydrated (Helme et al., 2006; Kuroki et al., 2007a; Mazin and Johannes, 2005; Mendels et al., 2005; Schaak et al., 2003; Takada et al., 2003). Moreover even in the regions of the phase diagram without any electronic ordering the properties of NaxCoO2 can be very unusual. This is especially visible in the Curie-Weiss metal phase occurring for Na content just above the Lifshithz transition (Yoshizumi et al., 2007; Wang et al., 2003).
A central question in the discussion of NaxCoO2 is weather all these Fermi surface instabilities originate from the change of electron count only or whether, for a given value of x, the geometric arrangement of Na ions plays an essential role for electronic ordering in the CoO2 layers (Roger et al., 2007; Shu et al., 2009; Kuroki et al., 2007b).
A first hint comes from the comparison of phase diagrams of NaxCoO2 with its sister compound LixCoO2, the widely used electrode material due to its high Li mobility. Interestingly for the same electron count, the ground states are found to be different (Motohashi et al., 2009). One possible reason for this difference could be the reduced ion mobility in NaxCoO2with the unique advantage of being slow enough to be accessible to experiments (Carlier et al., 2009; Medarde et al., 2013).
Another surprising phenomenon is that for certain sodium contents the low temperature ordering is dependent on cooling history of the sample (Schulze et al., 2008). This raises the question about the cause of the history effect: is it freezing-in of the high temperature crystallographic structure or perhaps of the interlayer sodium superstructures.
In this study we show, by using a combination of calorimetry and X-ray diffraction, not only that the sodium superstructures are responsible for the thermal history effect but also which sodium superstructures induce particular magnetic transitions. Moreover by rapid cooling (over 6000K/s) we were able to freeze-in the most disordered sodium configuration proving that even short range sodium correlations are sufficient to sustain low temperature magnetic order.
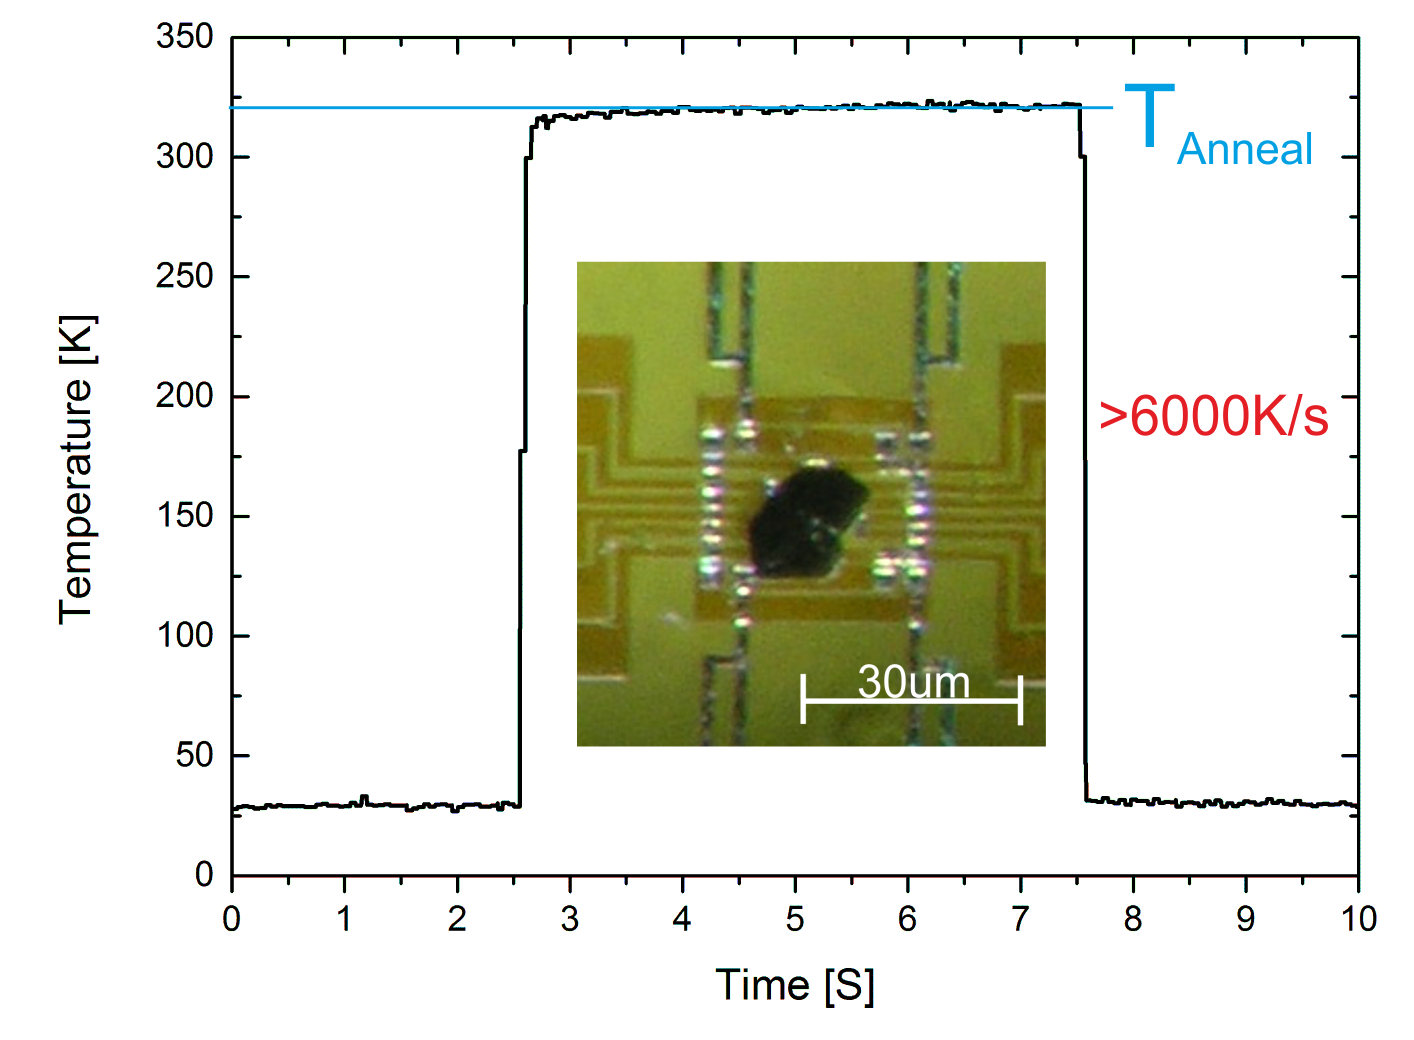
The difficulty in comparing the low temperature magnetic order with sodium superstructures lies in the fact that they can change upon cooling through the structural transitions of the underlying lattices making the magnetic structures that could rise due to high temperature sodium ordering inaccessible in standard experiments (Schulze et al., 2008). To overcome this difficulty we have employed a membrane calorimeter (Xensor Inc. (van Herwaarden, )). With this setup samples as small as 10-100 ng could be measured and more importantly the temperature could be varied with heating and cooling rates up to 6000 K/s enabling us to effectively freeze-in the high temperature Na structures. Such fast cooling rates were achieved by keeping the cryostat at 30 K and then passing a current pulse through one of the resistors on the sample stage. A typical thermal cycle curve is shown in Figure 1.
The calorimetric measurements were performed using the 3ω method (Sullivan and Seidel, 1968; Kohama et al., 2010) and were cross-checked with standard measurements on large crystals from the same batch performed on the Quantum Design PPMS specific heat option. The crystals were grown by the floating zone method (Prabhakaran et al., 2004), the sodium content was determined using the known relation between c-axis length and sodium concentration (Schulze et al., 2008; Berthelot et al., 2011; Viciu et al., 2006). The crystal structure and the sodium super lattices were characterized using the in-house Bruker Apex SMART II single crystal diffractometer equipped with an Oxford Instruments temperature control system.
In the following we present results of three experiments showing the relation between low temperature magnetic ordering and high temperature sodium ordering. In the first section quenching the sample from different high temperatures is shown to yield different low temperature states. This is followed by a short discussion of sodium dynamics and how different sodium structures evolve from one into the other. As the last result we show X-ray Laue diffraction patterns directly relating different low temperature magnetic states to certain high temperature sodium states.
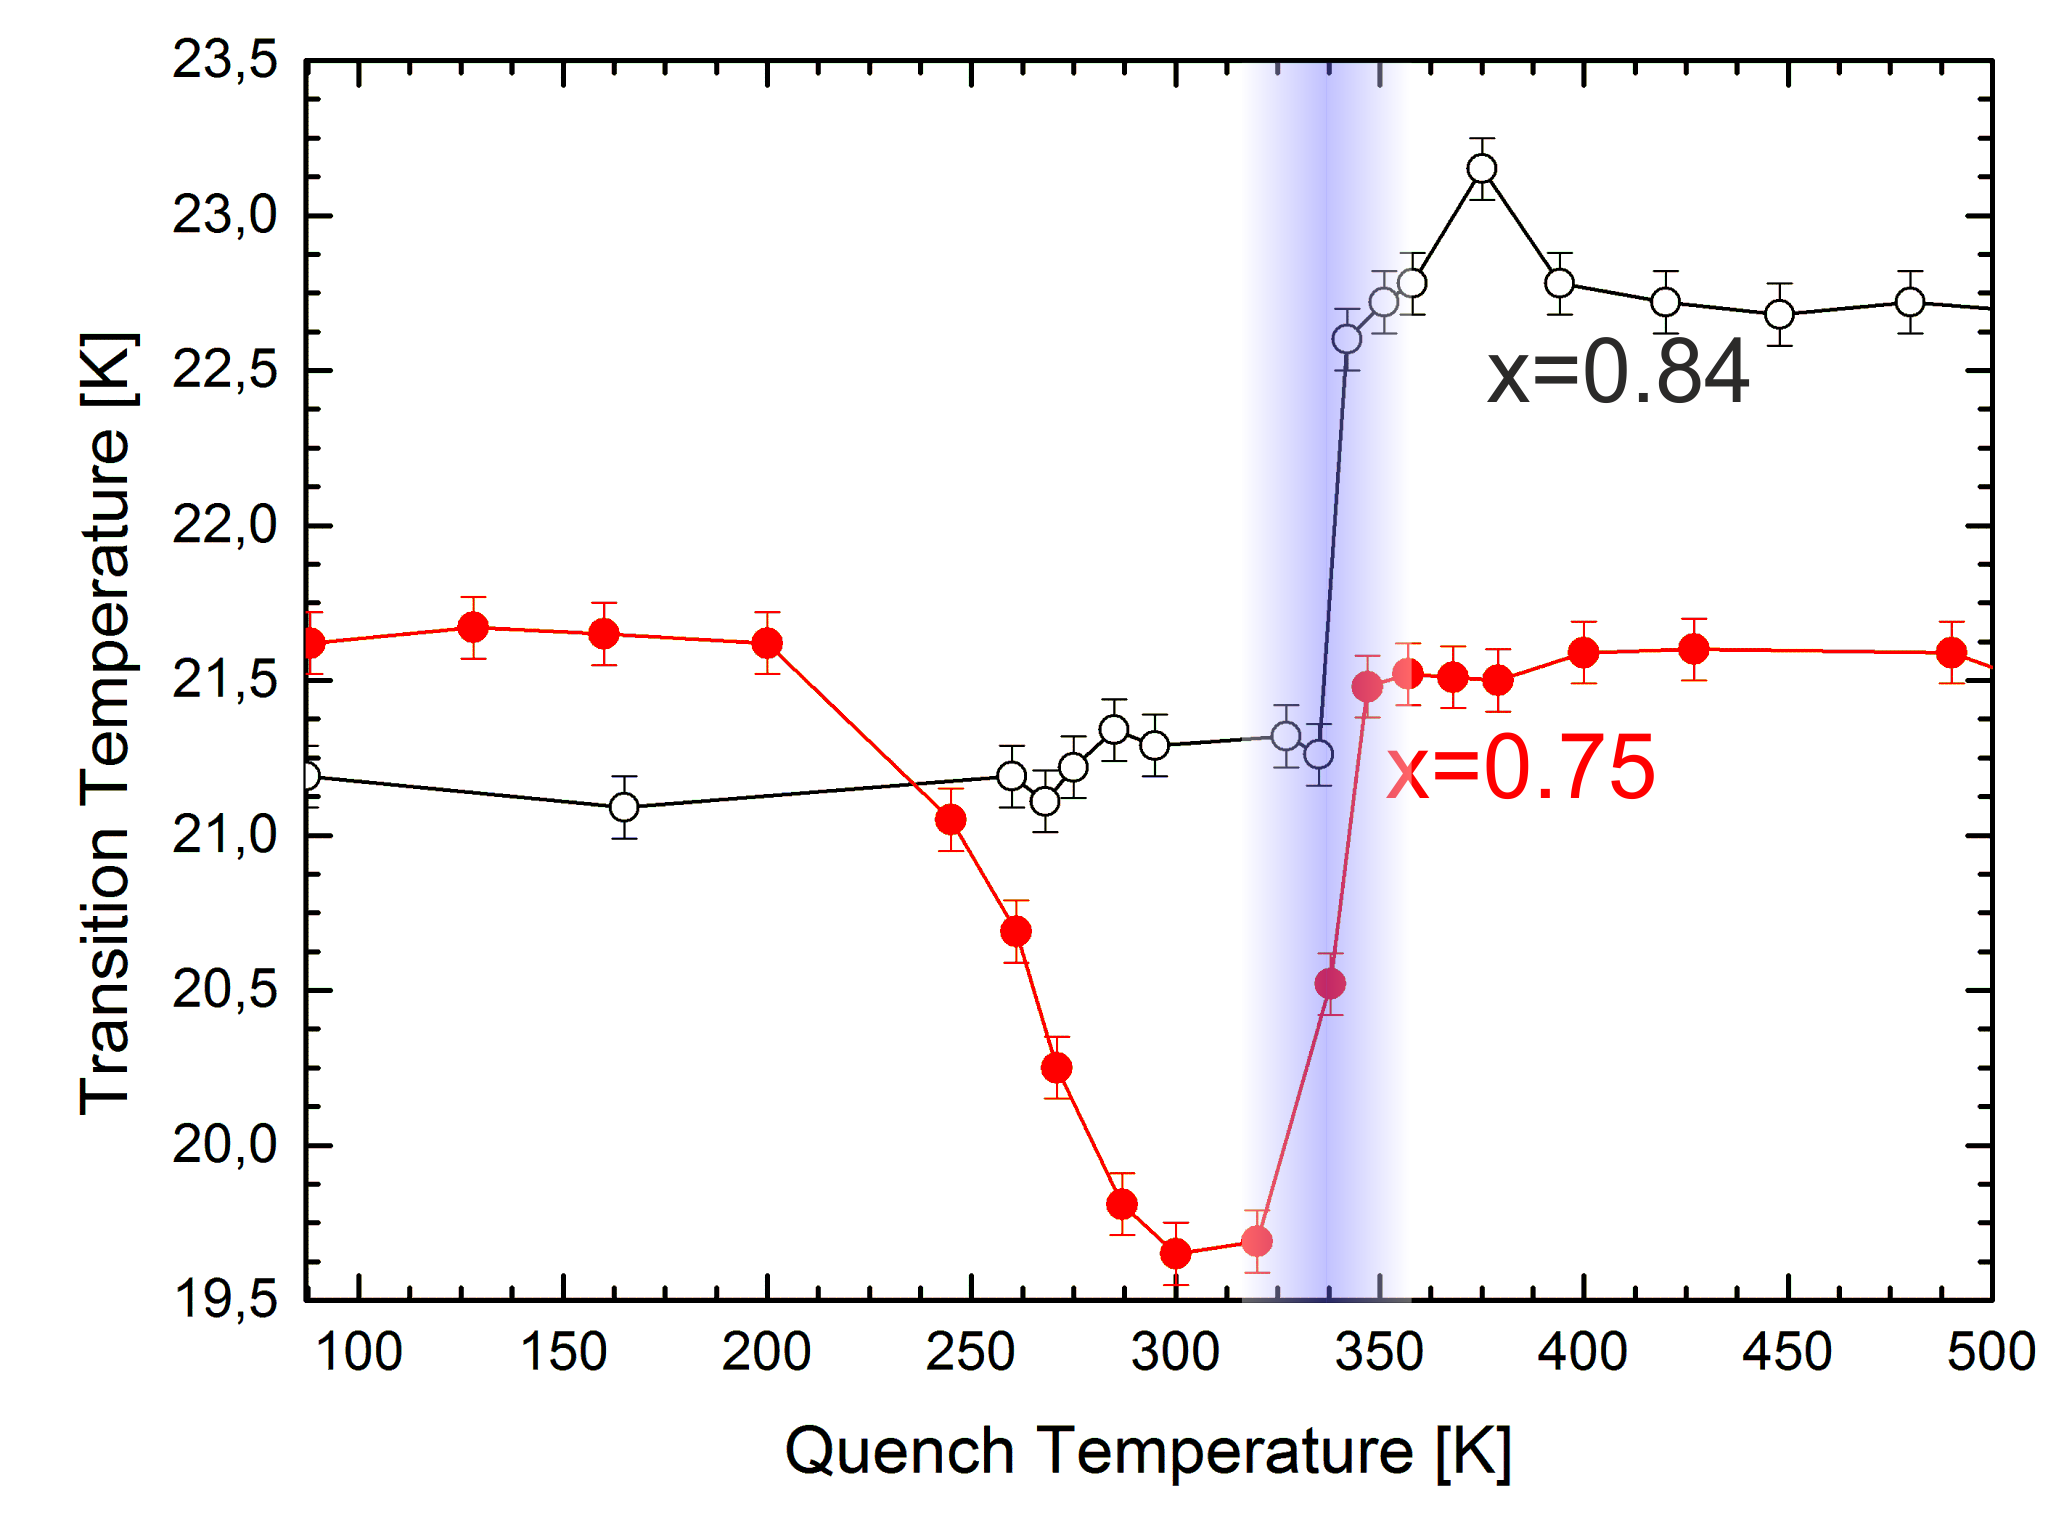
To establish the boundaries defining the relation between magnetism and sodium ordering in Na0.84 CoO2 we have performed a series of annealing experiments. The sample was initially slowly cooled (1K/min) from 300 K to 30 K and then annealed for 5 seconds at successively higher temperatures with subsequent quenching back to 30 K for specific heat measurements. Thanks to the fast cooling rates (over 6000K/s figure 1) a direct mapping was possible between sodium configurations characteristic for particular elevated temperatures and the low temperature magnetic state they would induce in the CoO2 layers. Three distinct magnetic phases can be induced in the same Na0.84CoO2 crystal by freezing-in different Na configurations (Figure 2, left panel). When the sample is cooled down slowly or annealed at temperatures between where the temperature activated sodium mobility becomes visible on the scale of minutes and 286 K the magnetic state is characterized by two specific heat peaks at 8K and 21.5K. On subsequent annealing at slightly higher temperatures the 8 K peak diminishes slowly and another begins to form at 15K. This change coincides with the previously reported structural transition taking place at around 290 K, it separates the ’low temperature’ and ’intermediate temperature regions’.
The magnetic order associated with the sodium structure above 336K, the ’high temperature’ region, is yet different: all transitions previously reported (Schulze et al., 2008; Mendels et al., 2005) are suppressed and replaced by a single specific heat anomaly at 23 K. We have annealed the sample up to 770 K and found no further modification of the low temperature magnetic state.
In the same way we have also studied another composition - Na0.75CoO2 and observed less spectacular changes in the low temperature magnetism: a slight suppression of TN for the sodium configuration in the 250-330 K range, figure 3.
To better understand the dynamics and evolution of sodium structures we have performed an annealing experiment in which the sample was prepared in the high temperature state by quenching it from 425 K and then annealed for short periods of time at 180K with its low temperature specific heat probed between the annealing steps. At 180 K Na is barely mobile enough to rearrange to the equilibrium configuration after hours of annealing, so that transient magnetic states can be monitored precisely (Figure 2, right panel).
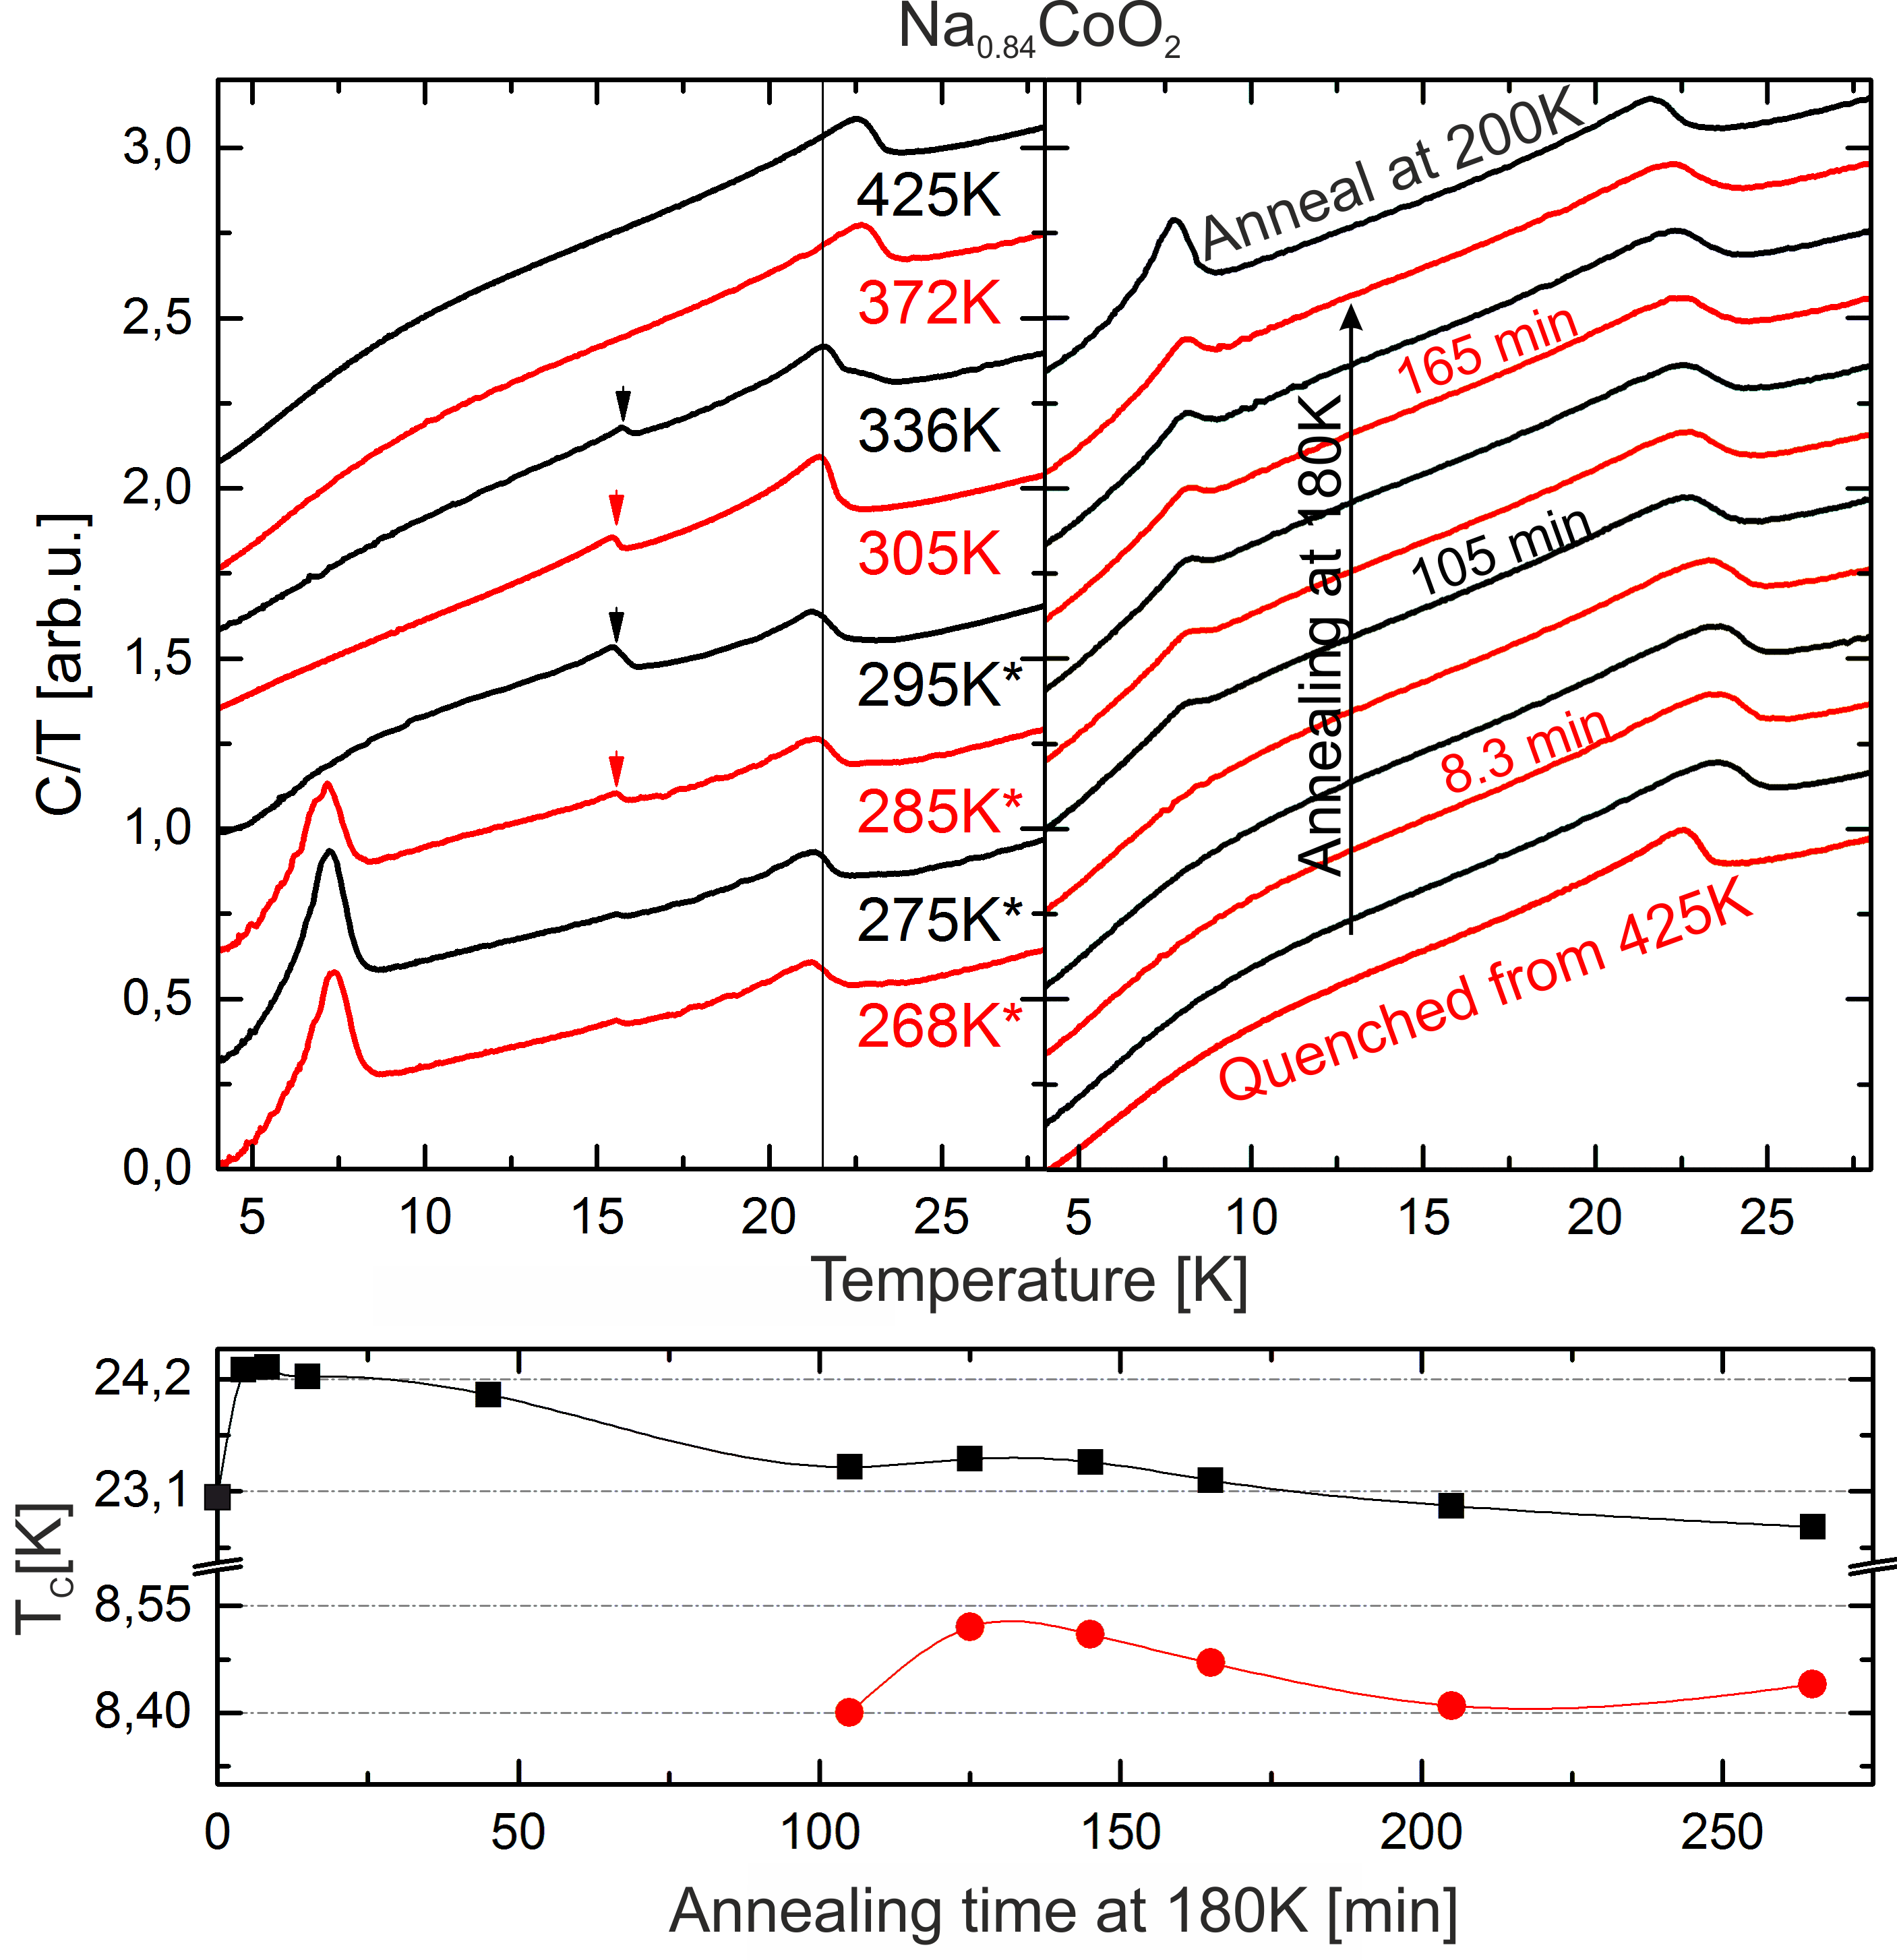
The most striking observation is that the 22 K and the 23 K peaks seem to be continuously connected. Except for the rapid change in the first 4 minutes of annealing, the shape of the specific heat anomalies and the critical temperature vary very slowly (figure 2, bottom panel). Surprisingly this abrupt evolution, increased the transition temperature to 24 K. One explanation of this phenomenon might be that in the first minutes of annealing the sodium atoms just move to the higher symmetry position between the Co atoms (Huang et al., 2004) without moving far from the position they were frozen-in. This way the exchange slightly strengthens while maintaining the general high temperature sodium structure.
More interestingly the 8 K magnetic state evolves from the 22 K in a direct way without the appearance of the ’intermediate’ 15 K peak. Furthermore once the 8 K phase starts to emerge its transition temperature evolves smoothly in direct correlation with the variations of the peak at 22-24 K (figure 2, bottom panel), suggesting that if there is any phase separation it will be on a scale short enough for both phases to interact.
After having established the three temperature regions associated with different magnetic order we searched for Na ordering patterns performing XRD experiments at temperatures between 260 K and 360 K on both x=0.75 and x=0.84 samples. Indeed we have found distinct super lattice reflections that are directly linked to these regions.
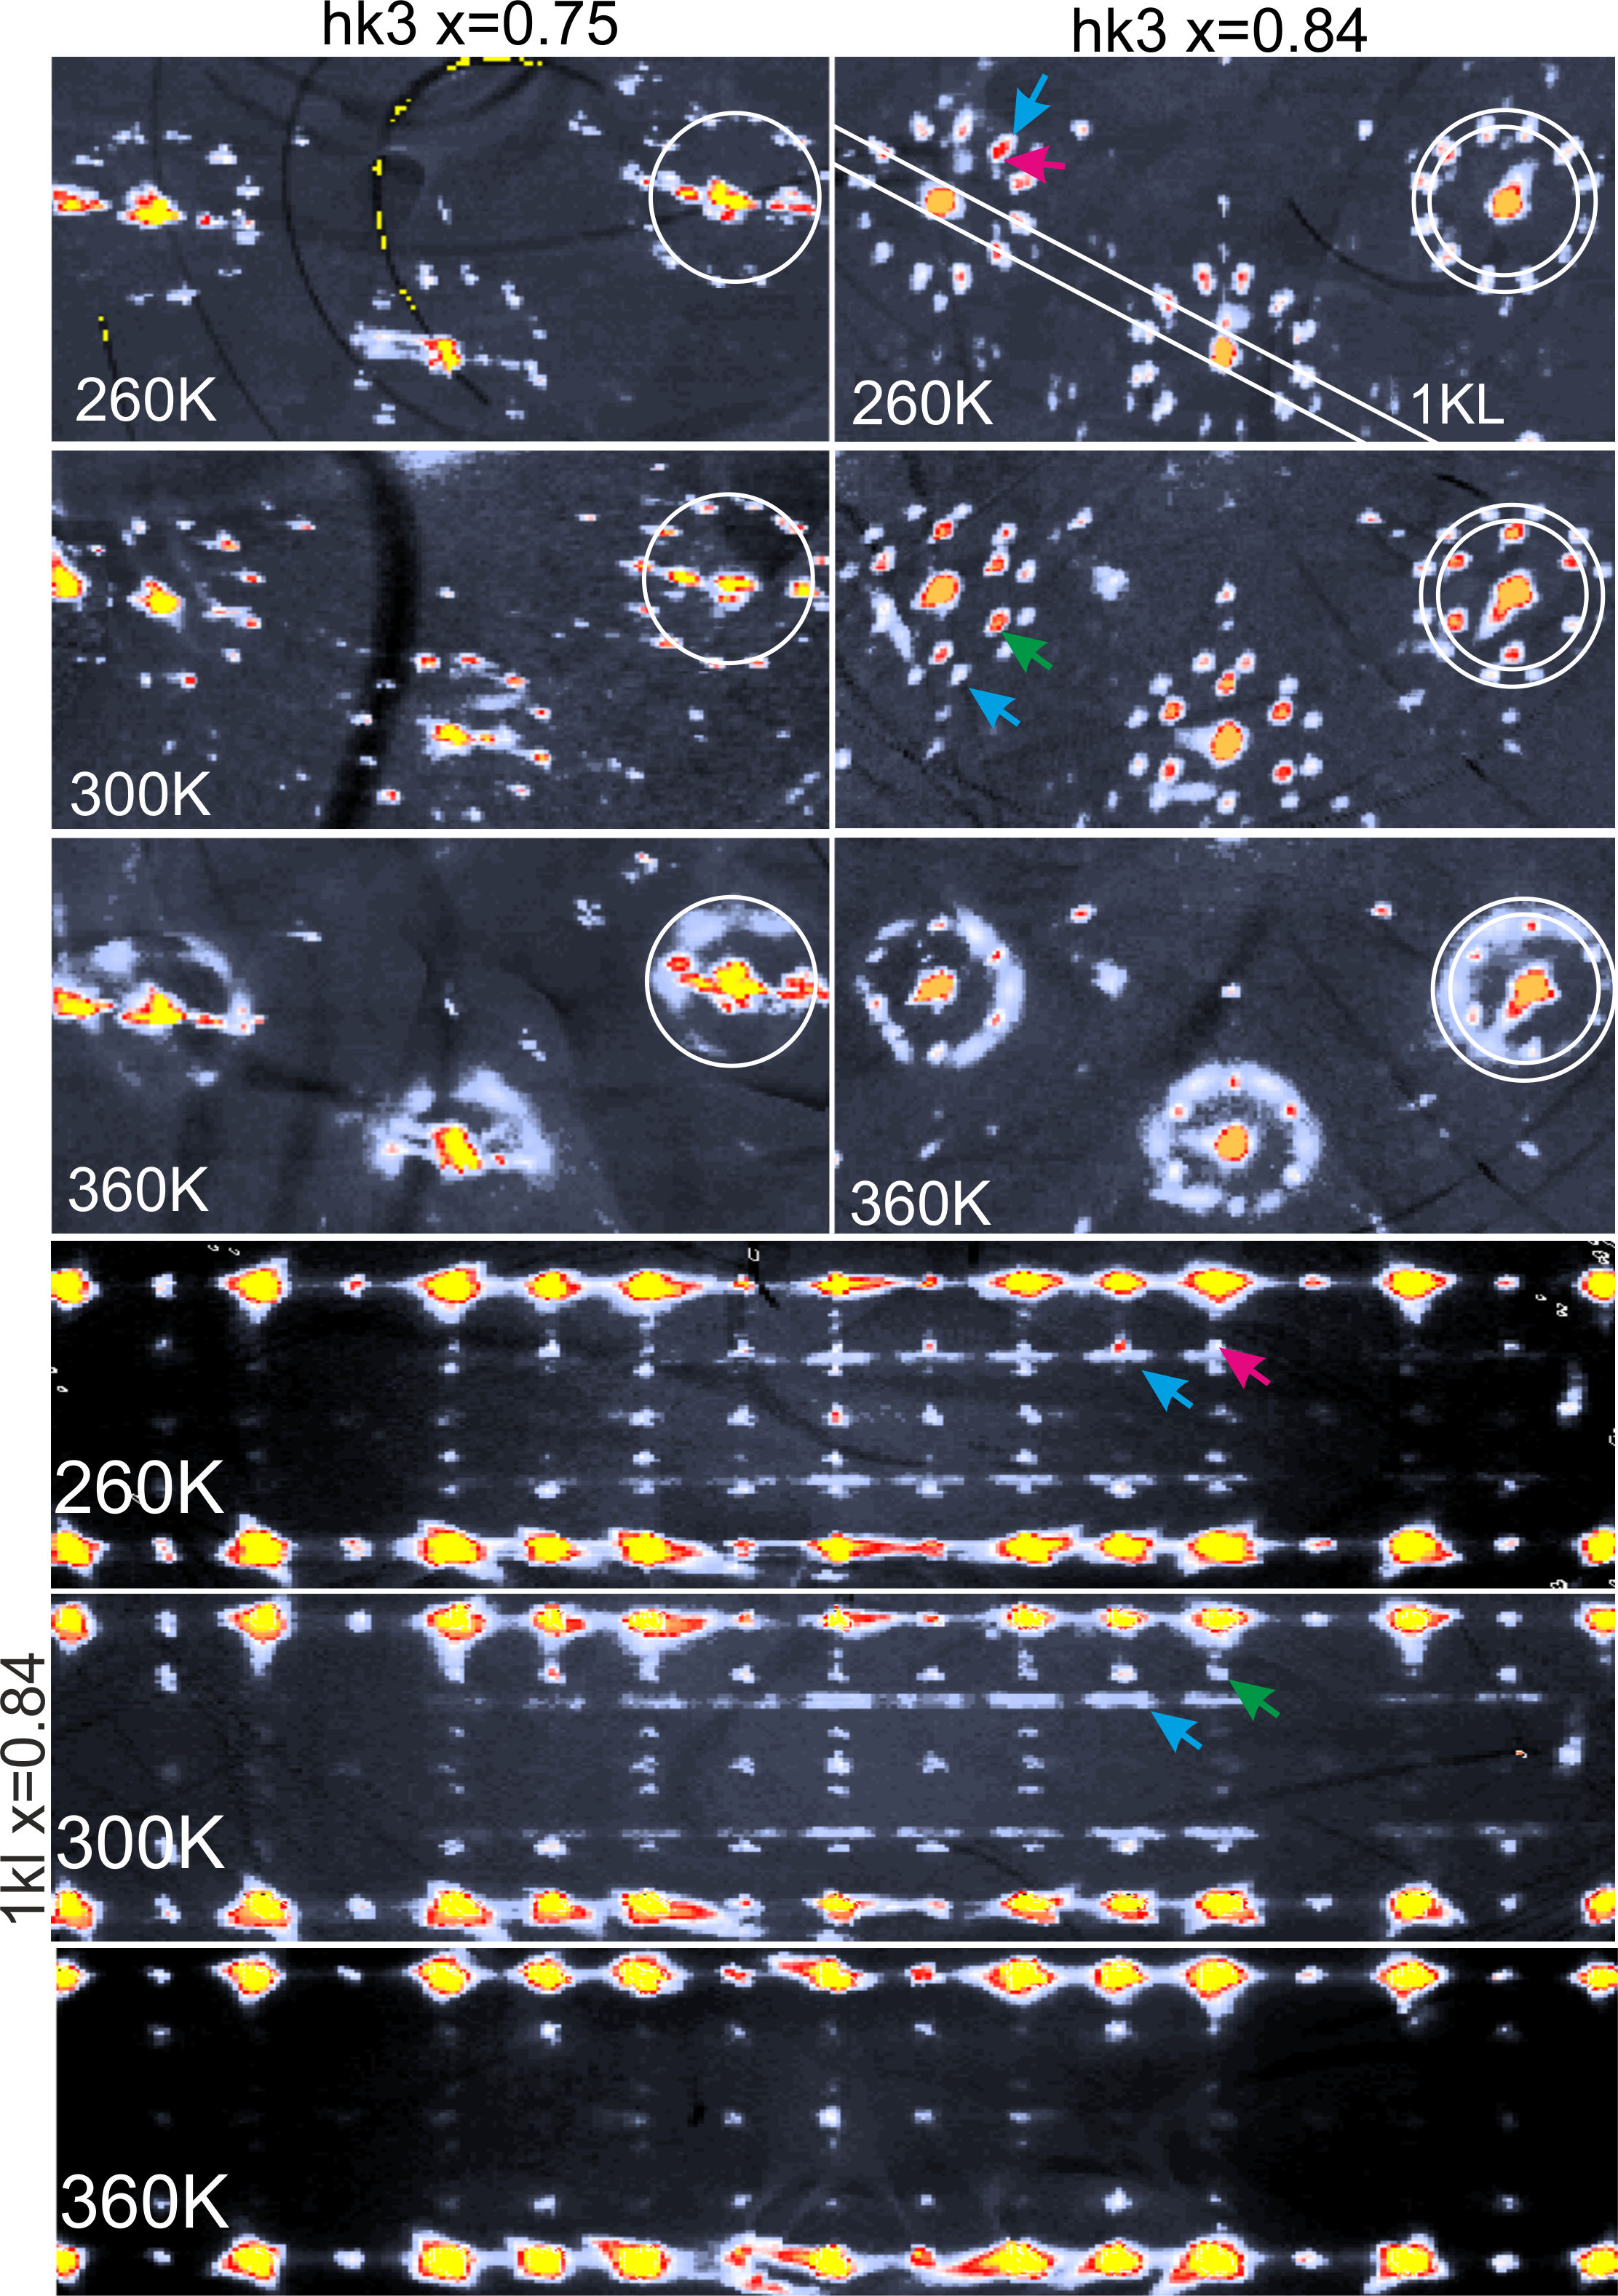
For x=0.84 below 290K the Bragg peaks belonging to the CoO2 lattice are surrounded by superstructure reflections which form two ’rings’ of twined superstructures, as indicated by in the upper row of figure 4. The superstructures can be indexed as tri- and di- vacancies (x=11/13=0.8462 and x=16/19=0.8421 respectively), on a hexagonal lattice with unit vectors and rotated by 2.5 and 15.9 degree with respect to the original unit cell vectors. On crossing the 290 K structural phase transition the twin reflections merge into a ’hexagon of hexagons’ pattern (Morris et al., 2009).
Even more pronounced changes occur above 335 K - a nearly complete disappearance of superstructure Bragg peaks. Although there seems to be a reminiscence of the hexagon of hexagons patten its intensity is suppressed (figure 5 right third panel from the top). Instead of a series of sharp Bragg peaks a blurred halo develops around the main reflections. This is an indication of the melting of the sodium superstructure lattice, and a formation of what could be called a correlated sodium vacancy liquid: A state in which the sodium vacancy droplets are still present due to Coulomb repulsion but without angular ordering on the scale probed in an XRD experiment. At the same time the average sodium structure modulation length increases as best seen by comparison with the white circles.
An inspection of the 1kl cuts of the reciprocal space reveals more details about the superstructures: Well defined sodium ordering is present also along the c-axis. In particular the tri-vacancy layers follow the periodicity of the crystal (red and green arrows). On the other hand the location of the di-vacancy peaks suggests an additional modulation tripling the original unit cell height in accordance with previous findings (blue arrows)(Shu et al., 2009).
Sodium superstructures for x=0.75 are slightly different: there is no detectable change on crossing 290 K, possibly due to resolution limitations of our setup: the crystallographic transition at 290K is very subtle (Medarde et al., 2013), thus the possible superstructure modification is expected to be miniscule. However melting of the sodium superstructures above is 335 K still present.
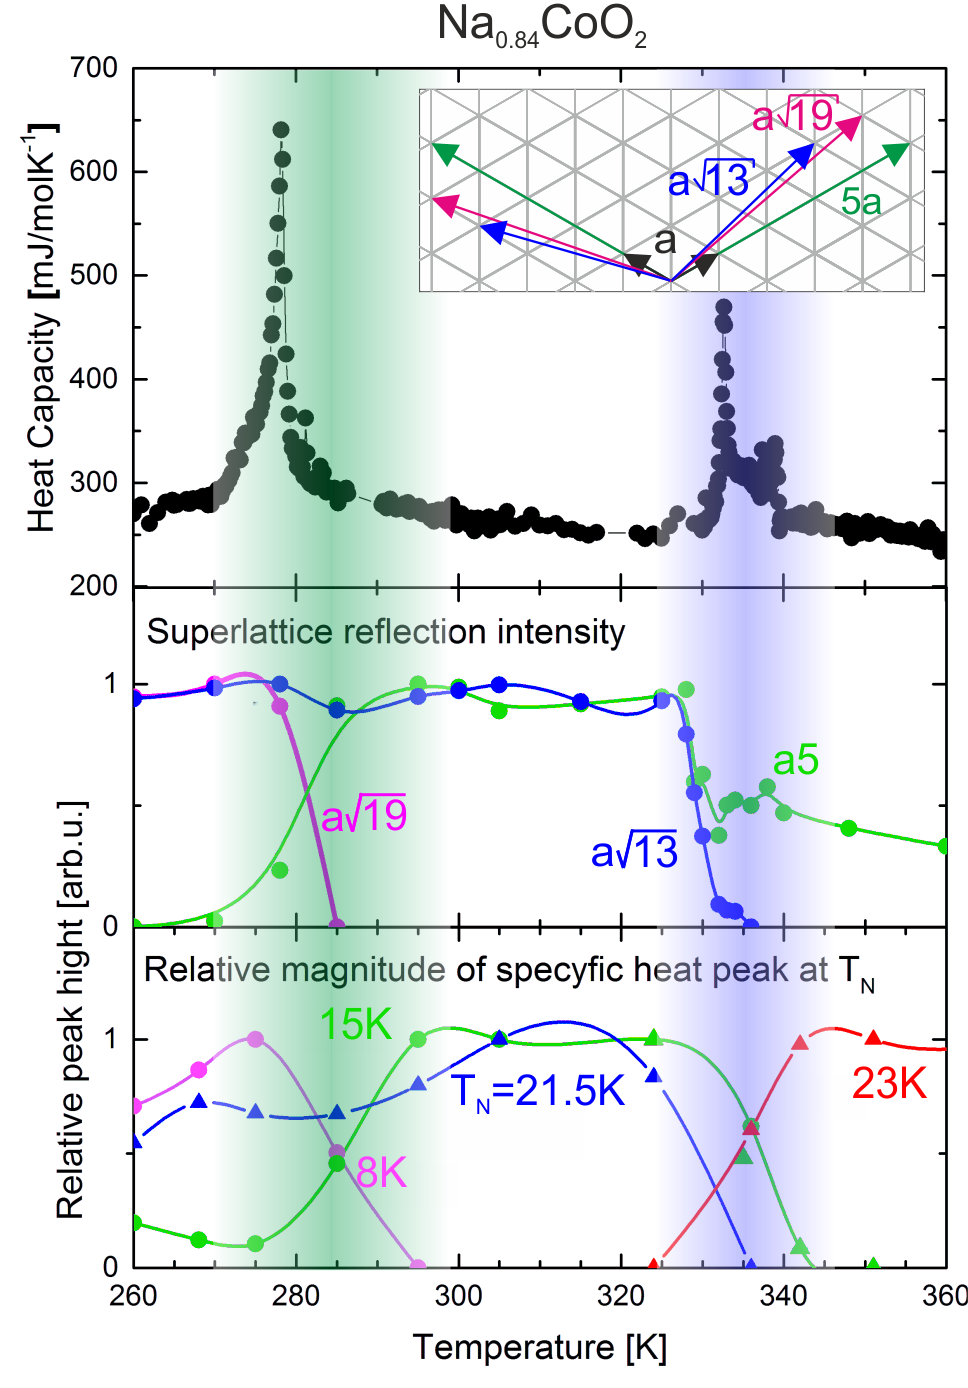
Figure 5 summarizes the salient features of the structure and heat capacity studies as a function temperature:reflection intensities for various super-lattice peaks, specific heat peaks heights for various magnetic orderings and the specific heat anomalies that mark the boundaries between three discussed temperature regions.
The specific heat anomaly around 280 K coincides with the known structural transition of the unit cell from orthorhombic to monoclinic. At this point it is not clear weather the 290 K peak is associated directly to the CoO2 lattice transition or with the sodium rearrangement.
No structural transitions of the CoO2 units were reported for the 335 K region (Medarde et al., 2013), however, neutron powder diffraction studies suggested a movement of Na ions away from the most symmetric position in the unit Co - triangles (Huang et al., 2004). This supports the proposed emergence of a sodium vacancy liquid.
The central result of this study is shown in figure 5: the super-lattice peak intensities and the specific heat anomalies, signatures of magnetic states are closely correlated. In particular the 8 K transition is related to the superstructure which disappears at 290K replaced by a 5a superstructure pattern responsible for the magnetic order at 15 K.
This pattern as suggested by Morris et al. (Morris et al., 2009) could indicate a formation of disordered sodium vacancy stripes. These stripes would in a natural way lead to the modification of the effective dimensionality of the magnetic interactions, thus explaining the observed pronounced magnetic fluctuation tail preceding the 15 K transition (Kanter, 2015).
On cooling the 290 K transition involves a locking in of the modulation direction to the prevalent modulation. In order to stay commensurate with the CoO2 lattice the modulation length slightly decreases from 5a to (inset of figure 5).
The 335 K transition is of a different kind: there is no lattice structural transition and no transition between different superstructures. On crossing the transition temperature superstructure Bragg peaks fade away. Freezing-in of this disordered state could be pictured as creating a sodium vacancy glass and is associated with the disappearance of all so far known magnetically ordered phases and an emergence of a new state with transition temperature of 23 K and with a spin flop transition (Helme et al., 2006) at 12 T (supplementary material). Suggesting that the presence of sodium long range order is not necessary for magnetism to develop.
Our studies show that Na0.84 CoO2 has a strong tendency towards A-type anti-ferromagnetism regardless of the details of the sodium arrangement. Due to the long wavelength of the sodium superstructure modulation and the overall hexagonal symmetry of the sodium patterns the itinerant-electron ferromagnetism in the CoO2 layers would not be significantly altered by modifications of sodium ordering. As was shown through measurements of the magnetic contribution to specific heat, magnetic fluctuations extend well beyond 50K and thus any known 3D ordering temperature (Zorkovská et al., 2005). On the other hand it was shown by Johannes et al. (Johannes et al., 2004) that the strength of the inter-plane interaction is very sensitive to the availability of exchange paths involving sodium sp2 orbitals. In particular the calculations predict the interaction strength to be 35% stronger if the sodium is placed directly under the Co atom (Na(1) position) instead of the centre of the triangle made by the Co atoms - (Na(2) position).
Our XRD results indicate that all the superstructures are well ordered along the c-axis. This suggests that the reason for the occurrence of different transition temperatures is not the modification of the in-plane ferromagnetic fluctuations due to the Coulomb potential or a change of the stacking order of vacancies of different nature (di- tri- vacancies) but the modification of the inter-plane coupling due to the change of relative location of vacancies in adjacent layers: the and 5a superstructures are both tri- vacancy patterns however they induce different TN’s.
In summary we have established the importance of 3D sodium ordering as a key ingredient influencing the electronic properties of NaxCoO2: (1) the sodium intercalation provides the proper electron count sustaining the in-plane ferromagnetism (2) it mediates the antiferromagnetic exchange between the layers. This leads to a picture in which magnetism relies on the proper nesting and electron count as suggested by calculations of Kuroaki et al. (Kuroki et al., 2007a) but the exact value of TNis defined by the nature of sodium ordering.
Additionally we have shown that it is possible to freeze-in the disordered sodium vacancy liquid arrangement. This could allow on one hand to obtain though electrochemical reactions at elevated temperatures samples of arbitrary sodium content and on the other to investigate which phenomena are intrinsic to the CoO2 layers and which are emergent phenomena originating from the interplay of electronic degrees of freedom with the sodium order.
Acknowledgements.
We would like to thank P.J.W. Moll, Y. Sassa and J.Kanter for their input to this work and S. Gvasaliya for his assistance in performing the XRD experiments.References
- Helme et al. (2006) L. M. Helme, A. T. Boothroyd, R. Coldea, D. Prabhakaran, A. Stunault, G. J. McIntyre, and N. Kernavanois, Physical Review B 73, 054405 (2006).
- Kuroki et al. (2007a) K. Kuroki, S. Ohkubo, T. Nojima, R. Arita, S. Onari, and Y. Tanaka, Physical Review Letters 98, 136401 (2007a).
- Mazin and Johannes (2005) I. I. Mazin and M. D. Johannes, Nature Physics 1, 91 (2005).
- Mendels et al. (2005) P. Mendels, D. Bono, J. Bobroff, G. Collin, D. Colson, N. Blanchard, H. Alloul, I. Mukhamedshin, F. Bert, A. Amato, and A. D. Hillier, Physical Review Letters 94, 136403 (2005).
- Schaak et al. (2003) R. E. Schaak, T. Klimczuk, M. L. Foo, and R. J. Cava, Nature 424, 527 (2003).
- Takada et al. (2003) K. Takada, H. Sakurai, E. Takayama-Muromachi, F. Izumi, R. A. Dilanian, and T. Sasaki, Nature 422, 53 (2003).
- Yoshizumi et al. (2007) D. Yoshizumi, Y. Muraoka, Y. Okamoto, Y. Kiuchi, J.-I. Yamaura, M. Mochizuki, M. Ogata, and Z. Hiroi, Journal of the Physical Society of Japan Vol. 76, 063705 (2007).
- Wang et al. (2003) Y. Wang, N. S. Rogado, R. J. Cava, and N. P. Ong, Nature 423, 425 (2003).
- Roger et al. (2007) M. Roger, D. J. P. Morris, D. A. Tennant, M. J. Gutmann, J. P. Goff, J.-U. Hoffmann, R. Feyerherm, E. Dudzik, D. Prabhakaran, A. T. Boothroyd, N. Shannon, B. Lake, and P. P. Deen, Nature 445, 631 (2007).
- Shu et al. (2009) G. Shu, F.-T. Huang, M.-W. Chu, J.-Y. Lin, P. Lee, and F. Chou, Physical Review B 80, 014117 (2009).
- Kuroki et al. (2007b) K. Kuroki, S. Ohkubo, T. Nojima, R. Arita, S. Onari, and Y. Tanaka, Physical Review Letters 136401, 2 (2007b).
- Motohashi et al. (2009) T. Motohashi, T. Ono, Y. Sugimoto, Y. Masubuchi, S. Kikkawa, R. Kanno, M. Karppinen, and H. Yamauchi, Physical Review B 80, 165114 (2009).
- Carlier et al. (2009) D. Carlier, M. Blangero, M. Menetrier, M. Pollet, J. P. Doumerc, and C. Delmas, Inorganic Chemistry 48, 7018 (2009).
- Medarde et al. (2013) M. Medarde, M. Mena, J. L. Gavilano, E. Pomjakushina, J. Sugiyama, K. Kamazawa, V. Y. Pomjakushin, D. Sheptyakov, B. Batlogg, H. R. Ott, M. Månsson, and F. Juranyi, Physical Review Letters 110, 266401 (2013).
- Schulze et al. (2008) T. F. Schulze, P. S. Hafliger, C. Niedermayer, K. Mattenberger, S. Bubenhofer, and B. Batlogg, Physical Review Letters 100, 026407 (2008).
- (16) S. van Herwaarden, Gas Nanocalorimeters: XEN-39390 series technical note, http://www.xensor.nl/ .
- Sullivan and Seidel (1968) P. Sullivan and G. Seidel, Physical Review 173, 679 (1968).
- Kohama et al. (2010) Y. Kohama, C. Marcenat, T. Klein, and M. Jaime, The Review of scientific instruments 81, 104902 (2010).
- Prabhakaran et al. (2004) D. Prabhakaran, A. Boothroyd, R. Coldea, and N. Charnley, Journal of Crystal Growth 271, 74 (2004).
- Berthelot et al. (2011) R. Berthelot, D. Carlier, and C. Delmas, Nature materials 10, 74 (2011).
- Viciu et al. (2006) L. Viciu, J. W. G. Bos, H. W. Zandbergen, Q. Huang, M. L. Foo, S. Ishiwata, A. P. Ramirez, M. Lee, N. P. Ong, and R. J. Cava, Physical Review B 73, 174104 (2006).
- Huang et al. (2004) Q. Huang, B. Khaykovich, F. C. Chou, J. H. Cho, J. W. Lynn, and Y. S. Lee, Physical Review B 70, 134115 (2004).
- Morris et al. (2009) D. J. P. Morris, M. Roger, M. J. Gutmann, J. P. Goff, D. A. Tennant, D. Prabhakaran, A. T. Boothroyd, E. Dudzik, R. Feyerherm, J.-U. Hoffmann, and K. Kiefer, Physical Review B 79, 100103 (2009).
- Kanter (2015) J. Kanter, Private communication (2015).
- Zorkovská et al. (2005) A. Zorkovská, M. Orendáč, J. Šebek, E. Šantavá, P. Svoboda, I. Bradarić, I. Savić, and A. Feher, Physical Review B 72, 132412 (2005).
- Johannes et al. (2004) M. D. Johannes, D. a. Papaconstantopoulos, D. J. Singh, and M. J. Mehl, Europhysics Letters (EPL) 68, 433 (2004).