The Mass Dependence of Star Formation Histories in Barred Spiral Galaxies
Abstract
We performed a series of 29 gasdynamical simulations of disc galaxies, barred and unbarred, with various stellar masses, to study the impact of the bar on star formation history. Unbarred galaxies evolve very smoothly, with a star formation rate (SFR) that varies by at most a factor of three over a period of . The evolution of barred galaxies is much more irregular, especially at high stellar masses. In these galaxies, the bar drives a substantial amount of gas toward the centre, resulting in a high SFR, and producing a starburst in the most massive galaxies. Most of the gas is converted into stars, and gas exhaustion leads to a rapid drop of star formation after the starburst. In massive barred galaxies (stellar mass ) the large amount of gas funnelled toward the centre is completely consumed by the starburst, while in lower-mass barred galaxies it is only partially consumed. Gas concentration is thus higher in lower-mass barred galaxies than it is in higher-mass ones. Even though unbarred galaxies funnelled less gas toward their centre, the lower SFR allows this gas to accumulate. At late times, the star formation efficiency is higher in barred galaxies than unbarred ones, enabling these galaxies to maintain a higher SFR with a smaller gas supply. Several properties, such as the global SFR, central SFR, or central gas concentration, vary monotonically with time for unbarred galaxies, but not for barred galaxies. Therefore one must be careful when comparing barred and unbarred galaxies that share one observational property, since these galaxies might be at very different stages of their respective evolution.
keywords:
galaxies: formation – galaxies: evolution – galaxies: spiral – stars: formation1 INTRODUCTION
Bars are one of the most prominent morphological and evolutionary structures of spiral galaxies. Their presence is quite ubiquitous, with recent observational data consistently establishing a bar fraction somewhere between 30% and 60% in the local universe (Knapen et al., 2000; Martínez & Muriel, 2011; Masters et al., 2011; Lee et al., 2012) and a slightly lesser value at higher redshift (Elmegreen et al., 2004; Sheth et al., 2008; Simmons et al., 2014). Bars create a strong torque on the galaxy (Lynden-Bell, 1979; Athanassoula, 2003) leading to a redistribution of the gaseous and stellar component (Gadotti & dos Anjos, 2001; Grand et al., 2015) and a transport of angular momentum from the inner to the outer regions of the galaxy (Debattista & Sellwood, 2000; Athanassoula, 2003; Martinez-Valpuesta et al., 2006; Kim & Stone, 2012; Łokas et al., 2014; Seidel et al., 2015). These dynamical effects have a wide range of consequences on both the gaseous and stellar content of the galaxy: the central bulge-like stellar component gets heated up (Berentzen et al., 1998; Fathi & Peletier, 2003; Kormendy & Kennicutt, 2004; Athanassoula, 2005; Berentzen et al., 2007), while gas flows from the outer to the inner regions of the galaxy (Combes & Gerin, 1985; Combes & Elmegreen, 1993; Maciejewski et al., 2002; Regan & Teuben, 2004; Baba et al., 2010; Masters et al., 2012; Kubryk et al., 2015). As a result, the radial chemical abundance profile initially flattens (Vila-Costas & Edmunds, 1992; Martin & Roy, 1994; Matteo et al., 2013), and the concentration of gas in the centre of the galaxy increases (Knapen et al., 1995; Sakamoto et al., 1999). The accumulation of gas in the centre eventually triggers an increase in the star formation rate (SFR) (Devereux, 1987; Martin, 1995; Martinet & Friedli, 1997; Alonso-Herrero & Knapen, 2001; Hunt et al., 2008; Coelho & Gadotti, 2011). Simulations have shown that this enhanced star formation activity increases the metallicity of the gas in the central region (Friedli et al., 1994; Friedli & Benz, 1995), thus explaining the origin of the observed break in the slope of the chemical abundance profiles of barred galaxies (Martin & Roy, 1995; Roy & Walsh, 1997; Considère et al., 2000).
These studies reveal the importance of the bar in the secular evolution of the host galaxy. Although the general overview of the impact of a bar on a galactic disc is well accepted, the details of the process, and its dependence on galactic properties, pose many remaining questions. While the presence of a bar often causes an increase of the SFR, several observations show no increase (Pompea & Rieke, 1990; Martinet & Friedli, 1997; Chapelon et al., 1999) or an increase only in early-type spiral galaxies (Ho et al., 1997; James et al., 2009). Recent work with the volunteer-based identification of morphological types by the Galaxy Zoo team showed that the specific star formation rate (SSFR) is anti-correlated with the presence of a bar (Cheung et al., 2013) but at same time the relation between the SFR and the stellar mass seems unaffected by the presence of a bar (Willett et al., 2015). This matter is further complicated by bar strength and length: Early-type spirals tend to have stronger bars (Elmegreen & Elmegreen, 1989; Erwin, 2005; Menéndez-Delmestre et al., 2007), longer bars are redder and situated in redder galaxies (Hoyle et al., 2011), and bar length is correlated with stellar mass, Sérsic index, and central surface star density (Cheung et al., 2013), all of which affect the SFR, though some studies found only marginally higher star formation efficiencies in galaxies with strong bars (Saintonge at al., 2012). The SFR of barred galaxies has also been shown to correlate with the central gas mass (Jogee et al., 2005), and the increase in SFR, or lack thereof, in barred galaxies could be due to a temporarily pre- or post-starburst phase (Martinet & Friedli, 1997). A very recent study by Sandstrom et al. (2016) shows that higher SFRs in the central kpc of barred galaxies are not caused by larger central gas supplies, but instead by much higher star formation efficiencies compared to unbarred galaxies, in contradiction with earlier results by Sakamoto et al. (1999).
Metallicities and gas content have also yielded conflicting results, with wide variations in radial abundance profiles in both gas (Edmunds & Roy, 1993; Oey & Kennicutt, 1993; Zaritsky et al., 1994; Considère et al., 2000) and stars (Pérez et al., 2009; Sánchez-Blázquez et al., 2011; Seidel et al., 2016). Comparison between barred and unbarred galaxies show that the former can have higher central metallicities (Ellison et al., 2011), no significant variations (Cacho et al., 2014; Sánchez-Blázquez et al., 2014), or even lower metallicities than the latter (Dutil & Roy, 1999; Considère et al., 2000). Masters et al. (2012) showed that bars are more common in gas-poor galaxies, but it is unclear if this is due to SFR-related gas exhaustion triggered by the bar, by lower bar formation in gas-rich galaxies or if both gas fraction and bar formation are correlated to environmental effects (Martinez-Valpuesta et al., 2016).
The observational results described above indicate that the effect of a bar on the re-distribution of gas and metals, and subsequent star formation, is a highly complex process that proceeds differently in different galaxies. The mass of the host galaxy, its morphological type, its gas fraction, the strength and length of the bar, and the presence of an AGN are all important factors which can potentially impact the local and global star formation history, the radial migration of stars, the gas enrichment and its flows. In previous work (Martel et al. 2013, hereafter Paper I) we simulated a barred galaxy with a mass comparable to that of the Milky Way, and showed that the presence of the bar causes an important enhancement of the metallicity of gas situated within the central region, defined as a sphere with radius of . We also showed that this enhancement could not be solely attributed to the local star formation in the central region, but that 50% of these metals originated from a different location and flowed toward the centre along the bar.
In the current paper, we extend the work of Paper I by simulating a suite of barred and unbarred galaxies with a range of stellar masses and gas fractions. This work is particularly motivated by the observational result of Ellison et al. (2011) that the SFRs of barred galaxies are enhanced only for galaxies with , where is the stellar mass. In contrast, the metallicity enhancement measured by Ellison et al. (2011) is seen at all stellar masses. The disparity between the central metallicity and the SFR was believed to be due to a fast, starburst-like formation episode in low-mass galaxies while high-mass galaxies retained a high SFR through their evolution. In order to provide a theoretical comparison with the results of Ellison et al. (2011), we simulate isolated barred and unbarred galaxies of various stellar masses between and 10.4 and study the variation as a function of mass of the SFR and gas flows along the bar of both barred and unbarred galaxies. We present our simulation code and our suite of simulations in Section 2. Results are presented in Section 3. Summary and conclusion are presented in Section 4.
2 THE SIMULATIONS
2.1 The numerical algorithm
All the simulations in this paper were performed using the numerical algorithm GCD+ (Kawata & Gibson, 2003; Rahimi & Kawata, 2012; Kawata et al., 2013, 2014). GCD+ is a three-dimensional tree/smoothed particle hydrodynamics (SPH) algorithm (Lucy, 1977; Gingold & Monaghan, 1977) which simulates the galactic chemodynamical evolution, accounting for hydrodynamics, self-gravitation, star formation, supernovae feedback, metal enrichment and diffusion, and radiative cooling. It uses an artificial thermal conductivity suggested by Rosswog & Price (2007) to resolve the Kelvin-Helmholtz instability, and the adaptive softening length suggested by Price & Monaghan (2007). Metal diffusion is computed using the method of Greif et al. (2009), while radiative cooling and heating are handled using tables computed with CLOUDY (Ferland et al., 1998; Robertson & Kravtsov, 2008). Star formation is handled by transforming gas particles into star particles as described in Kawata et al. (2014): if the local velocity of the gas particle is convergent and the density exceeds a given density threshold , the gas particle may transform into a star particle with a probability weighted by its density. The star particles are assumed to consist of stars whose mass follow a Salpeter (1955) initial mass function and the metal enrichment they produce from Type II and Ia supernovae is calculated from Woosley & Weaver (1995) and Iwamoto et al. (1999).
Four main parameters govern the star formation rate and the supernovae feedback (Rahimi & Kawata, 2012) and are fixed as follows: the supernovae energy output , the stellar wind energy output , the star formation efficiency , and the star formation density threshold .
2.2 Initial conditions
For generating the initial conditions of our simulations, we use the same technique as in Grand et al. (2015). The system consists of a dark matter halo which is treated analytically, and a disc made of gas and stars, which are represented by stellar and gaseous particles. We do not include a central bulge in the initial conditions. We set up the stellar particle disc using an exponential surface density profile:
| (1) |
where is the stellar disc mass, its scale length, and the scale height, and and are the radial and vertical coordinates, respectively. The gaseous disc has the same radial exponential surface density, but its height is determined by imposing an initial hydrostatic equilibrium within the gaseous disc. We then set an initial radial metallicity profile in both the stellar and gaseous populations, with the iron abundance being given by
| (2) |
where is in kpc. elements are initially only present in the stellar component and their abundance is given by
| (3) |
We modify the metallicity of each particle by adding a gaussian scatter of to create a local dispersion of their abundances. The star particles are assigned an initial age using an age-metallicity relation . As in Paper I, we do not simulate the evolution of the dark matter halo. Instead, we assume a static halo with an NFW profile (Navarro et al., 1996), which is appropriate for simulations of isolated galaxies.
As we vary the mass of the stellar component of the galaxy, we must adapt all of the other parameters, such as the size of the stellar disc and the mass and size of the gaseous and dark matter components, to follow the expected behaviour. Following Cox et al. (2006), we derive the values of all these parameters using observational or simulated relations between one parameter and the other, thus obtaining an “average” galaxy of a given stellar mass. We first derive the mass of the NFW halo using the results from Moster et al. (2010), who obtained a parametrisation of the ratio between dark matter halo mass and the stellar mass within the halo using abundance matching analysis. This parametrisation takes the form:
| (4) |
where is the halo mass, is a normalisation factor, the transition mass between an evolution as a power of and . We use , , , and as suggested by the best fit in Moster et al. (2010). Instead of attributing directly a scale length to the NFW halo, we fix the concentration parameter to 8 in barred galaxies and 20 in unbarred galaxies. As shown in Athanassoula & Misiriotis (2002) and Paper I, a high concentration parameter stabilizes the simulated disc, preventing the formation of the otherwise naturally-occurring bar. We use the halo mass and scale length to calculate a fixed gravitational potential which will act on star and gas particles through the simulation. By forgoing the dynamical nature of the dark matter halo we can greatly increase our baryonic resolution for a given computational time while having little impact on star formation and gas evolution. The value of the concentration parameter, and the presence of a live dark matter halo, have been shown to influence the rotation speed, size, morphology, and stability of the bar during its evolution (Athanassoula & Misiriotis, 2002; Holley-Bockelmann et al., 2005; Martinez-Valpuesta et al., 2006; Sellwood, 2016). However, their influence are prominent in the long-term evolution of the host galaxy (e.g. over a Hubble time), while we focus here on the shorter-term, initial effect of the bar on the star formation history, i.e. after bar formation. Long-term evolution will be considered in future work.
The scale radius of the stellar disc is calculated using the relation between , the half-light radius, and , the mass of the stellar disc, as found by Shen et al. (2003):
| (5) |
where is a scaling factor, is the characteristic mass of the transition between the relation for lower-mass galaxies and that for higher-mass galaxies. We use , , , and to evaluate the half-light radius for a given mass. Assuming that the half-light radius corresponds roughly with the half-mass radius, we integrate the density profile of the stellar disc (eq. 1) up to to obtain a transcendental relation between and which lets us compute the scale-radius from the disc mass.
Finally, we set the values of the parameters for the gaseous disc using the same relation as Cox et al. (2006),
| (6) |
where both masses are expressed in units. Since this relation has a non-zero initial value, the gas fraction of the galaxies will vary with stellar mass, with low-mass galaxies having a higher gas fraction than high-mass ones. As for the gaseous disc scale length, it is fixed at twice the scale length of the corresponding stellar disc.
2.3 Runs and parameters
| Galaxy | colour | ||||||
|---|---|---|---|---|---|---|---|
| O | 4.0 | 1.72 | 265 | 52 501 | 22 546 | 0.300 | purple |
| A | 5.0 | 2.04 | 299 | 66 584 | 27 244 | 0.289 | black |
| B | 6.3 | 2.45 | 341 | 85 121 | 33 078 | 0.279 | blue |
| C | 7.9 | 2.92 | 389 | 108 210 | 40 008 | 0.269 | turquoise |
| D | 10.0 | 3.51 | 450 | 138 869 | 48 749 | 0.259 | light green |
| E | 12.5 | 4.18 | 519 | 175 774 | 58 748 | 0.250 | dark green |
| F | 15.8 | 5.02 | 609 | 225 010 | 71 426 | 0.241 | yellow |
| G | 20.0 | 6.03 | 726 | 288 333 | 86 901 | 0.231 | red |
| H | 25.0 | 7.17 | 872 | 364 460 | 104 583 | 0.222 | burgundy |
| I | 50.0 | 12.30 | 1848 | 752 656 | 185 430 | 0.197 | brown |
We performed an initial series of 19 simulations of isolated galaxies, evolving over a period of . Since one of our goals is to understand the origin of the transition in the SFR described in Ellison et al. (2011), we sample masses both inferior and superior to this transition value, with stellar masses going from to 10.4. Note that the most massive barred galaxy has the same mass as the ones simulated in Paper 1. We simulated 9 galaxies with stellar masses ranging from to . We name these galaxies O-A-B-C-D-E-F-G-H. For each mass, we performed two simulations. In the first simulation, we used a dark matter halo with a concentration parameter to allow a bar to form naturally due to instabilities In the second simulation, we increased the concentration parameter to . This stabilizes the disc and prevents the formation of a bar (see Paper I). Hence, for each global stellar mass, we have two galaxies, a barred one and an unbarred one. However, we also want to compare galaxies with comparable central stellar mass (the mass inside the central region). Because barred galaxies have a higher central mass density at fixed than unbarred ones, we performed one additional simulation of an unbarred galaxy with a stellar mass , named galaxy I. This galaxy achieves a similar central mass as runs G and H. The number of particles in each simulation is chosen in order to have a comparable mass resolution in all simulations while maintaining a reasonable number of particles for both low-mass galaxies, as a minimal number of particles are needed to have realistic results, and high-mass galaxies, where computing time limits our maximal number of particles.
The values of the parameters are shown in Table 1. , , and are the initial stellar mass, initial gas mass, and virial mass of the galaxy, respectively, and are the initial number of star and gas particles, respectively, and is the initial gas fraction. The last column refers to the colours used throughout the figures of this paper to distinguish the various runs. We use a heat colour-coding where bluer, colder colours represent low-stellar mass galaxies and red, hotter colours represent more massive ones. Notice that , , and evolve with time as gas in converted into stars. The values in Table 1 are the initial values, which are the ones appearing in equations (1)–(6). In the remainder of the paper, the symbols , , and refer to the values at the epoch of interest.
3 RESULTS
3.1 Global properties
3.1.1 Bar Strength
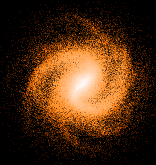
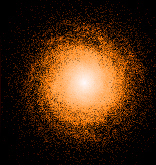
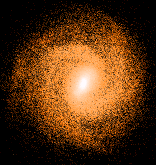
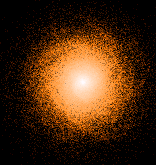
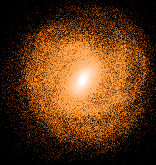
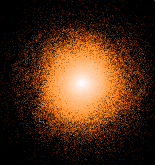
Figure 1 shows the distribution of stars at three different times, for galaxy H (barred and unbarred). At (top left panel), the bar and spiral arms are clearly visible in the barred galaxy. Visually, the length and ellipticity of the bar appears to remain roughly constant up to (bottom left panel), while the spiral pattern is getting more diffuse. By contrast, the unbarred galaxy shows hardly any structure.
Bar strength has been shown to be a particularly important parameter in the evolution of barred galaxies, having a major impact on both the SFR history and the gas mixing (Athanassoula, 2003; Buta et al., 2005; Hoyle et al., 2011; Scannapieco et al., 2010; Wang et al., 2012). Several different definitions have been proposed to quantify bar strength, either through angular momentum transfer (Buta et al., 2005; Grand et al., 2012), ellipse-fitting, or Fourier analysis (Aguerri et al., 2009). In this paper we calculate bar strength using a method proposed by Athanassoula & Misiriotis (2002), based on the components of the Fourier decomposition of the azimuthal distribution of particles. The components and are given by :
| (7) | |||||
| (8) |
where is the number of particles within a radius and is the azimuthal angle of the particle . We compute and for different radii and define the bar strength as
| (9) |
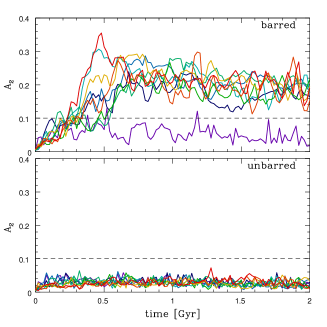
This is the amplitude of the mode, normalized to the mean density. In Figure 2 we present the evolution of the bar strength as a function of time for both barred and unbarred galaxies. The top panel shows that most galaxies we consider as barred have an average bar strength of at all times past . Galaxies H and D have a faster-than-average increase and higher magnitude of their bar strength, peaking at almost at , but their strength fall off to the average value within . The exception is the lower-mass galaxy O, which has no significant bar. Generally speaking, all our barred galaxies with the exception of galaxy O have similar bar strength values and history.
In contrast to barred galaxies, all our galaxies marked as unbarred do not have any significant azimuthal periodicity, indicating that none of them have anything close to a clear bar structure. In the reminder of this paper, we will use as the transition between barred and unbarred galaxies. Hence, in a situation when increases with time, the value corresponds the onset of bar formation. This choice is somewhat arbitrary, but not critical as the value of tends to increase rapidly during bar formation.
3.1.2 Star Formation Rate
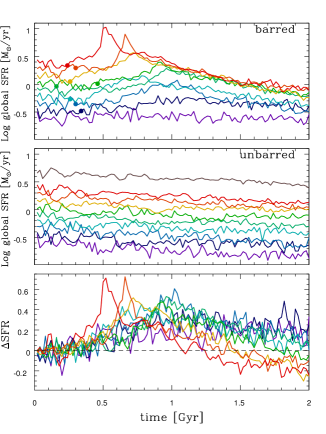
Figure 3 shows the global SFR in barred and unbarred galaxies as a function of time as well as the difference between them. The SFR in barred galaxies (top panel) remains constant or decreases slowly until the bar forms somewhere between and (big dots in top panel show the point where the bar strength , defined as the onset of bar formation). Once the bar is present, high-mass galaxies experience a rapid increase in star formation, which we shall refer to as a starburst, with the SFR reaching its maximum value somewhere between 0.5 and . Among these high-mass galaxies, the highest-mass ones (F-G-H) not only show a much stronger increase of their SFR, reaching over 400% of the initial levels, but the SFR peaks earlier, between 0.5 and . In contrast, the low-mass galaxies A-B-C show a gentler and slower increase in their SFR, peaking around with a SFR about twice as large as the initial one. After the peak is reached, the SFR decreases with time at a rate that is roughly the same for all galaxies. Note that in the lowest-mass galaxy O, the bar never formed, and the SFR slowly decreases with time.
The SFR in unbarred galaxies (middle panel) varies very smoothly. It either remains constant or decreases slowly, dropping by a factor of 2 over . As expected, both sets of galaxies show very similar SFRs until the bar forms. The lower panel of Figure 3 shows the difference SFR between barred and unbarred galaxies. Star formation tends to be significantly enhanced by the presence of a bar. Also, notice that even though barred galaxy O does not reach a bar-qualifying value, it still has a higher SFR than its unbarred counterpart, implying that even modest deviations from axisymmetry can be sufficient to feed gas inflows toward the centre. While SFR remains positive at low and intermediate masses, it eventually becomes negative at high-masses (galaxies E-F-G-H). The rapid decreases in SFR after the starburst results in SFR becoming negative at late times. The post-starburst decrease in SFR in massive barred galaxies is caused by gas depletion, as we showed in Paper I. Recall that all of our galaxies are isolated simulations that are not embedded in a cosmological context. Accretion and mergers could potentially replenish the supply of gas, affecting the late-time evolution of the galaxy. We will investigate these processes in future work. For now, we will simply remember that the post-starburst SFR might not apply to all barred galaxies, and should be regarded as a lower limit.
3.2 Central properties
We now focus on the dynamics of the central region of our galaxies, which we define as a 1 kpc radius cylinder, parallel to the rotation axis of the galaxy and aligned with the center of mass of the stellar component. This central region is where most of the bar-driven gas accumulates, and roughly corresponds to the zone covered by an optical fibre of the SDSS. For redshifts , a 3 arcsecond fibre diameter corresponds to a physical radius of (for a concordance CDM model with , , ). Gas and stars located inside the bar move along elongated orbits, entering and exiting the central region, and these orbits evolve as angular momentum is being redistributed. The collisionless stellar component of the bar stabilises after bar formation (see Fig. 1), while the orbits of the gas elements contract with time. This causes a net increase of the gas mass inside the central region, as more gas moves in than moves out. Eventually, the gaseous component of the bar is entirely contained inside the central region, and from that moment this region behaves as an isolated system, with negligible gas flows across its boundary. In Table 2, we give the stellar mass in the central region at the end of the simulations. Not surprisingly, the numbers increase with increasing initial stellar mass, and are larger for a barred galaxy than for an unbarred one with the same initial stellar mass. The unbarred galaxy H has a final central stellar mass of , similar to barred galaxy E. This was our rationale for simulating the high-mass unbarred galaxy I, to provide a basis for comparison with the massive barred galaxies F, G, and H.
| Galaxy | Barred | Unbarred |
|---|---|---|
| O | 1.14 | 0.84 |
| A | 1.73 | 1.04 |
| B | 2.21 | 1.28 |
| C | 2.77 | 1.58 |
| D | 3.58 | 1.96 |
| E | 4.12 | 2.35 |
| F | 5.55 | 2.89 |
| G | 6.63 | 3.55 |
| H | 8.89 | 4.25 |
| I | 7.67 |
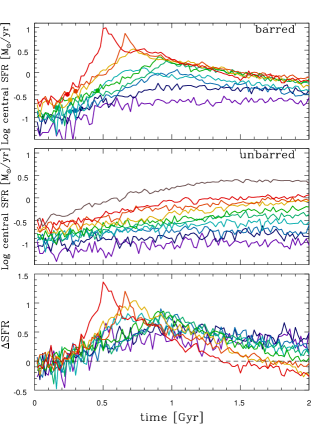
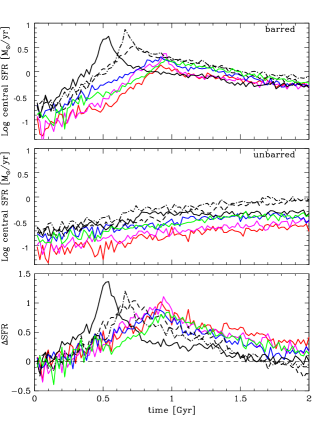
We plot the SFR within the central region as a function of time in Figure 4 for barred and unbarred galaxies, as well as the difference SFR between them. All barred galaxies start with a relatively low SFR until the bar forms. Then, the net influx of gas caused by the bar increases the gas mass in the central region, with a corresponding increase in SFR. As for the global SFR, the central SFR peaks between and , depending on the mass of the galaxy, with high-mass galaxies peaking earlier than low-mass ones. The SFR then decreases smoothly for the massive galaxies while remaining almost constant in the low-mass ones such as O and A. When compared with global SFR (Fig. 3), central SFR starts out much lower but it rises very fast in barred galaxies, dominating the global behaviour by . In contrast, the evolution of central SFR of unbarred galaxies is much smoother. While there is a slight increase with time, the amplitude and fluctuations of the SFR are much smaller than the ones in barred galaxies.
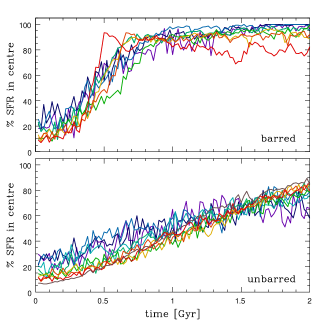
To contrast the evolution of the global and central SFR, we plot in Figure 5 the fraction of star formation happening in the central region. All barred galaxies follow a similar evolution, independently of their stellar mass. During the first , low-mass galaxies have a higher fraction of their global SFR going on in the central region because this region covers a greater fraction of the total area of low-mass galaxies than it does in high-mass galaxies. At , the bar has formed, and star formation becomes more dominated by activity in the central region. In less than more than 75% of the galaxy’s new stars are formed in the central region. All unbarred galaxies also follow a similar evolution, independently of their stellar mass. During the first , the SFR follows the one in barred galaxies because the bar in those galaxies has not formed yet. Afterward, the SFR increases smoothly, and star formation is concentrated predominantly in the central region at late times. While the fraction steadily increases to 75% through the simulation, it does so in a gentle manner, suggesting a smooth and continuous inflow of gas instead of massive one as the ones in barred galaxies.
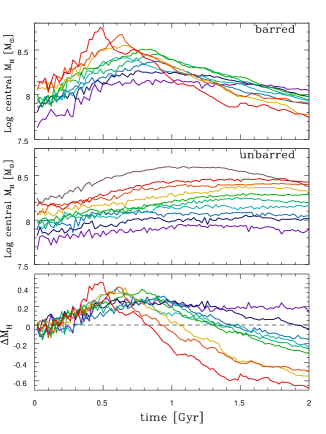
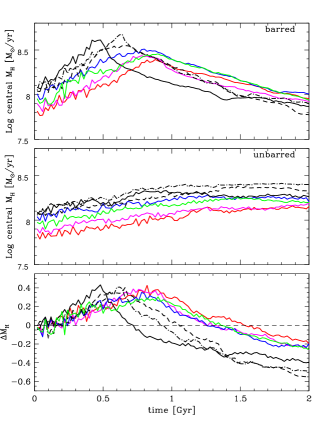
Figure 6 shows the evolution of the hydrogen mass inside the central region as a function of time. In barred galaxies, gas flows along the bar during the first , increasing the central value of . Then, star formation consumes the gas, reducing the value of . The gas consumption varies greatly with the total stellar mass: the central region of high-mass galaxies first gets a higher and faster influx of gas as the bar forms, but it also consumes a much greater fraction of the gas with time, depleting the central region of gaseous content. In the extreme cases of galaxies A (black) and H (burgundy), galaxy A ends up with more hydrogen gas in the central region than galaxy H, even though galaxy H starts with three times as much gas.
The results shown in Figure 6 elucidate the differences in SFR as a function of seen in Figures 3 and 4. High-mass galaxies get a huge amount of gas driven in their core by the bar which cause a starburst-like increase in the global SFR. After , the bar has already moved most of the gas inside the galactic core, leaving the galaxy partially gas-depleted, which then brings the SFR down. Low-mass galaxies do not move enough gas to create a starburst; most of the gas also flows in the central region within the first but it accumulates in the central region and is slowly transformed into stars, leaving a sightly decreasing amount of gas and a corresponding flat SFR. To illustrate the accumulation of gas in the center of unbarred galaxies, we plot in the bottom panel of Figure 6 the difference . The values initially increase, as barred galaxies drives gas efficiently toward the center. Then, the starburst taking place in barred galaxies results in a large consumption of gas, and eventually becomes negative at all masses except the lowest one. The effect is particular strong at high masses (galaxies F, G, and G), where the starburst is the strongest.
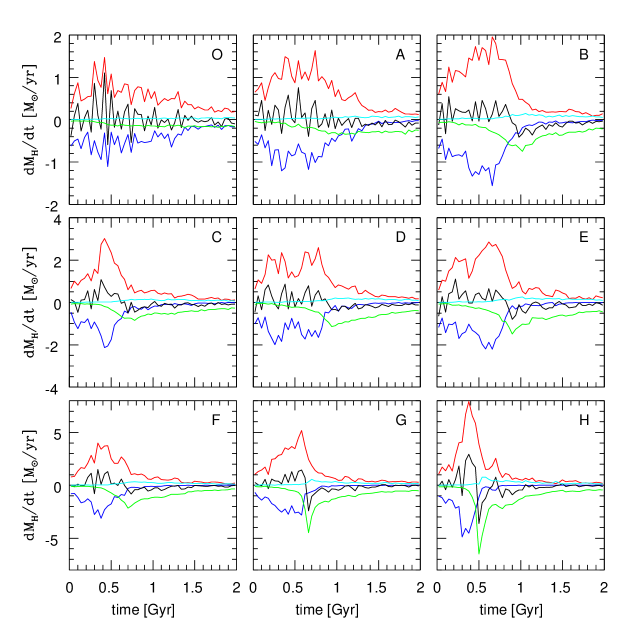
We verify our predictions about gas dynamics in the central region by analyzing the physical effects responsible for changing the gaseous mass within the central region, as we did in Paper I. Three physical processes are crucial here: First, as gas moves along elliptical orbits along the bar, it flows in and out of the central region, increasing and decreasing the central gas mass. Secondly, star formation decreases the gas mass as gas is converted into stars. Finally, stellar evolution feedback returns gas to the ISM through supernovae and stellar winds. Figure 7 shows these three processes in all barred galaxies: gas moving into the central region is shown in red, gas moving out in blue, star formation in green, stellar feedback in cyan, and the total effect in black. Gas flow dominates early on as the gas moves along elongated orbits that cross the boundary of the central region. However, as the bar transfers angular momentum away from the gas, the orbits become smaller, and once they become smaller than the central region there is no longer any gas flow across the boundary of the central region. We see in all galaxies except O that there is a time between and where almost all the gas is trapped within the central region, and that this gas is then consumed through an important star formation boost. The relative importance of the SFR-related decrease in hydrogen mass (green lines in Fig. 7) is greater in high-mass galaxies than in low-mass ones.
This high gas consumption in high-mass barred galaxies is highlighted by the inversion of the mass lines after in the top panel of Figure 6: The lowest-mass galaxies are the ones with the highest central hydrogen mass, while the highest-mass galaxies have the lowest one. Comparing the bottom panels of Figures 4 and 6, we see that at late time (), barred galaxies maintain a higher SFR than unbarred galaxies while having a smaller gas supply. This indicates that the enhancement in central SFR in barred galaxies is not caused by a larger gas supply, but instead by a higher star formation efficiency. This is in agreement with the recent results of Sandstrom et al. (2016).
The dramatic late-time reduction in for massive barred galaxies is caused by gas exhaustion. Massive amounts of gas are consumed during the starburst in these galaxies, limiting their ability to accumulate gas in the central region as unbarred and less-massive barred galaxies do. Because our simulations do not include gas accretion from the IGM, or galaxy mergers, the gas supply is limited. Accretion could enable massive barred galaxies to sustain a high SFR for a longer period, or it could make the starburst even stronger.
By comparing barred and unbarred galaxies with the same global stellar mass, Ellison et al. (2011) found an enhancement in central SFR for barred galaxies with global , with no corresponding enhancement in central metallicity. These authors suggested a possible explanation based on the simulations of Combes & Elmegreen (1993). These simulations showed that in low-mass, late-type galaxies, bars stop growing at an early stage, while bars in high-mass, early-type galaxies grow continuously. Since bars are responsible for driving gas toward the central region and fueling central star formation, star formation would be ongoing in high-mass barred galaxies and not in low-mass ones. However, our simulations show that star formation is sustained in both unbarred and barred galaxies. Indeed, in unbarred galaxies and in low-mass barred ones, it is the low star formation efficiency (compared to massive barred galaxies) that enables these galaxies to sustain star formation for a long period of time without exhausting the gas supply.
There is an important effect that we must be aware of when comparing barred and unbarred galaxies with a same central . Two galaxies with different total stellar masses can have the same central if they happen to be at different stages of their respective evolution. We will now address this particular issue.
3.3 Barred vs unbarred galaxies as a function of mass
3.3.1 Galaxy Samples
While studying the evolution of barred and unbarred galaxies at different times gives us a very good insight on the different dynamics ruling both of them at different mass scales, this kind of direct temporal comparison is far from ideal when it comes to understanding observational results. Instead, we need to recreate such results with variables that are observationally available and then interpret them with our temporal and evolutionary knowledge, as done in Scudder et al. (2015).
In Figures 4 and 6, we showed the time-evolution of the SFR and hydrogen mass in the central region. With real, observed galaxies, we do not have a direct measure of the time , so we must rely on another observable to identify the various evolutionary stages of the galaxies. A good choice is the central stellar mass , which increases monotonically with time. We plot the SFR and hydrogen mass in the central region as a function of the central stellar mass in Figures 8 and 9, respectively. Each dot represents one snapshot of a simulation. At the beginning of each simulation, it takes a certain amount of time before the gas distribution relaxes to equilibrium, so we excluded the first from the analysis. For barred galaxies, we also exclude all the snapshots that precede the bar formation, as defined by . At , the barred galaxies are in their post-starburst phase, where accretion could have an impact. Hence, for this analysis, we are only including galaxies at , which roughly corresponds to their period of high activity shown in Figure 7.
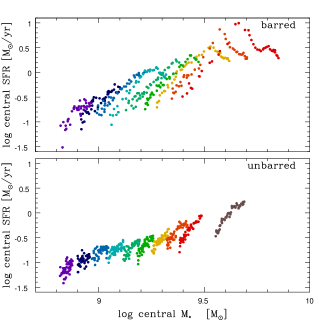
In the bottom panel of Figure 8, we see that unbarred galaxies of different masses combine to form a tight relation between SFR and central stellar mass, especially if we neglect the early stages of evolution (leftmost part of each curve). This relation is well-approximated by a power law, , with . In the upper panel, we see that barred galaxies behave very differently. The SFR of a galaxy of a given total mass does not vary monotonically, and covers a wide range of values compared to unbarred galaxies of the same mass. Also, when combining barred galaxies of different masses, they do not form a single relation, unlike unbarred galaxies. Overall, the SFR tends to increases with central stellar mass, and roughly follows the same power law as for unbarred galaxies, but there is a lot of scatter. Clearly, there is a risk of comparing galaxies of completely different global that happen to have the same central mass because they are at different stages of their respective evolution. For example, at we find the H galaxy in its pre-bar stage, the C galaxy in its final, post-burst stage, the F galaxy in the middle of its gas inflow period, and the E at the peak of the SFR.
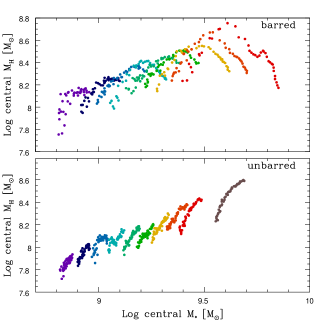
The relation between central and central is shown in Figure 9. The results are similar to the ones shown in Figure 8. Central increases monotonically with central in unbarred galaxies. Combining all unbarred galaxies of different masses, we find again a power law, , with . In contrast, central does not vary monotonically with central for barred galaxies of a given total mass, and when combining all barred galaxies, there is very little correlation between central and central . Since, in each barred galaxy, central first increases with time because of gas inflow, then decreases because of star formation while central steadily increases, there are usually two very different values of corresponding to a given . What correlates well with is the peak value of the SFR in the central region, but determining observationally that the SFR is at its peak value is not possible.
3.3.2 Mass binning
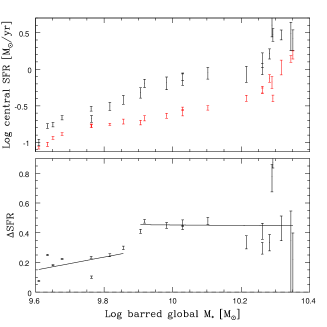
To study the general dependence of SFR with central , we must acknowledge that galaxies of different global can have the same central because they are at different evolutionary stages. As such, to compare galaxies of a given central , we must account for both high-global-mass, young galaxies and lower-global-mass but older galaxies having the same central . Ellison et al. (2011) obtained their two-regime relation by binning their sample of 294 barred galaxies depending on the stellar mass in the central region. Once binned, they compared the averaged SFR in each bin to the expected SFR of unbarred galaxies of corresponding central mass and noted that only high-mass galaxies have a larger central SFR. To recreate a similar method, we consider the various dots in Figures 8 and 9 as representing different galaxies at the present, instead of a few galaxy at several different times. This gives us a sample of several hundreds barred and unbarred galaxies. We then calculate a weighted average SFR and weighted average global stellar mass in 30 central mass bins for barred and unbarred galaxies. Weights are selected to represent the relative likelihood of observing a particular galaxy. To determine the weights, we use the halo mass function of Murray et al. (2013). Then, following Ellison et al. (2011), we calculate for each mass bin and plot it as a function of the global of the barred galaxy. The results are shown in Figure 10. Low-mass barred galaxies have a small enhancement of 0.2 dex of their central SFR when compared to unbarred galaxies with equivalent central mass. This enhancement quickly increases and stabilize around 0.4 dex, with the transition being centered at .
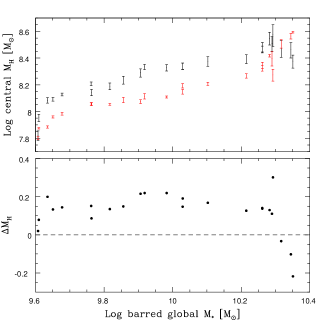
In the top panel of Figure 11, we plot the central hydrogen mass for barred and unbarred galaxies. The values are fairly constant, even for barred galaxies. Higher-mass barred galaxies drive more gas toward the central region, more of that gas is converted into stars. However, at , there is both a sudden drop in for barred galaxies and a sudden increase for unbarred galaxies. The bottom panel of Figure 11 shows the difference . At , is larger by for barred galaxies. At , suddenly drops by down to negative values. This bin is dominated by high-mass barred galaxies in their starburst phase, where gas consumption is very efficient compared to unbarred galaxies.
3.4 Initial gas fraction
While we have been comparing the evolution of our galaxy set focusing on the stellar mass of the galaxy, this is not the only variable parameter in our set: the total amount of gas available is another important one which can greatly impact the star formation rate. To explore how this affects our results, we performed variations of the run D: two with a lower initial gas fraction ( and ) and two with a higher initial gas fraction ( and ); all of these simulations where performed both in barred and unbarred galaxies for a total of 8 new simulations. Details of their gaseous component are given in Table 3. The last column refers to the colours used in Figures 12 and 13.
| Galaxy | colour | ||||
|---|---|---|---|---|---|
| 10.0 | 2.50 | 34 717 | 0.200 | red | |
| 10.0 | 2.98 | 41 480 | 0.229 | magenta | |
| D | 10.0 | 3.51 | 48 749 | 0.259 | green |
| 10.0 | 4.10 | 56 943 | 0.290 | blue | |
| 10.0 | 4.70 | 65 350 | 0.319 | black |
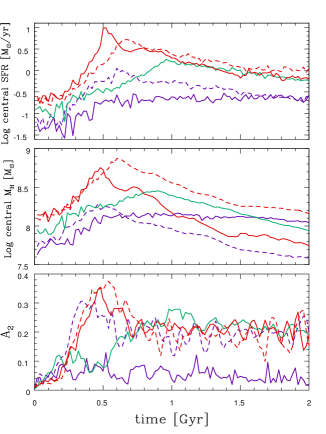
Figure 12 shows the SFR inside the central region of the various D galaxies as a function of time. Barred galaxies from to all have a very similar SFR history: their SFR increases steadily from 0 to 1 Gyr before decreasing, in a very similar way to other intermediate-mass galaxies (C to E). However, the barred galaxy shows a large SFR peak around much more akin to the high-mass galaxies F-G-H. In Figure 13, we show that the amount of gas present in the barred central region behaves quite differently for the galaxy compared to the less gaseous ones: in the first four, the amount of gas varies smoothly and the galaxies with the most gas always have the most gas. However, in there is an important increase in the central gas mass during the first 0.5 Gyr, before falling down due to the starburst-like formation episode. Unbarred galaxies do not show such changes in high-gas-mass galaxies.
Barred galaxies and F have similar initial gas mass (, vs. , a difference of 6%). On the top panels of Figures 12 and 13, we added the results for galaxy F (dashed lines), and also galaxy G (dot-dashed lines), which has a slightly higher gas mass of . The results are similar to run . The peaks in SFR and occur slightly later, but the maximum values are similar, and the post-starburst evolution in SFR and are also similar, even though they have very different stellar masses and gas fractions. This suggests that in isolated barred galaxies, it is neither the virial mass nor the total baryonic mass, but rather the gas mass, which is the primary factor in determining the evolution of the galaxy. This is easily understood: The gas response to the non-axisymmetric instability is faster in gas than in stars (Berentzen et al., 2007; Villa-Vargas et al., 2010). Thus at a fixed baryonic mass, a galaxy with higher will form a stronger bar. This causes the higher galaxies to have a stronger and faster transport of gas to the centre. The higher gas density and increased efficiency of radiative cooling in the central region then favours a higher SFR.
3.5 Resolution and Particle Number
| Galaxy | colour | |||||||
|---|---|---|---|---|---|---|---|---|
| O | 4.0 | 1.72 | 265 | 52 501 | 22 546 | 75 047 | 0.300 | purple solid |
| OD | 4.0 | 1.72 | 265 | 131 146 | 56 472 | 187 618 | 0.300 | purple dashed |
| D | 10.0 | 3.51 | 450 | 138 869 | 48 749 | 187 618 | 0.259 | light green |
| HD | 25.0 | 7.17 | 872 | 145 802 | 41 816 | 187 618 | 0.222 | burgundy, dashed |
| H | 25.0 | 7.17 | 872 | 364 460 | 104 583 | 469 043 | 0.222 | burgundy, solid |
In this study, we purposely used a larger number of particles to simulate more massive galaxies (see Table 1), in order to maintain a fixed physical resolution across the ensemble of simulations. In all simulations, the particle mass is of order . If we had used instead the same number of particles in all simulations, the low-mass galaxies would have a much higher physical resolution than the high-mass ones. This could lead to potential problems if some physical phenomena only appear below a certain mass scale. These phenomena could be resolved in the low-mass galaxies, but not in the high-mass ones. Also, the subgrid model of star formation and feedback used in GCD+ is known to be sensitive to physical mass resolution (Kawata et al., 2014). Having different physical resolutions from run to run might require an adjustment of the subgrid parameters.
We performed two additional simulations of barred galaxies, OD and HD, to illustrate the effects of varying the physical resolution. Table 4 lists the initial parameters of these new galaxies, along with the ones of galaxies O, D, and H. The seventh column shows the total number of particles . Galaxy OD has the same mass as galaxy O, but the same total number of particles as galaxy D. Similarly, galaxy HD has the same mass as galaxy H, but the same total number of particles as galaxy D.111The number of stars and gas particles in galaxies OD, D, and HD are different because these galaxies have different gas fractions.
The bottom panel of Figure 14 shows the evolution of the bar strength for these runs. Galaxy O does not form a significant bar. All other galaxies form a bar, and though the values of strongly fluctuate with time, the mean values remain around after . Galaxies O has fewer particles than all the other galaxies, which suggests that there is a minimum number of particles required to resolve the formation of the bar. When the bar is resolved, its strength is independent of the number of particles used. In particular, the evolution of for galaxies H and HD is essentially the same, even though galaxy H has 2.5 times more particles.
The upper and middle panels of Figure 14 show the evolution of the central SFR and central hydrogen mass with time, and reveal important differences between the various runs. The SFR is significantly higher in galaxy OD than in galaxy O. This could be explained by the fact that galaxy O simply failed to form a bar that would drive gas inward. However, galaxy O contains three times as much central gas as galaxy OD at the end of the simulation, indicating that galaxy OD is much more efficient in converting gas into stars. Comparing galaxies H and HD, we see the opposite effect: Galaxy HD has a lower SFR than galaxy H, and is less efficient in converting central gas into stars. This cannot be explained by a bar effect, since their bars have the same strength.
Galaxy HD is essentially a version of galaxy H with lower physical resolution (mass per particle: instead of ). Lowering the mass resolution increases the minimum mass of gas clumps that can form by fragmentation. These more massive clumps cannot reach density as high as in galaxy H, and as a result star formation is less efficient. The SFR peak is significantly lower, and is reached later. Galaxies OD and O show the opposite effect. In this case, the new galaxy OD has a higher physical resolution than galaxy O (mass per particle: instead of ). This leads to more fragmentation, smaller, denser gas clumps, and more star formation. The SFR peak for galaxy OD is about higher than the one for galaxy O.
These comparisons show that the physical mass per particle has a major impact on the outcome of the simulations. This vindicates our decision to keep it uniform across the entire set of simulations.
4 SUMMARY AND CONCLUSION
We have conducted a numerical study of the star formation history in barred and unbarred spiral galaxies, focussing on the dependence on the total stellar mass . We considered barred galaxies with masses ranging from to , and for each barred galaxy, we simulated an unbarred galaxy of the same mass to provide a comparison sample. Our main results are the following:
-
1.
Barred and unbarred galaxies evolve very differently. The bar drives a large amount of gas into the central region. This enhances the central SFR of barred galaxies compared to unbarred galaxies with the same total mass. The highest-mass barred galaxies consequently experience a starburst, with the SFR increasing by a factor up to 30 in the central region relative to an unbarred galaxy of the same stellar mass.
-
2.
In barred galaxies, most of the gas driven into the central region by the bar eventually ends up being consumed by the star formation process. In massive barred galaxies, the strength of the starburst more than compensates for the fact that more gas is funnelled toward the centre, so more massive galaxies end up with a lower central gas concentration (see bottom panel of Fig 6). In unbarred galaxies, the lower SFR allows gas to accumulate in the central region. As a result, unbarred galaxies are expected to have a larger central gas concentration than barred galaxies above a certain stellar mass , and our results suggests that the difference should increase with , as more massive barred galaxies experience stronger starbursts (see bottom panel of Fig 11).
-
3.
Bars drive a substantial amount of gas toward the centre of barred galaxies, but a high efficiency enables star formation to keep up with the build-up of gas in the central region. As a result, barred galaxies at late time tend to have lower central gas content and higher SFR than unbarred galaxies of the same stellar mass.
-
4.
We find that the initial gas mass is the main driver of the evolution of barred galaxies. We considered galaxies with different gas fraction, and found that galaxies with comparable initial gas masses had similar evolutions, even though their virial and baryonic masses were different.
Our simulated results broadly reproduce the observational results of Ellison et al. (2011). Comparing our Fig. 10 with the bottom panel of their Fig. 3, we see in the simulations and in the observations an increase of 0.2 dex in taking place at a total stellar mass . Overall, the simulated values are 0.3 dex higher than the observed values, going from 0.3 to 0.5 instead of 0.0 to 0.2. But it is quite remarkable that the simulations reproduce both the amplitude and location of the jump in . Ellison et al. (2011) suggested that star formation in barred galaxies is short-lived below a total stellar mass , and ongoing above that mass. Our simulations suggest an alternative explanation (see Fig. 4): The SFR in high-mass barred galaxies sharply increases, reaches a peak, and then slowly decays, while the variations in SFR are less important in low-mass galaxies. The enhancement in SFR at high-mass found in Ellison et al. (2011) is not caused by the SFR of individual galaxies. Instead, it is the process of averaging over galaxies that have different masses and are at different evolutionary stages, but happen to have the same central stellar mass, that causes this enhancement. As the top panel of Fig. 8 shows, at large central stellar masses (), we are essentially averaging over high-mass galaxies which are in the peak of their SFR, thus explaining the large enhancement in SFR compared to unbarred galaxies. At lower central stellar masses, we are combining lower-mass galaxies, with a correspondingly lower SFR peak, with high-mass galaxies that are at an early evolutionary stage and have not yet reached their SFR peak.
An important lesson to be learned from this study is that one must be careful when comparing galaxies that share one common observable property, such as the central stellar mass. Galaxies with a same central stellar mass can have completely different total masses, and be at very different stages of their respective evolution. It is preferable to compare galaxies that share at least two observable properties, such as gas fraction, but even that might not be sufficient. The various curves in the top panel of Fig. 8 intersect. Hence, two galaxies with both the same central stellar mass and the same SFR can be very different. If the simulation of barred galaxy O was extended slightly beyond , the violet and yellow curves would intersect. We would then have two barred galaxies differing by a factor of 4 in total mass, having the same central stellar mass and the same central SFR.
We have only considered isolated galaxies. In reality, galaxies can accrete a substantial amount of matter from the intergalactic medium, and merge with other galaxies. This could affect the dynamics of the bar, and also affect the post-starburst evolution of barred galaxies, by replenishing the supply of gas depleted by star formation, although Ellison et al. (2015) find that the atomic gas fraction (relative to the stellar mass) of merging galaxies is little changed during interactions. Using multi-zoom cosmological simulations, L’Huillier et al. (2012) previously studied the mass assembly of galaxies in a cosmological context, in order to quantify the respective role played by mergers and accretion. These simulations reveal that the mass assembly history can vary wildly from one galaxy to another. In their Section 5, they present four characteristic galaxies, and interestingly their galaxy b) resembles ours: the total baryonic mass increases until redshift , then remains constant for the next as the gas mass decreases because of star formation (see top right panel of their Fig. 14). In the last of its evolution, their galaxy b) essentially evolves in isolation, just like ours (and for the same period of time as well). Hence, our simulations are most relevant to low-redshift galaxies, when most of the mass assembly is completed. Including the effects of accretion and mergers in our simulations is clearly the next step in this program, and results will be presented in forthcoming papers.
acknowledgments
We are thankful to Laurent Drissen for useful suggestions. This research is supported by the Canada Research Chair program and NSERC.
References
- Aguerri et al. (2009) Aguerri, J. A. L., Mendez-Abreu, J., & Corsini, E. M. 2009, A&A, 495, 491
- Alonso-Herrero & Knapen (2001) Alonso-Herrero, A., & Knapen, J. H. 2001, AJ, 122, 1350
- Athanassoula (2003) Athanassoula, E. 2003, in Galaxies and Chaos, Vol. 626, 313–326
- Athanassoula (2003) Athanassoula, E. 2003, MNRAS, 341, 1179
- Athanassoula (2005) Athanassoula, E. 2005, MNRAS, 358, 1477
- Athanassoula et al. (2013) Athanassoula, E., Machado, R. E. G., & Rodionov, S. A. 2013, MNRAS, 429, 1949
- Athanassoula & Misiriotis (2002) Athanassoula, E., & Misiriotis, A. 2002, MNRAS, 330, 35
- Baba et al. (2010) Baba, J., Saitoh, T. R., & Wada, K. 2010, PASJ, 62, 1413
- Buta et al. (2005) Buta, R., Vasylyev, S., Salo, H., & Laurikainen, E. 2005, AJ, 130, 506
- Berentzen et al. (1998) Berentzen, I., Heller, C. H., Shlosman, I., & Fricke, K. J. 1998, MNRAS, 300, 49
- Berentzen et al. (2007) Berentzen, I., Shlosman, I., Martinez-Valpuesta, I., & Heller, C. H. 2007, ApJ, 666, 189
- Cacho et al. (2014) Cacho, R., Sánchez-Blázquez, P., Gorgas, J., & Pérez, I. 2014, MNRAS, 442, 2496
- Chapelon et al. (1999) Chapelon, S., Contini, T., & Davoust, E. 1999, A&A, 345, 81
- Cheung et al. (2013) Cheung, E., Athanassoula, E., Masters, K. L., et al. 2013, ApJ, 779, 162
- Coelho & Gadotti (2011) Coelho, P., & Gadotti, D. A. 2011, ApJ, 743, L13
- Combes & Elmegreen (1993) Combes, F., & Elmegreen, B. G. 1993, A&A, 271, 391
- Combes & Gerin (1985) Combes, F., & Gerin, M. 1985, A&A, 150, 327
- Considère et al. (2000) Considère, S., Coziol, R., Contini, T., & Davoust, E. 2000, A&A, 356, 89
- Cox et al. (2006) Cox, T. J., Jonsson, P., Primack, J. R., & Somerville, R. S. 2006, MNRAS, 373, 1013
- Debattista & Sellwood (2000) Debattista, V. P., & Sellwood, J. A. 2000, ApJ, 543, 704
- Devereux (1987) Devereux, N. 1987, in NASA Conference Publication, Vol. 2466, 219–226
- Dutil & Roy (1999) Dutil, Y., & Roy, J.-R. 1999, ApJ, 516, 62
- Edmunds & Roy (1993) Edmunds, M. G., & Roy, J.-R. 1993, MNRAS, 261, L17
- Ellison et al. (2011) Ellison, S. L., Nair, P., Patton, D. R., et al. 2011, MNRAS, 416, 2182
- Ellison et al. (2015) Ellison, S. L., Fertig, D., Rosenberg, J. L., Nair, P., Simard, L., Torrey, P., & Patton, D. R., 2015, MNRAS, 448, 221
- Elmegreen & Elmegreen (1989) Elmegreen, B. G., & Elmegreen, D. M. 1989, ApJ, 342, 677
- Elmegreen et al. (2004) Elmegreen, B. G., Elmegreen, D. M., & Hirst, A. C. 2004, ApJ, 612, 191
- Erwin (2005) Erwin, P. 2005, MNRAS, 364, 283
- Fathi & Peletier (2003) Fathi, K., & Peletier, R. F. 2003, A&A, 407, 61
- Ferland et al. (1998) Ferland, G. J., Korista, K. T., Verner, D. A., et al. 1998, PASP, 110, 761
- Friedli & Benz (1995) Friedli, D., & Benz, W. 1995, A&A, 301, 649
- Friedli et al. (1994) Friedli, D., Benz, W., & Kennicutt, R. 1994, ApJ, 430, L105
- Gadotti & dos Anjos (2001) Gadotti, D. A., & dos Anjos, S. 2001, AJ, 122, 1298
- Gingold & Monaghan (1977) Gingold, R. A., & Monaghan, J. J. 1977, MNRAS, 181, 375
- Grand et al. (2012) Grand, R. J. J., Kawata, D., & Cropper, M. 2012, MNRAS, 426, 167
- Grand et al. (2015) Grand, R. J. J., Kawata, D., & Cropper, M. 2015, MNRAS, 447, 4018
- Greif et al. (2009) Greif, T. H., Glover, S. C. O., Bromm, V., & Klessen, R. S. 2009, MNRAS, 392, 1381
- Holley-Bockelmann et al. (2005) Holley-Bockelmann, K., Weinberg, M. & Katz, N., MNRAS, 363, 991
- Ho et al. (1997) Ho, L. C., Filippenko, A. V., & Sargent, W. L. W. 1997, ApJ, 487, 591
- Hoyle et al. (2011) Hoyle, B., Masters, K. L., Nichol, R. C., et al. 2011, MNRAS, 415, 3627
- Hunt et al. (2008) Hunt, L. K., Combes, F., García-Burillo, S., et al. 2008, A&A, 482, 133
- Iwamoto et al. (1999) Iwamoto, K., Brachwitz, F., Nomoto, K., et al. 1999, ApJSS, 125, 439
- James et al. (2009) James, P. A., Bretherton, C. F., & Knapen, J. H. 2009, A&A, 501, 207
- Jogee et al. (2005) Jogee, S., Scoville, N., & Kenney, J. D. P. 2005, ApJ, 630, 837
- Kawata & Gibson (2003) Kawata, D., & Gibson, B. K. 2003, MNRAS, 340, 908
- Kawata et al. (2014) Kawata, D., Gibson, B. K., Barnes, D. J., Grand, R. J. J., & Rahimi, A. 2014, MNRAS, 438, 1208
- Kawata et al. (2013) Kawata, D., Okamoto, T., Gibson, B. K., Barnes, D. J., & Cen, R. 2013, MNRAS, 428, 1968
- Kim & Stone (2012) Kim, W.-T., & Stone, J. M. 2012, ApJ, 751, 124
- Knapen et al. (1995) Knapen, J. H., Beckman, J. E., Heller, C. H., Shlosman, I., & de Jong, R. S. 1995, ApJ, 454, 623
- Knapen et al. (2000) Knapen, J. H., Shlosman, I., & Peletier, R. F. 2000, ApJ, 529, 93
- Kormendy & Kennicutt (2004) Kormendy, J., & Kennicutt, Jr., R. C. 2004, ARA&A, 42, 603
- Kubryk et al. (2015) Kubryk, M., Prantzos, N., & Athanassoula, E. 2015, A&A, 580, A127
- Lee et al. (2012) Lee, G.-H., Park, C., Lee, M. G., & Choi, Y.-Y. 2012, ApJ, 745, 125
- L’Huillier et al. (2012) L’Huillier, B., Combes, F., & Semelin, B. 2012, A&A, 544, A68
- Łokas et al. (2014) Łokas, E. L., Athanassoula, E., Debattista, V. P., et al. 2014, MNRAS, 445, 1339
- Lucy (1977) Lucy, L. B. 1977, AJ, 82, 1013
- Lynden-Bell (1979) Lynden-Bell, D. 1979, MNRAS, 187, 101
- Maciejewski et al. (2002) Maciejewski, W., Teuben, P. J., Sparke, L. S., & Stone, J. M. 2002, MNRAS, 329, 502
- Martel et al. (2013) Martel, H., Kawata, D., & Ellison, S. L. 2013, MNRAS, 431, 2560
- Martin (1995) Martin, P. 1995, AJ, 109, 2428
- Martin & Roy (1994) Martin, P., & Roy, J.-R. 1994, ApJ, 424, 599
- Martin & Roy (1995) —. 1995, ApJ, 445, 161
- Martinet & Friedli (1997) Martinet, L., & Friedli, D. 1997, A&A, 323, 363
- Martínez & Muriel (2011) Martínez, H. J., & Muriel, H. 2011, MNRAS, 418, L148
- Martinez-Valpuesta et al. (2006) Martinez-Valpuesta, I., Shlosman, I. & Heller, C. H. 2006, ApJ, 637, 214
- Martinez-Valpuesta et al. (2016) Martinez-Valpuesta, I., Aguerri, J. A. L., & González-García, C. 2016, Galaxies,4, 7
- Masters et al. (2011) Masters, K. L., Nichol, R. C., Hoyle, B., et al. 2011, MNRAS, 411, 2026
- Masters et al. (2012) Masters, K. L., Nichol, R. C., Haynes, M. P., et al. 2012, MNRAS, 424, 2180
- Matteo et al. (2013) Matteo, P. D., Haywood, M., Combes, F., Semelin, B., & Snaith, O. N. 2013, A&J, 553, 8
- Menéndez-Delmestre et al. (2007) Menéndez-Delmestre, K., Sheth, K., Schinnerer, E., Jarrett, T. H., & Scoville, N. Z. 2007, ApJ, 657, 790
- Moster et al. (2010) Moster, B. P., Somerville, R. S., Maulbetsch, C., et al. 2010, ApJ, 710, 903
- Murray et al. (2013) Murray, S. G., Power, C., & Robotham, A. S. G. 2013, Astronomy and Computing, 3, 23
- Navarro et al. (1996) Navarro, J. F., Frenk, C. S., & White, S. D. M. (1996), 462, 563
- Oey & Kennicutt (1993) Oey, M. S., & Kennicutt, Jr., R. C. 1993, ApJ, 411, 137
- Pompea & Rieke (1990) Pompea, S. M., & Rieke, G. H. 1990, ApJ, 356, 416
- Price & Monaghan (2007) Price, D. J., & Monaghan, J. J. 2007, MNRAS, 374, 1347
- Pérez et al. (2009) Pérez, I., Sánchez-Blázquez, P., & Zurita, A. 2009, A&A, 495, 775
- Rahimi & Kawata (2012) Rahimi, A., & Kawata, D. 2012, MNRAS, 422, 2609
- Regan & Teuben (2004) Regan, M. W., & Teuben, P. J. 2004, ApJ, 600, 595
- Robertson & Kravtsov (2008) Robertson, B. E., & Kravtsov, A. V. 2008, ApJ, 680, 1083
- Rosswog & Price (2007) Rosswog, S., & Price, D. 2007, MNRAS, 379, 915
- Roy & Walsh (1997) Roy, J.-R., & Walsh, J. R. 1997, MNRAS, 288, 715
- Saintonge at al. (2012) Saintonge, A. et al. 2012, ApJ, 758, 73
- Sakamoto et al. (1999) Sakamoto, K., Okumura, S. K., Ishizuki, S., & Scoville, N. Z. 1999, ApJ, 525, 691
- Salpeter (1955) Salpeter, E. E. 1955, ApJ, 121, 161
- Sánchez-Blázquez et al. (2011) Sánchez-Blázquez, P., Ocvirk, P., Gibson, B. K., Pérez, I., & Peletier, R. F. 2011, MNRAS, 415, 709
- Sánchez-Blázquez et al. (2014) Sánchez-Blázquez, P. et al. 2014, A&A, 570, 6
- Sandstrom et al. (2016) Sandstrom, K. et al. 2016, in preparation.
- Scannapieco et al. (2010) Scannapieco, C., Gadotti, D. A., Jonsson, P., & White, S. D. M. 2010, MNRAS, 407, L41
- Scudder et al. (2015) Scudder, J. M., Ellison, S. L., Momjian, E., et al. 2015, MNRAS, 449, 3719
- Seidel et al. (2015) Seidel, M. K., Falcón-Barroso, J., Martínez-Valpuesta, I., et al. 2015, MNRAS, 451, 5455
- Seidel et al. (2016) Seidel, M. K., Falcón-Barroso, J., Martínez-Valpuesta, I., et al. 2016, preprint (arXiv:1605.06500)
- Sellwood (2016) Sellwood, J. A., ApJ, 819, 92
- Shen et al. (2003) Shen, S., Mo, H. J., White, S. D. M., et al. 2003, MNRAS, 343, 978
- Sheth et al. (2008) Sheth, K., Elmegreen, D. M., Elmegreen, B. G., et al. 2008, ApJ, 675, 1141
- Simmons et al. (2014) Simmons, B. D., Melvin, T., Lintott, C., et al. 2014, MNRAS, 445, 3466
- Vila-Costas & Edmunds (1992) Vila-Costas, M. B., & Edmunds, M. G. 1992, MNRAS, 259, 121
- Villa-Vargas et al. (2010) Villa-Vargas, J., Shlosman, I., & Heller, C. 2010, ApJ, 719, 1470
- Wang et al. (2012) Wang, J., Kauffmann, G., Overzier, R., et al. 2012, MNRAS, 423, 3486
- Willett et al. (2015) Willett, K. W., Schawinski, K., Simmons, B. D., et al. 2015, MNRAS, 449, 820
- Woosley & Weaver (1995) Woosley, S. E., & Weaver, T. A. 1995, ApJSS, 101, 181
- Zaritsky et al. (1994) Zaritsky, D., Kennicutt, Jr., R. C., & Huchra, J. P. 1994, ApJ, 420, 87