Modelling the thermal X-ray emission around the Galactic centre from
colliding Wolf-Rayet winds
Abstract
The Galactic centre is a hotbed of astrophysical activity, with the injection of wind material from 30 massive Wolf-Rayet (WR) stars orbiting within 12′′ of the super-massive black hole (SMBH) playing an important role. Hydrodynamic simulations of such colliding and accreting winds produce a complex density and temperature structure of cold wind material shocking with the ambient medium, creating a large reservoir of hot, X-ray-emitting gas. This work aims to confront the 3Ms of Chandra X-ray Visionary Program (XVP) observations of this diffuse emission by computing the X-ray emission from these hydrodynamic simulations of the colliding WR winds, amid exploring a variety of SMBH feedback mechanisms. The major success of the model is that it reproduces the spectral shape from the 2′′–5′′ ring around the SMBH, where most of the stellar wind material that is ultimately captured by Sgr A∗ is shock-heated and thermalised. This naturally explains that the hot gas comes from colliding WR winds, and that the wind speeds of these stars are in general well constrained. The flux level of these spectra, as well as 12′′12′′ images of 4–9 keV, show the X-ray flux is tied to the SMBH feedback strength; stronger feedback clears out more hot gas, thereby decreasing the thermal X-ray emission. The model in which Sgr A∗ produced an intermediate-strength outflow during the last few centuries best matches the observations to within about 10%, showing SMBH feedback is required to interpret the X-ray emission in this region.
keywords:
Galaxy: centre, stars: Wolf-Rayet, stars: winds, outflows, X-rays: stars, radiative transfer, hydrodynamics1 Introduction
The proximity of Sgr A∗ makes it the only SMBH where its orbiting stars are resolved, and therefore is the best opportunity to study the interplay between a SMBH and the stars and ejected wind material orbiting it. Two examples of work in this thread are the hydrodynamic simulations of the winds of 30 Wolf-Rayet (WR) stars orbiting Sgr A∗ (Cuadra et al., 2008, 2015), and the 3 Ms of Chandra X-ray Visionary Program (XVP) observations (Wang et al., 2013) that resolved, among other things, the diffuse thermal emission around Sgr A∗ thought to originate from wind-wind collisions.
This work computes the thermal X-ray emission from the aforementioned hydrodynamics simulations and compares the results to the XVP observations with the aim of increasing our understanding of the WR stars, and more generally the full environment, surrounding Sgr A∗. The full version of this work is Russell, Wang & Cuadra (2016).
| model | direction | norm-1 | image | spectra | mean | ||||
|---|---|---|---|---|---|---|---|---|---|
| (/yr) | (km/s) | (mod/obs) | (1022 cm-2) | (model/observed) | |||||
| NF | 0 | 0 | – | 1.95 | 10.28 | 1.36 | 1.50 | 1.97 | 1.73 |
| OF | 10,000 | spherical | 1.94 | 10.26 | 1.36 | 1.50 | 1.96 | 1.72 | |
| OBBP | 5,000 | bipolar, 15∘ | 1.20 | 10.16 | 1.38 | 0.92 | 1.21 | 1.07 | |
| OB5 | 5,000 | spherical | 1.17 | 10.92 | 1.31 | 0.92 | 1.20 | 1.06 | |
| OB10 | 10,000 | spherical | 0.79 | 10.73 | 1.24 | 0.62 | 0.81 | 0.71 | |
2 Method
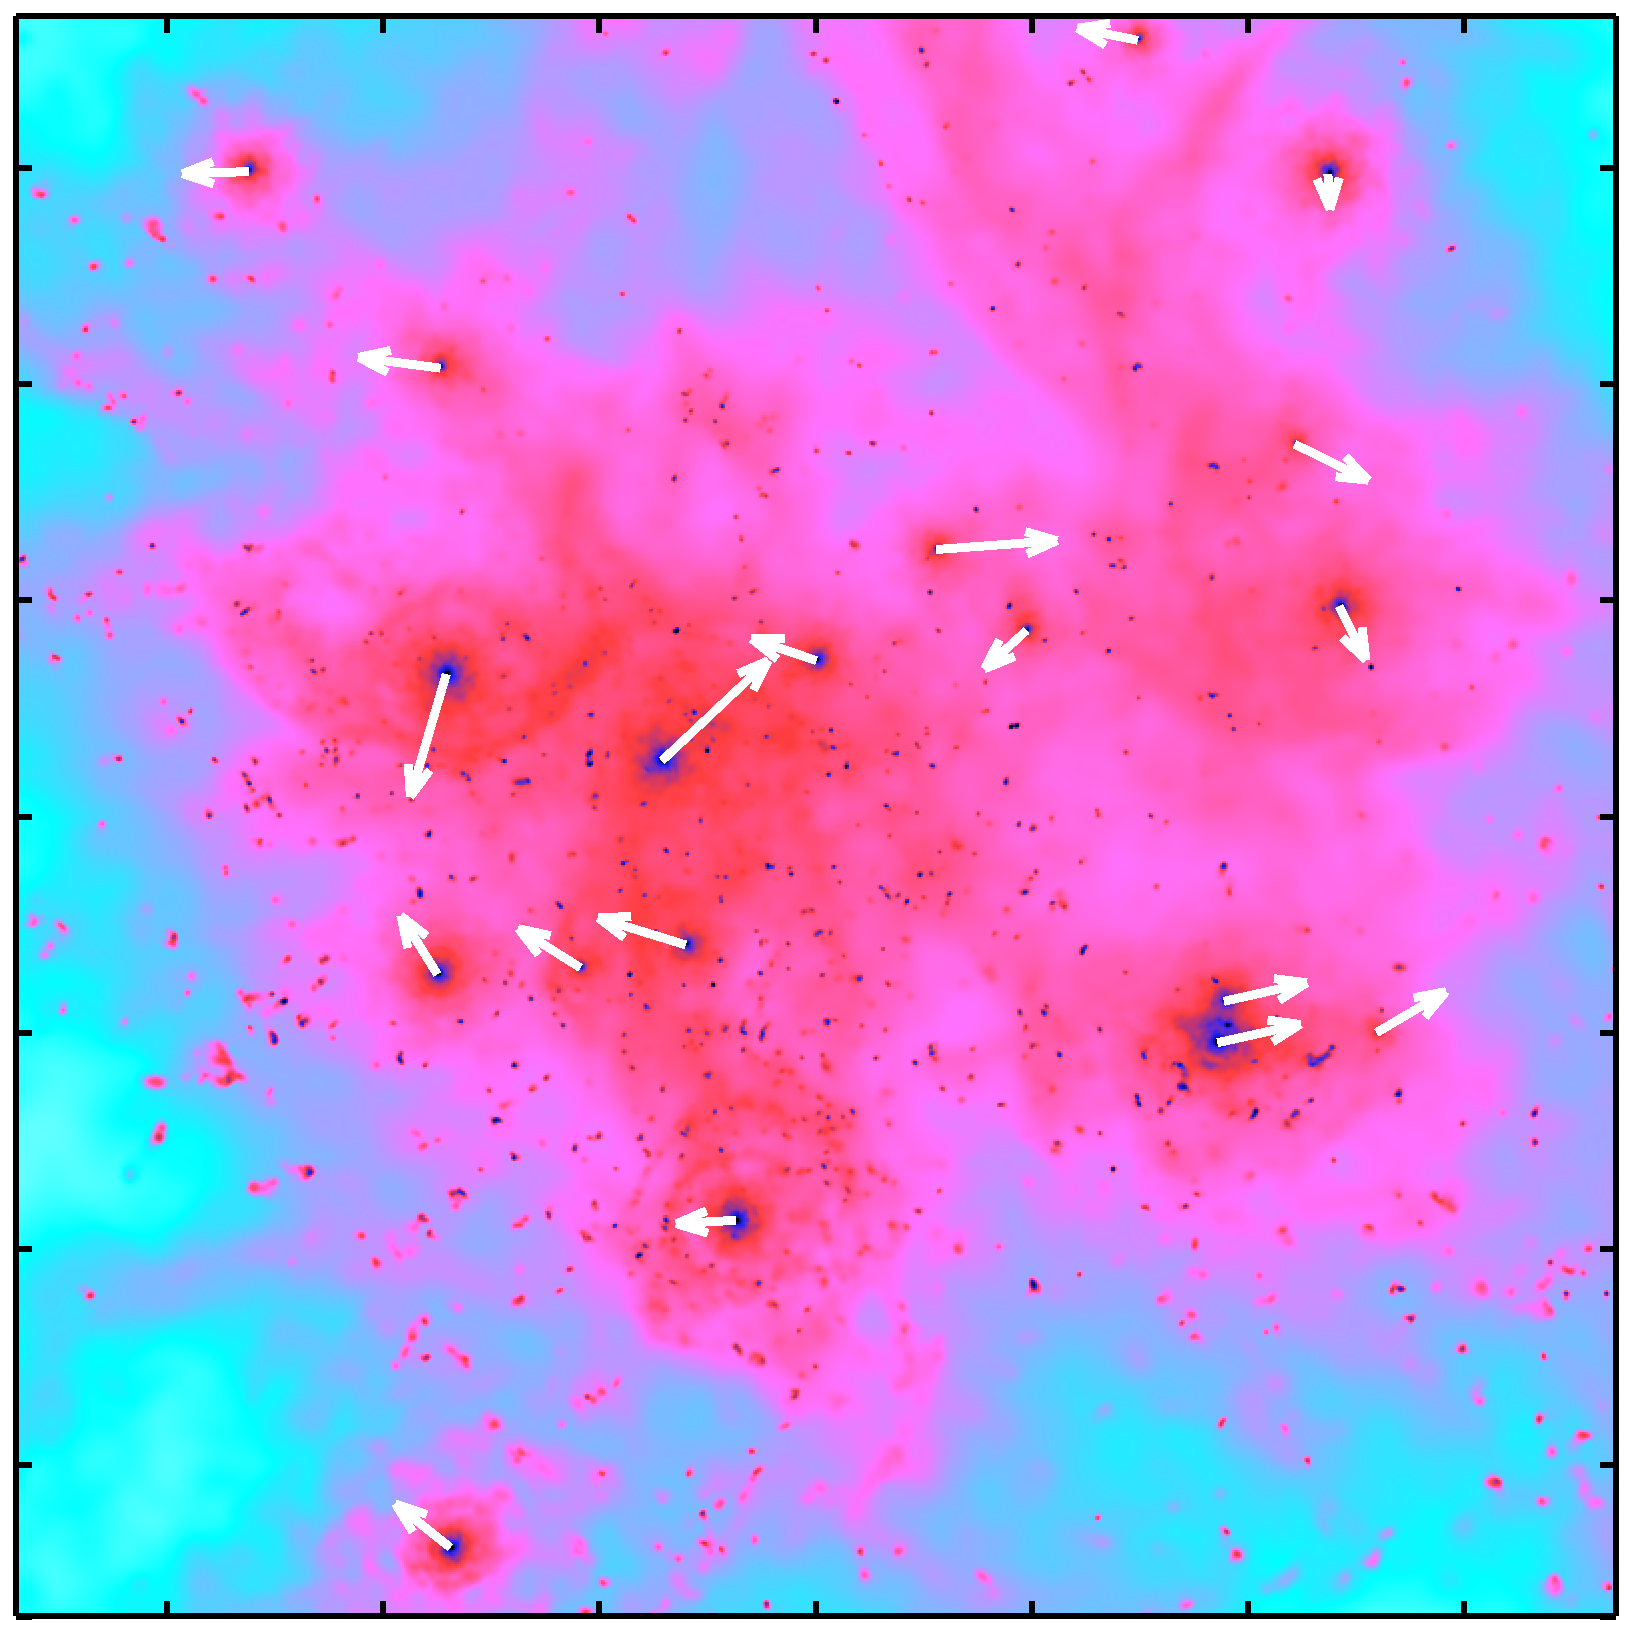
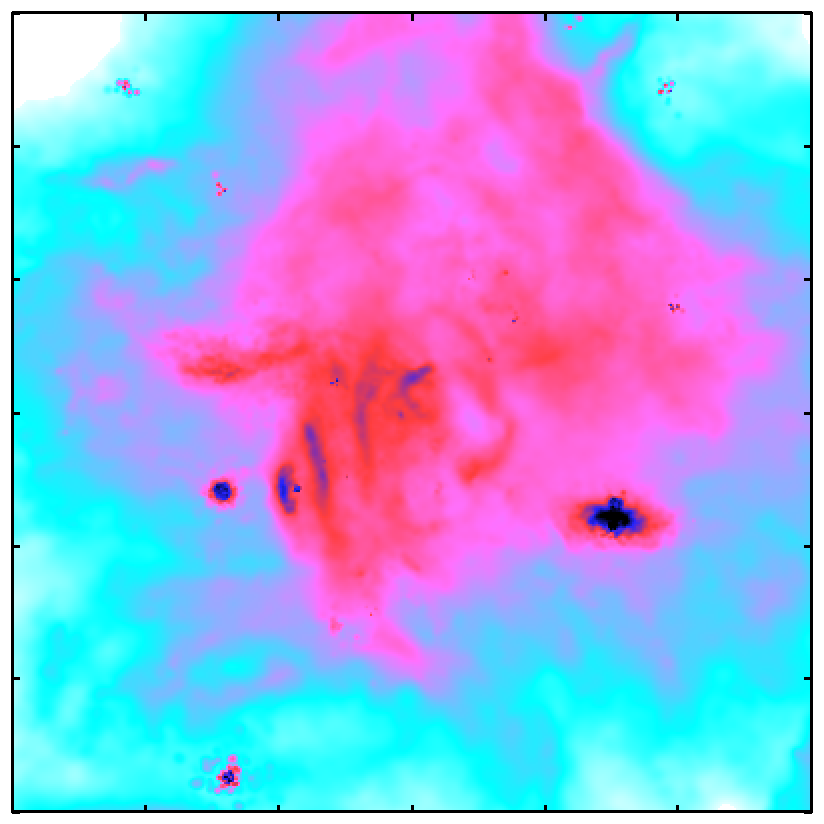
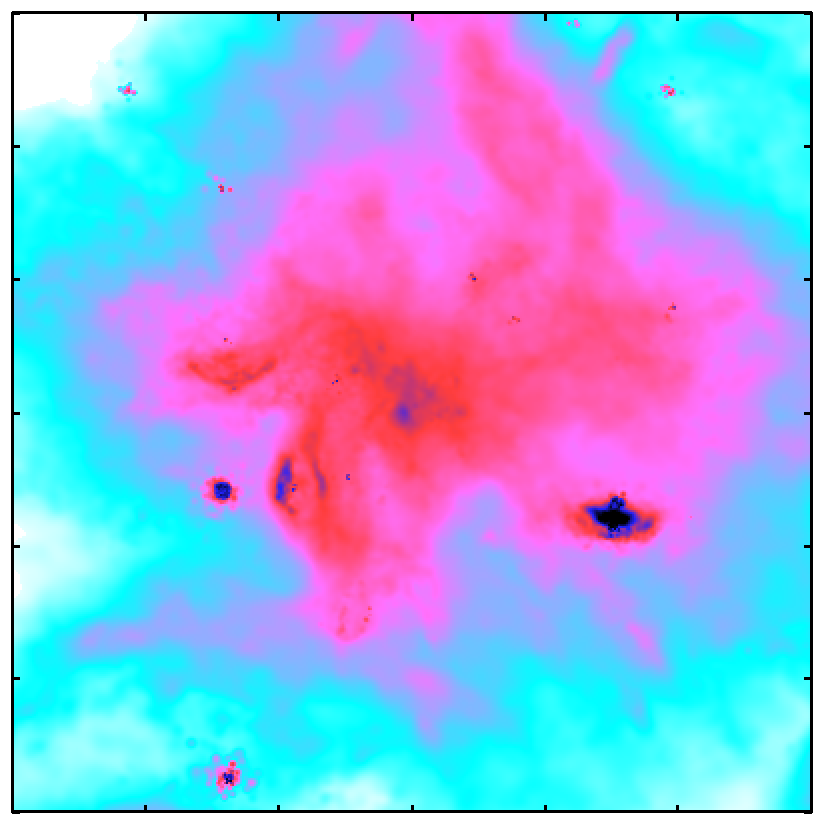
Fig. 1 shows the column density at the present day for all hydrodynamic simulations (Cuadra et al., 2008, 2015). As the feedback strength increases from left to right, the amount of material remaining in the simulation volume decreases. The model names are NF – no feedback, OF – outflow, OBBP – bipolar outburst, OB5 – 5,000 km/s outburst, and OB10 – 10,000 km/s outburst. All outbursts occur from 400 to 100 yr ago (Ponti et al., 2010). Table 1 (left) provides more details of each model.
We solve the formal solution of radiative transfer along a 500500 grid of rays covering the central 15′′15′′ through the simulation volume for 0.3-12 keV (covering the Chandra HETG response function) at a resolution of 800 energy bins per dex. These pixel maps are folded through the Chandra ACIS-S/HETG 0th-order response function to compare with the observed spectrum, and then through the Chandra PSF (which is approximated as a 0.5′′ full-width half-max [FWHM] Gaussian) to compare with the observed image.
The basis of the radiative transfer calculation (see Russell 2013; Russell et al. 2016 for more details) is the SPH visualization program splash (Price, 2007). The X-ray emissivities are from the VVAPEC model (Smith et al., 2001) using AtomDB version 2.0.2, as implemented in XSpec (Arnaud, 1996) version 12.0.9c. The wind opacities are from Verner & Yakovlev (1995) (obtained using the interface of Leutenegger et al. 2010), and the interstellar medium (ISM) opacities are from the TBabs model (Wilms et al., 2000). As the emissivities and wind opacities are metallicity dependent, we use three models to cover the range of WR spectral types in the SPH simulations; one for the WC stars (Crowther, 2007), one for WN5-7 (Onifer et al., 2008), and one for WN8-9 and Ofpe/WN9 (CMFGEN website). Given that the high ISM column density obscures keV, the optical depths over the observable range are sufficiently low such that the radiative transfer is well into the optically thin limit.
The only free parameter in the model is the ISM absorbing column, . Table 1 (center) shows the fitting results for each model obtained with XSpec. The best-fit value is = 1.11023 cm-2, which we use to make all X-ray images and spectra in this paper.
3 Results
Figs. 2 & 3 (left) show the 4–9 keV images and the 2′′–5′′ ring spectra for all models. To compare the model and data images more quantitatively, Fig. 3 (right) shows the 4–9 keV intensity as a function of projected radius from Sgr A∗.
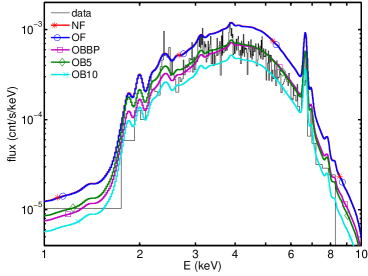
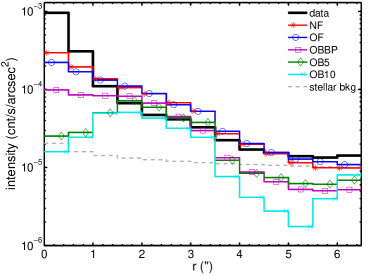
A noteworthy achievement of the model is the agreement in the spectral shape (Fig. 3, left). This provides strong evidence that the WR wind-wind collisions are the dominant source of X-ray emission around Sgr A∗. The temperature of the gas around Sgr A∗ is naturally explained by the WR shocked material, validating the wind speeds of the WR stars used in the simulations.
The model that best agrees with the observation over 2′′–5′′ (excluding IRS 13E and the PWN) is the medium-strength feedback model OB5 (see Table 1, right). The ratio of the model-to-data flux over 4–9 keV is 0.92 and 1.20 in the image and spectral comparison, yielding a mean discrepancy of the model flux being 6% higher than the data.
The largest disagreement is the IRS 13E cluster (model/data 7), indicating that its WC and WN winds should be revised downward to agree with the X-ray observations.
4 Conclusions
We compute the thermal X-ray properties of the Galactic centre from hydrodynamic simulations of the 30 WR stars orbiting within 12′′ of Sgr A∗ (Cuadra et al., 2008, 2015). These simulations use different feedback models from the SMBH at its centre. The Chandra X-ray Visionary Program observations (Wang et al., 2013) provide an anchor point for these simulations, so we compare the observed 12′′12′′ 4–9 keV image and the 2′′–5′′ ring spectrum with the same observables synthesized from the models. Remarkably, the shape of the model spectra, regardless of the type of feedback, agree very well with the data. This indicates the hot gas around Sgr A∗ is primarily from shocked WR wind material, and that the velocities of these winds are well constrained. The X-ray flux strongly depends on the feedback mechanism; greater SMBH outflows clear out more WR-ejected material around Sgr A∗, thus decreasing the model X-ray emission. Over 4–9 keV in energy and 2′′–5′′ in projected distance from Sgr A∗ (excluding IRS 13E and the nearby PWN), the X-ray emission from all models is within a factor of 2 of the observations, with the best model agreeing to within 10%; this is the medium-strength feedback model OB5, which has an SMBH outburst of yr-1 and = 5000 km s-1 from 400 to 100 yr ago. Therefore, this work shows that the SMBH outburst is required for fitting the X-ray data, and by extension that the outburst still affects the current X-ray emission around Sgr A∗, even though it ended 100 yr ago.
References
- Arnaud (1996) Arnaud, K. A. 1996, Astronomical Data Analysis Software and Systems V, ASP Conference Series, 101, 17
- Blandford & Begelman (1999) Blandford, R. D., & Begelman, M. C. 1999, MNRAS (Letters), 303, L1
- Crowther (2007) Crowther, P. A. 2007, ARAA, 45, 177
- Cuadra et al. (2008) Cuadra, J., Nayakshin, S., and Martins, F. 2008, MNRAS, 383, 458
- Cuadra et al. (2015) Cuadra, J., Nayakshin, S., and Wang, Q. D. 2015, MNRAS, 450, 277
- Leutenegger et al. (2010) Leutenegger, M. A., Cohen, D. H., Zsargó, J., Martell, E. M., MacArthur, J. P., Owocki, S. P., Gagné, M., & Hillier, D. J. 2010, ApJ, 719, 1767
- Onifer et al. (2008) Onifer, A., Heger, A., & Abdallah, J. 2008, The Metallicity Dependence of Wolf-Rayet Mass Loss, ASP Conference Series, 391, 305
- Ponti et al. (2010) Ponti, G., Terrier, R., Goldwurm, A., Belanger, G., & Trap, G. 2010, ApJ, 714, 732
- Price (2007) Price, D. J. 2007, PASA, 24, 159
- Russell (2013) Russell, C. M. P. 2013, Ph.D. thesis, Univ. Delaware
- Russell et al. (2016) Russell, C. M. P., Corcoran, M. F., Hamaguchi, K., Madura, T. I., Owocki, S. P., & Hillier, D. J. 2016, MNRAS, 458, 2275
- Russell, Wang & Cuadra (2016) Russell, C. M. P., Wang, Q. D., & Cuadra, J. 2016, MNRAS, in press, arXiv:1607.01562
- Smith et al. (2001) Smith, R. K., Brickhouse, N. S., Liedahl, D. A., & Raymond, J. C. 2001, ApJ Lett., 556, L91
- Verner & Yakovlev (1995) Verner, D. A., & Yakovlev, D. G. 1995, A&AS, 109, 125
- Wang et al. (2013) Wang, Q. D., Nowak, M. A., Markoff, S. B., Baganoff, F. K., Nayakshin, S., Yuan, F., Cuadra, J., Davis, J., Dexter, J., Fabian, A. C., Grosso, N., Haggard, D., Houck, J., Ji, L., Li, Z., Neilsen, J., Porquet, D., Ripple, F., & Shcherbakov, R. V. 2013, Science, 341, 981
- Wilms et al. (2000) Wilms, J., Allen, A., & McCray, R. 2000, ApJ, 542, 914