Cygnus X-3: Its Little Friend’s Counterpart, the Distance to Cygnus X-3, and Outflows/Jets
Abstract
Chandra observations have revealed a feature,within 16” of Cygnus X-3 which varied in phase with Cygnus X-3. This feature was shown to be a Bok globule which is along the line of sight to Cygnus X-3. We report on observations made with Submillimeter Array (SMA) to search for molecular emission from this globule, also known as Cygnus X-3’s “Little Friend.” We have found a counterpart in both 12CO (2-1) and 13CO (2-1) emission. From the velocity shift of the molecular lines we are able to find two probable distances based on the Bayesian model of Milky Way kinematics of Reid, et al. (2016). For the LF velocity of -47.5 km/s, we get a distance of (62% probability) and (38% probability). This yields a distance to Cyg X-3 of and , respectively. Based on the probabilities entailed, we take as the preferred distance to Cyg X-3. We also report the discovery of bipolar molecular outflow, suggesting that there is active star formation occurring within the Little Friend.
1 Introduction
Cygnus X-3 is a high mass X-ray binary (HXRB) which lies in the Galactic plane (79.84°, +0.70°). Its X-ray emission is modulated by a factor of on a 4.8 hour orbital period. At an estimated distance of 9 kpc (Predehl, et al., 2000), it lies behind two spiral arms of the Milky Way and the Cygnus X star forming region, giving an opportunity to use the X-ray emission from the HXRB to probe many types of ISM structures.
Examination of Chandra X-ray data has shown that a small knot of X-ray surface brightness (the “Little Friend” hereafter referred to as LF , see Figure 1) located 15.6″ from the binary is modulated with the same period, but shifted in phase by 0.56 (McCollough, Smith, & Valencic (2013) hereafter referred to as MSV). The phase shift and spectrum of the feature is consistent with the phenomenon of X-ray scattering by dust in the interstellar medium (Overbeck, 1965; Rolf, 1983).
The angular size, spectrum, and estimated distance to the feature of 7 kpc imply that the scattering comes from a dusty cloud (gas + dust) confined to a region 0.2 pc across. These are the characteristics of a Bok globule (Bok & Reilly, 1947; Clemens, et al., 1991). Since a Bok globule is a small molecular cloud we might expect that it could be detected in CO emission. To see if this is possible we have observed the LF with the Submillimeter Array (SMA) and compare resulting observations with the Chandra X-ray observations of the LF.
2 Observations
2.1 Chandra Observations
The Chandra observation used for this analysis was a 50 ksec quenched state observation (OBSID: 6601 (catalog ADS/Sa.CXO#obs/6601)). During this quenched state the X-ray was high (RXTE/ASM: 2-12 keV count rates were ) the hard X-ray very low (Swift/BAT:15-50 keV band had an average count rate of ), and the radio low (Ryle radio telescope:15 GHz radio fluxes were ). These values are all typical of a Cygnus X-3 quenched state (Szostek, et al., 2008; McCollough, et al., 1999; Waltman, et al., 1996).
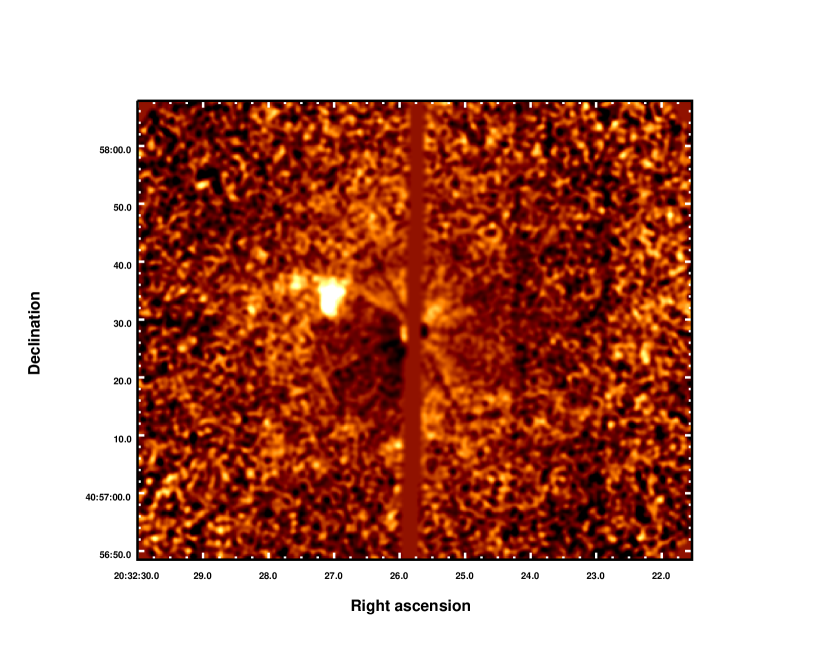
In order to understand the structure of the LF we used ZHTOOLS (Vikhlinin, 2012) to create and remove the PSF of Cygnus X-3. From the right half of the zero-order image we created a radial profile (mkprof) and in turn used this to create a Cygnus X-3 PSF image (prof2img). We then subtracted and normalized the image using the PSF image (imarith). We finally mask out the readout streak to improve the dynamic range of the image. The final smoothed image (3 pixel gaussian smooth) is shown in Figure 1. One can clearly see the LF as well as an extended feature to the left. This type of extension is typical of what is seen in Bok globules. A movie showing the Cygnus X-3 phase dependence of the LF has been created (see Figure 1). The dark vertical feature seen on the right side is instrumental (the result of a detector node boundary).
In our analysis of these observations, we used version 4.3 of the CIAO tools. The Chandra data retrieved from the archive were processed with ASCDS version 7.7.6 or higher.
2.2 Submillimeter Array (SMA) Observations
Two tracks of observations of Cygnus X-3’s LF were obtained with the SMA on 2015 September 7 and 2015 September 9 in the compact configuration with seven antennas, providing projected baselines ranging from 6 to 74 m. A single pointing was observed at a phase center of R.A.=20:32:27.1, decl.=40:57:33.8 (J2000). The observations were obtained with the 230 GHz receiver tuned to approximately 230 GHz (1.3 mm). The correlator was configured to provide simultaneous observations of the 12CO, 13CO, and C18O J lines along with the 230 GHz continuum. The observations were obtained in moderate weather conditions, with the zenith opacity at 225 GHz ranging between and the system temperatures ranging between K depending on elevation. Regular observations of the calibration sources sources mwc349a and bllac were interspersed with those of the LF for gain calibration. 3c454.3 was used for bandpass calibration, and Uranus and Neptune were used for absolute flux calibration. We conservatively estimate a 20% uncertainty in the absolute flux calibration. The data were inspected, flagged, and calibrated following standard techniques using the MIR software package111Available at https://www.cfa.harvard.edu/cqi/mircook.html. They were then imaged, again following standard techniques, using the Multichannel Image Reconstruction, Image Analysis, and Display (MIRIAD) software package configured for the SMA222Available at http://www.cfa.harvard.edu/sma/miriad/.
Combining both tracks, the continuum observations obtained a 1 rms of 1.1 mJy beam-1 at a central frequency of 226 GHz, with a beam size and position angle of 3.4′′ 2.5′′ and 65.2 degrees, respectively. The 12CO J observations obtained a 1 rms of 51 mJy beam-1 in 1.0 kms -1 channels, with a beam size and position angle of 3.3′′ 2.4′′ and 64.4 degrees, respectively. The 13CO J observations obtained a 1 rms of 40 mJy beam-1 in 2.5 kms -1 channels, with a beam size and position angle of 3.4′′ 2.5′′ and 64.4 degrees, respectively. The C18O are not discussed here.
3 Counterpart to Cygnus X-3’s Little Friend
From the SMA obsevations we found the following:
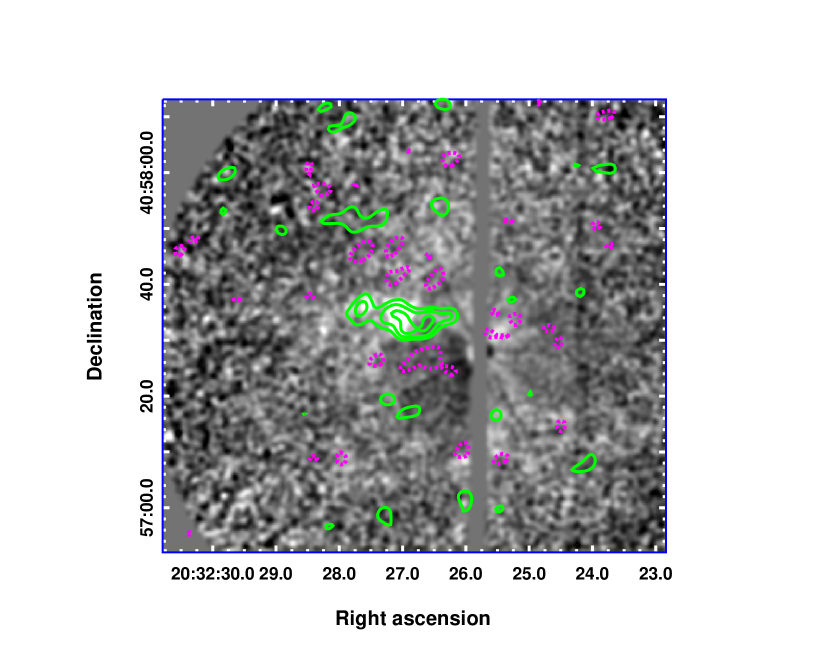
Confirmation of Bok globule properties: We clearly detect the LF both in 12CO (2-1) and 13CO (2-1) in the velocity range between -44 km/s and -49 km/s. Since the 13CO (2-1) emission is less abundant than 12CO (2-1), detectable emission is confined to the globule itself. It is thus less spatially extended than the 12CO (2-1) emission and less subjected to spatial filtering in the interferometer observations, and as a result it is expected to be a better tracer of the globule structure. Indeed, it closely matches the structure seen in the X-ray. In Figure 2 we see that the strongest 13CO (2-1) emission which is observed at -47.5 km/sec (represented by the contours) overlays the X-ray emission from the LF.
Dust cloud properties: We did not detect any continuum thermal dust emission in our observations. The noise in the continuum at 1.3 mm was in our observation. This non-detection of the dust continuum means that the LF must at the low mass end of what is expected for Bok Globules. Using our lower flux limit we find a mass limit of (total gas+dust mass, so a dust mass upper limit of assuming a standard gas-to-dust ratio). This estimate is subject to factors of two uncertainty depending on the exact temperature and opacity of the dust grains. This constrains the Bok Globule to be on the lower end of the mass range inferred from the X-ray data.
The Distance to the Little Friend: If we assume that the velocity shift of the CO (2-1) line is primarily due to Galactic rotation, this will allowed us to pinpoint the distance to the LF. Based on a study of trigonometric parallaxes of star-forming regions, Reid, et al. (2009) provide a method and code that allows us to calculate the kinematic distance to the LF. Using the location of the LF () we calculate the kinematic distance as a function of velocity using the code from Reid, et al. (2009) with updated Solar parameters values from model A5 of Reid, et al. (2014). We estimated the error in the distance by assuming a systematic errors of in velocity measurements() as was done in Reid, et al. (2009). We find that for a velocity of -47.5 km/sec the LF has a distance of .
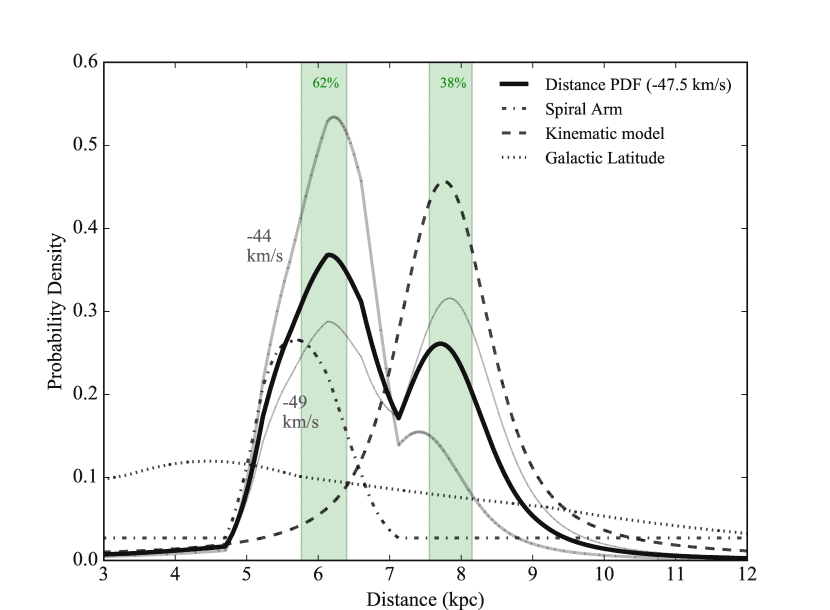
But Xu, et al. (2006) have noted that parts of the Perseus arm (which is in the direction of the little friend) have shown anomalous motions which may lead to larger errors in the estimated kinematic distances. To address this we used a parallax-based distance estimator tool 333Available at http://bessel.vlbi-astrometry.org/bayesian (Reid, et al., 2016) which uses a Bayesian approach to account for spiral arm signatures, kinematic distance estimates, Galactic latitude, and measured parallaxes to determine a source distances and its associated probabilities. We ran this tool using a velocity of -47.5 km/sec for the LF and arrive at a distance of with a 62 % probability (see Figure 3). We also find a secondary peak (38 % probability) at which corresponds to what we found from the kinematic distance estimate alone. It should be noted that the at the largest velocity () at which we detect CO emission the probability for these two locations become equal.
This confirming that the LF is the most distant Bok Globule known to date. The size of central X-ray and CO (2-1) emission of the LF is from a region of size corresponding to . For the distance of 6.08 kpc it is of interest to note that the LF will be located in the middle of the Perseus arm at a location where the local branch joints it (Xu, et al., 2013). This is an area for which one would expect to find active star formation.
4 Distance to Cygnus X-3
Now that we have the distance to the LF we can use the X-ray small angle scattering relationship between the LF and Cygnus X-3 (Equation 3 of MSV)
| (1) |
to determine the distance to Cygnus X-3. From MSV we know where is the observed orbital period of Cygnus X-3, , and is the distance to the LF. We find the fractional distance of the Little Friend to be which in turn gives us the a distance to Cygnus X-3 of Based on the probabilities entailed, we take as the preferred distance to Cyg X-3. This value is in good agreement with the best distance estimate of 7.2 kpc determined from the X-ray dust scattering halo (Ling, et al., 2009). This is one of the most precise determination of Cygnus X-3’s distance to date (currently uncertainty of 7-13 kpc from Predehl, et al. (2000)).
With the new preferred distance estimates to the LF and Cygnus X-3 we can reevaluate the relationship between the two (see the discussion in MSV). Taking the error in as the main factor in determining the uncertainty in the relative distance between Cygnus X-3 and the LF then we find they are between apart. Of the previously suggested relations the chance that this a random alignment is still a reasonable possibility given we are looking down the local arm and the LF is likely setting in the middle of the Perseus arm. This would also improve the microquasar jet-inflated bubble scenario as observed by Pakull, et al. (2010) as a possibility. However the supergiant bubble shell would be less of a possibility since the the LF is likely in a rich star forming region and Cygnus X-3 is now well outside of the spiral arm.
But these new results lead to another interesting explanation of the relationship between Cygnus X-3 and the LF. The progenitor of Cygnus X-3 is expected to be a binary composed of two Wolf-Rayet stars which was created in a star-forming region such as were the LF was found. When an X-ray binary is formed there is strong observational evidence that it experiences a natal kick from the supernova explosion (see Wong, et al. (2014) and reference therein). If we take the separation to be and assume that the SN explosion that created Cygnus X-3 was between ago (lifetime of Wolf-Rayet star) we then would get a natal kick of between , well within the range has been observed for other X-ray binaries and pulsars (Wong, et al., 2014). Hanson, Still, & Fender (2000) constrained the magnitude of systemic radial velocity of Cygnus X-3 to be making the lower value of natal kick and hence the longer time since the SN more probable. Whereas Paerels, et al. (2016) find clear indications of an redshift of Cygnus X-3’s X-ray line spectra which is consistent with the upper bound of the estimated natal kick. Thus the relationship between Cygnus X-3 and the LF and their separation can be explained in terms of natal kick at time of the formation the Cygnus X-3 as an X-ray binary. This also explains why Cygnus X-3 does not appear to currently be in an area of rich star-formation.
5 Cygnus X-3 Little Friend’s Outflows/Jets:
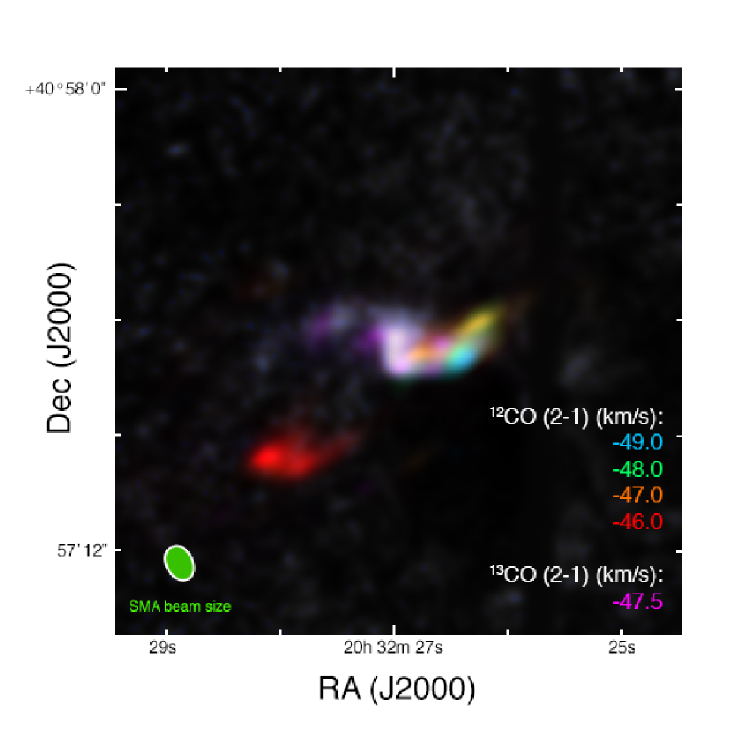
A somewhat unexpected result of these observations is clear evidence of outflows/jets from the LF in both 12CO (2-1) and 13CO (2-1) (see Figures 2, 4, and 5). Such outflows/jets are know to occur in molecular clouds (Arce, et al., 2007; Frank, et al., 2014). This clearly indicates that a protostar has formed in the LF and a molecular outflow has started to occur.
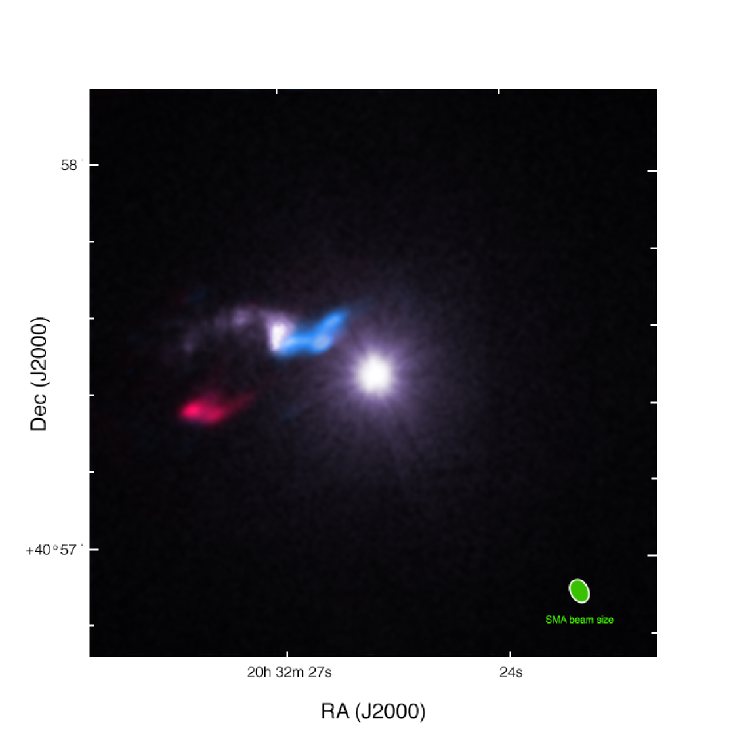
In Figure 4 we can see prominent blue and red-shifted outflows/jets coming from the LF. The blue-shifted component (relative velocity range of 0 to -2 km/sec) extends out 14″ ( pc) with an axial ratio of . The red-shifted component (relative velocity of -1 km/sec) extends out 18″ ( pc) with an axial ratio of . The blue-shifted component also shows a bend in the outflow/jet at about 7″ ( pc) from the LF and make a change in the flow. The highest observed velocity (-2 km/sec) flow appears as two knots with one located at the LF and other at the bend in the outflow/jet. The knots may indicate the location of where a shock is occurring in the outflow. From Figure 2 the 13CO (2-1) emission extends from the LF to the point at which the outflow bends. The red-shifted component (1 km/sec) shows evidence of possible of knots near its end. Similar low velocity bipolar molecular outflows have been observed in other low-mass star forming clouds (Dunham, et al., 2011). Figure 5 shows the velocity structure of the outflow/jet. The structure that is observed may be the result of precession of the protostar or an interaction with the ISM. What this indicate is that we are seeing a jet + outflow (wind) from a newly emerging protostar with the possibility of shocks occurring.
Outflows as signposts of star formation are very commonly detected. In order to compare the outflow driven by the LF, located at a distance of 6.08 kpc, with those driven by typical low-mass protostars in nearby ( pc) Gould Belt clouds, we use the 12CO data to calculate the mass of the LF outflow. We assume optically thin, LTE emission at an excitation temperature of 50 K (Dunham, et al., 2014), and follow the procedures outlined in Dunham, et al. (2014) (see their Appendix C) to convert from brightness temperature to total outflow mass. The resulting outflow mass is . 444 For the secondary distance peak the outflow would correspond to Comparing to recent surveys of outflows driven by low-mass protostars in the nearby ( pc) Gould Belt clouds (e.g., Curtis, et al. (2010); Dunham, et al. (2014)), the LF outflow is within but near the top end of the range of measured outflow masses ( to a few tenths of a ). Thus this detection, at 6.08 kpc, is consistent with an outflow driven by a low-mass protostar, and suggests an outflow near the top end of the mass scale for these types of regions.
6 Summary
In this study we have found the molecular counterpart to the first, and to date the most distant, Bok globule to have been seen in the X-ray. Also as a result of this work we have determined the most accurate distance to Cygnus X-3 to date ( 15%). Also as of result of this analysis we provide insight into where Cygnus X-3 likely formed and an estimate of a natal kick it received when the X-ray binary was formed via a SN explosion. In Figure 4 we see what can best be described as a stellar cycle of life. We have in the X-ray from Cygnus X-3, a X-ray binary with a compact object representing an endpoint of stellar evolution. Also in the X-ray from the scattered X-rays of Cygnus X-3 we see a Bok globule (the LF), a small dense molecular cloud, from which stars are know to form. Finally in CO emission we see outflows/jets from the LF which give a clear indication that a protostar has indeed formed and is creating an outflow.
7 Acknowledgments
MLM wished to acknowledge support from NASA under contract NAS8-03060. This research has made use of data obtained from the Chandra Data Archive and software provided by the Chandra X-ray Center (CXC). MMD acknowledges support from the Submillimeter Array (SMA) through an SMA postdoctoral fellowship, and from NASA through grant NNX13AE54G. Support for the work by LRC came in part from the NASA Earth and Space Science Fellowship Program, grant NNX11AO09H. This work is based primarily on observations obtained with the Submillimeter Array, a joint project between the Smithsonian Astrophysical Observatory and the Academia Sinica Institute of Astronomy and Astrophysics and funded by the Smithsonian Institution and the Academia Sinica. Special thanks to J.DePasquale for the help with the composite X-ray and CO images. We wish to thank the referee for pointing out several important papers which have improved this work.
References
- Arce, et al. (2007) Arce, H. G., et al. 2007, ”Molecular Outflows in Low- and High-Mass Star-forming Regions”, Protostars and Planets V, B. Reipurth, D. Jewitt, and K. Keil (eds.), University of Arizona Press, Tucson, p.245-260
- Brand & Blitz (1993) Brand, J. & Blitz, L. 1993, A&A, 275, 67
- Curtis, et al. (2010) Curtis, E. I., Richer, J. S., Swift, J. J., & Williams, J. P. 2010, MNRAS, 408, 1516
- Dunham, et al. (2014) Dunham, M. M., Arce, H. G., Mardones, D., et al. 2014, ApJ, 783, 29
- Dunham, et al. (2011) Dunham, M. M., Chen, X., Arce, H. G., et al. 2011, ApJ, 742, 1
- Frank, et al. (2014) Frank, A., et al. 2014, ”Jets and Outflows from Star to Cloud: Observations Confront Theory”, Protostars and Planets VI, Henrik Beuther, Ralf S. Klessen, Cornelis P. Dullemond, and Thomas Henning (eds.), University of Arizona Press, Tucson, p.451-474
- Bok & Reilly (1947) Bok, B. J. & Reilly, E. F. 1947, ApJ, 105 , 255
- Clemens, et al. (1991) Clemens, D. P., Yun, J. L., & Heyer, M. H. 1991, ApJS, 75 , 877
- Hanson, Still, & Fender (2000) Hanson, M. M., Still, M. D. & Fender, R. P. 2000, ApJ, 541, 308
- Jørgensen, et al. (2007) Jørgensen, J., et al. 2007, ApJ, 659, 479
- Launhardt, R., et al. (2010) Launhardt, R., Nutter, D., Ward-Thompson, D. et al. 2010, ApJS, 188, 139
- Ling, et al. (2009) Ling, Z., Zhang, S. & Tang, S.. 2009, ApJ, 695, 1111
- Mathis & Lee (1991) Mathis, J. S. & Lee, C.-W, S. 1991, ApJ, 376, 490
- McCollough, Smith, & Valencic (2013) McCollough, M. L., Smith, R. K., & Valencic, L. A2013, ApJ, 762, 2 (MSV)
- McCollough, et al. (1999) McCollough, M. L., et al. 1999, ApJ, 517, 951
- Overbeck (1965) Overbeck, J. W. 1965, ApJ, 141, 864
- Pakull, et al. (2010) Pakull, M. W., Soria, R., & Motch, C. 2010, Nature, 466, 209
- Paerels, et al. (2016) Paerels, F. et al. 2000, ApJ, 533, L135
- Pooley (2011) Pooley, G. G. 2011, Monitoring of variable sources, X-ray binaries and AGN, at 15 GHz, http://www.mrao.cam.ac.uk/guy/
- Predehl, et al. (2000) Predehl P., Burwitz, V., Paerels, F., & Trümpler, J. 2000, A&A, 357, L25
- Reid, et al. (2016) Reid, M. J. et al. 2016, ApJ, 823, 77
- Reid, et al. (2014) Reid, M. J. et al. 2014, ApJ, 783, 130
- Reid, et al. (2009) Reid, M. J. et al. 2009, ApJ, 700, 137
- Rolf (1983) Rolf, D. P. 1983, Nature, 302, 46
- Szostek, et al. (2008) Szostek, A. , Zdziarski, A. A., & McCollough, M. L. 2008, MNRAS, 388, 1001
- Vikhlinin (2012) Vikhlinin, A. 2012, ZHTOOLS: X-ray data analysis, http://hea-www.harvard.edu/RD/zhtools/
- Waltman, et al. (1996) Waltman, E. B. et al. 1996, AJ, 112 , 2690
- Wong, et al. (2014) Wong, T.-W. et al. 2014, ApJ, 790 , 119
- Xu, et al. (2013) Xu, Y., Li, J.J., Reid, M. J., et al. 2013, ApJ, 769 , 15
- Xu, et al. (2006) Xu, Y., Reid, M. J., Zheng, X. W. et al. 2006, Science, 311 , 54