Microwave-free nuclear magnetic resonance at molecular scales
Abstract
The implementation of nuclear magnetic resonance (NMR) at the nanoscale is a major challenge, as conventional systems require relatively large ensembles of spins and limit resolution to mesoscopic scales. New approaches based on quantum spin probes, such as the nitrogen-vacancy (NV) centre in diamond, have recently achieved nano-NMR under ambient conditions. However, the measurement protocols require application of complex microwave pulse sequences of high precision and relatively high power, placing limitations on the design and scalability of these techniques. Here we demonstrate a microwave-free method for nanoscale NMR using the NV centre, which is a far less invasive, and vastly simpler measurement protocol. By utilising a carefully tuned magnetic cross-relaxation interaction between a subsurface NV spin and an external, organic environment of proton spins, we demonstrate NMR spectroscopy of 1H within a sensing volume. We also theoretically and experimentally show that the sensitivity of our approach matches that of existing microwave control-based techniques using the NV centre. Removing the requirement for coherent manipulation of either the NV or the environmental spin quantum states represents a significant step towards the development of robust, non-invasive nanoscale NMR probes.
I Introduction
The discovery of nuclear magnetic resonance (NMR), and its related technologies, was one of the great scientific achievements of the 20th century, contributing to significant advances in areas ranging from materials science to healthcare. However, the limitation in sensitivity of traditional induction-based detection has required the development of new methods in order to extend NMR technology to the nanoscale, where the study of processes at the molecular scale is of intense interest. The nitrogen-vacancy (NV) centre in diamond Doherty2013 has seen remarkable developments as a high sensitivity nanoscale magnetometer Chernobrod2005 ; Degen2008 ; Taylor2008 ; Balasubramanian2008 ; Maze2008 ; Cole2009 ; Hall2009 ; Rondin2014 ; Schirhagl2014 . In recent years, the NV centre has been utilised to achieve nanoscale NMR at sensitivities close to that required for single proton detection Mamin2013 ; Staudacher2013 ; Loretz2014 ; Muller2014 ; DeVience2015 ; Lovchinsky2016 . Its room-temperature operation also makes it an ideal candidate for biological nano-NMR McGuinness2011 ; Shi2015 . However, current NMR protocols using the NV centre require the application of complex, high-power and high-precision microwave pulsing sequences in order to filter the environmental spectrum, placing significant constraints on nano-magnetic resonance imaging applications Loretz2015 . The application of strong microwave pulses is potentially invasive given the attendant electric fields as an inevitable by-product in the generation of the magnetic control fields. In addition, achieving such quantum control on a large ensemble of NV centres over a wide field of view Simpson2016 , or on a scanning probe microscopy tip Maletinsky2012 ; Tetienne2014 ; Tetienne2016 , remains a challenge due to the requirement for homogeneity in the driving field. Finally, the adaptability of such high-precision control to dynamic environments such as in vitro McGuinness2011 is unknown.
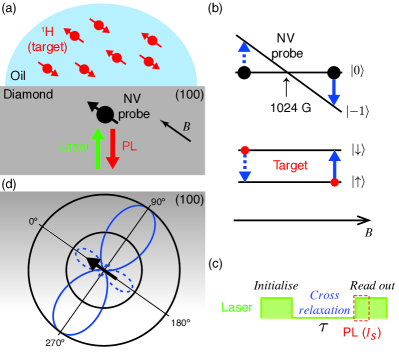
In this work, we demonstrate microwave-free nano-NMR on a nanoscopic sample of proton nuclear spins within an organic sample external to the diamond (Fig. 1a). We achieve this via static field tuning to the natural spin interactions between sensor and target, and measure a change in the longitudinal relaxation time, Hall2016 . The resulting all-optical microwave-free protocol can be applied in a non-invasive manner (e.g., through optical excitation constrained within the diamond using total internal reflection Clevenson2015 ), significantly widening the range of applications where NV-based nano-NMR can be used. We demonstrate the microwave-free NMR technique using both isotopic forms 14NV and 15NV, which exhibit different fundamental characteristics in this context, and use the data to estimate the NV-sample distance ( nm for the studied NVs) as well as the number of protons detected (). In addition, we directly compare our microwave-free nano-NMR to the prevailing microwave control based nano-NMR technique, and find that both approaches offer comparable sensitivity.
II Principle of -NMR
The microwave-free technique for magnetic resonance spectroscopy is based on relaxometry detection Cole2009 ; Kaufmann2013 ; Steinert2013 ; Tetienne2013 ; Sushkov2014 and precise magnetic field tuning to bring the NV into resonance with the Zeeman split target spin transitions Hall2016 . This technique was proposed and demonstrated for electron spin resonance spectroscopy using an ensemble of NV centres Hall2016 and extended to hyperfine-coupled nuclear spin spectroscopy with single NV centres Wood2016 . The ultimate goal of nano-NMR is the spectroscopic detection of bare nuclear spins in molecular systems. Without the assistance of strong hyperfine coupling this is a significant challenge due to the low nuclear magnetic moment Wood2016 ; Broadway2016 . Applying the -NMR technique to this problem requires the precise tuning of the NV probe to near its ground state level anti-crossing (GSLAC), where the system’s dynamics are dominated by a relatively complex landscape of electron-nuclear spin mixing He1993 ; Epstein2005 ; Broadway2016 , in order to bring the electronic NV transitions into resonance with the nuclear spin transition. At a resonance point (which in principle could occur both before and after the GSLAC as depicted in Fig. 1b), the longitudinal relaxation time of both the NV centre and the environmental spin(s) are significantly reduced, due to their mutual dipole-dipole interaction Hall2016 ; Wood2016 ; Jarmola2012 . In order to probe these resonances, the strength, , of a static background magnetic field aligned with the NV quantisation axis, is swept near the GSLAC ( G) and the decay is optically measured at each corresponding transition frequency.
The transitions associated with two simple resonances before and after the GSLAC are depicted in Fig. 1b. The relaxation rate of the initialised NV spin state to , induced at one of these resonances (over and above the intrinsic relaxation rate , assumed constant in the field range considered), is set by the sum of the contributions of all resonant target spins, . The contribution of each th spin can be expressed as Wood2016
| (1) |
where and are the gyromagnetic ratios of the NV and target spins, respectively; is the polar angle of separation between the two spins relative to the quantisation axis; is the separation distance; is the total dephasing rate of the spin system; is the vacuum permeability; is Planck’s constant; and the sign refers to the resonance after () and before () the GSLAC. Near resonance, the photoluminescence (PL) signal after an evolution time is given by Steinert2013 ; Kaufmann2013 ; SI
| (2) |
where is a normalisation constant, is the PL contrast of the decay, and the total relaxation rate is Hall2016
| (3) |
with the NV transition frequency and the Larmor frequency of the target spin, which vary with as depicted in Fig. 1b. Eq. (2) is valid when the intrinsic relaxation () is dominated by magnetic noise acting on the transition, which is generally the case near the GSLAC SI . Experimentally, rather than recording a full curve , it is generally sufficient to probe a single, well chosen value of , from which one can retrieve using Eq. (2), provided and are initially calibrated via measurement of a full decay trace at a given . Such a single-point measurement is done via an initialise, wait, and read-out scheme (Fig. 1c), without any microwave pulsing of either the NV spin or target spin. We note that the relaxation rate induced by each target spin, expressed by Eq. (1), has a different overall angular dependence for the two resonances before and after the GSLAC, as illustrated in Fig. 1d. This difference allows to be inferred, in the case of a single target spin, by directly comparing the transition strengths on either side of the GSLAC.
The simplified picture of resonances near the GSLAC shown in Fig. 1b is in reality modified by hyperfine interactions within the NV centre, associated with the nitrogen nuclear spin which is either 14N (spin-1) or 15N (spin-1/2) He1993 ; Epstein2005 ; Broadway2016 . While sensing experiments generally use implanted 15NV centres, as they can be distinguished from native centres of the most abundant isotope, 14N Rabeau2006 , it has become apparent from recent experiments Broadway2016 that 14NV and 15NV centres present distinct differences when considering their application for -NMR spectroscopy due to their different GSLAC electron-nuclear state mixing properties Broadway2016 . For this reason, both isotopic forms of the NV probe were investigated in this work.
III Nano-NMR detection of 1H spins
To demonstrate -based NMR, a custom-built confocal microscope was used, incorporating a permanent magnet mounted on a 3-axis scanning stage to precisely control the applied background field Wood2016 . The diamond sample comprises a high purity CVD homoepitaxial layer, grown in a Seki AX6500 diamond reactor. The sample was implanted firstly with 3.5 keV ions and then with 3.5 keV ions (expected implantation depth in the range nm Lehtinen2016 ). Both implants were done to a dose of cm-2 and this was followed by annealing in vacuum at C and acid cleaning in a boiling mixture of sulphuric acid and sodium nitrate. The diamond has a (100) surface, so that the NV centres have their symmetry axis at to the surface normal (see Figs. 1a and 1d). The NV centres were identified as either 15NV or 14NV via their characteristic hyperfine splittings under low-power optically detected magnetic resonance (ODMR) Rabeau2006 ; Dreau2011 . As a standard proton sample, we used either the oil employed with the oil-immersion objective lens, or a layer of Poly(methyl methacrylate) (PMMA) deposited on the diamond surface Staudacher2013 ; Mamin2013 .
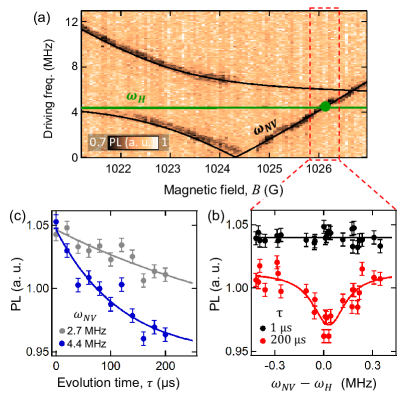
We first report the results of -NMR using a 14NV centre. The ODMR spectrum as a function of the background field strength () around 1024 G is shown in Fig. 2a, revealing a characteristic GSLAC structure resulting from hyperfine couplings and dynamic polarisation of the NV nuclear spin Broadway2016 ; Jacques2009 . The NV transitions are shown as black lines, while the 1H spin transition is shown in green and corresponds to a Larmor frequency MHz in this range of fields. Due to the NV avoided crossing before the GSLAC, there is only one measurable resonance point with 1H (green dot in Fig. 2a). To probe this resonance, the PL intensity is measured as a function of , using evolution times s, which serves as reference for normalisation (as no decay is expected at such time scale), and s, optimised to probe the 1H resonance. The resulting -NMR spectrum is shown in Fig. 2b, plotted against the detuning , where is the NV transition frequency obtained from fitting the ODMR spectrum. A dip in the s data is clearly observed at the expected 1H frequency. Full curves measured on resonance ( MHz) and off resonance ( MHz) are shown in Fig. 2c, confirming a change in relaxation time. Fitting the two curves to Eq. (2) yields the values s-1 and s-1. The proton signal was confirmed to be associated primarily with the immersion oil, as the signal significantly reduced upon removal of the oil SI .
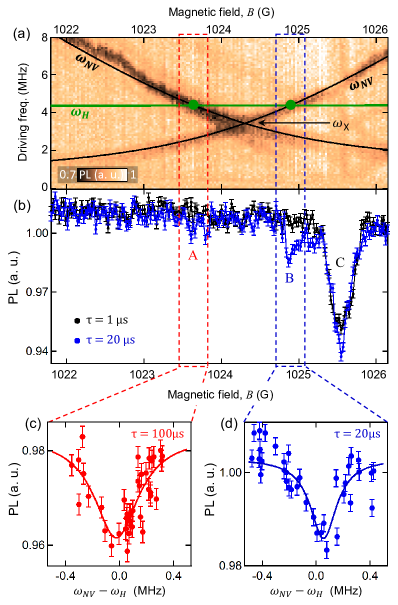
We now demonstrate -NMR using a 15NV centre from the same diamond and proton sample (immersion oil) as was used in the 14NV case. In Ref. Broadway2016 , it has been shown that a typical 15NV exhibits two potential resonances with 1H, before and after the GSLAC, but that the stronger after-GSLAC resonance overlaps with a feature intrinsic to the GSLAC structure. To circumvent this problem and allow the two resonances to be observed, we selected a 15NV centre exhibiting a hyperfine coupling (here of MHz) to a nearby 13C, thereby shifting the intrinsic feature away from the NV-proton resonance Dreau2012 ; SI . The results for this particular 15NV centre are shown in Fig. 3. The ODMR spectrum as a function of around 1024 G is shown in Fig. 3a, revealing the characteristic 15NV GSLAC structure Broadway2016 . The two dominant transitions (black lines) cross at a frequency MHz, which is lower than the Larmor frequency of 1H in this range of fields (, green line). For each value of , we define as the NV transition frequency of the upper branch, i.e. . The two expected 1H resonance points, , are shown as green dots in Fig. 3a. A -NMR spectrum recorded using evolution times s (reference) and s is shown in Fig. 3b and reveals three main features, labelled A, B and C. The first two dips (A and B) are seen only for s and correspond to the cross-relaxation resonances with 1H. The third dip, (C), exhibiting a far stronger decay, which is also visible at short time s, corresponds to the intrinsic feature discussed above Broadway2016 .
From Fig. 3b, it can be seen that the lower-field 1H resonance (feature A) is significantly weaker than the higher-field resonance (feature B). To resolve this resonance more clearly, a longer evolution time, s, was employed resulting in the spectrum shown in Fig. 3c plotted against the detuning . Fitting the data to Eq. (2) along with Eq. (3) gives s-1 and s-1 for this resonance. Similarly, the spectrum around the 1H resonance past the GSLAC (Fig. 3d) is fitted to give s-1 and s-1. The measured ratio between the extrinsic relaxation rates of the two resonances is . This is in qualitative agreement with the ratio of 6.3 predicted by integrating Eq. (1) over a semi-infinite bath of protons on a (100) surface. This calculation neglects the effects of state mixing due to the GSLAC structure.
IV Comparison to -based NMR
We now report a theoretical and experimental comparison of -NMR spectroscopy to the prevailing existing technique of -based spectroscopy, which relies on locking a dynamical decoupling pulse sequence on the NV electronic spin state (usually XY8- where is the number of microwave pulses) to the nuclear spins’ Larmor frequency Staudacher2013 ; Loretz2014 ; Muller2014 ; DeVience2015 ; Pham2015 . Theoretically, the sensitivity can be compared by examining the signal-to-noise ratio (SNR) derived under the identical conditions of a shallow NV centre detecting an ensemble of nuclear spins as in the geometry of Fig. 1a. In the small signal regime (i.e., with for and for ), we find that the maximum SNR in and sensing schemes can be expressed as SI
| (4) | |||||
| (5) |
respectively, where , and are the intrinsic characteristic times of the NV centre. Note that here is the extended decoherence time under the considered dynamical decoupling sequence Pham2012 . The constant is given by
| (6) |
where is the photon count rate under continuous laser excitation, ns is the read-out time per pulse, is the total experiment time, is the proton density in the semi-infinite sample, and is the NV depth. Evaluating the numeric factors, we obtain the ratio between the SNRs,
| (7) |
For a near-surface NV centre in a bulk diamond ( nm), typical approximate values are s, ms and s, which yields a ratio . In other words, our microwave-free -based NMR spectroscopy technique is similarly sensitive to the existing -based approach without requiring complex microwave pulse sequences.
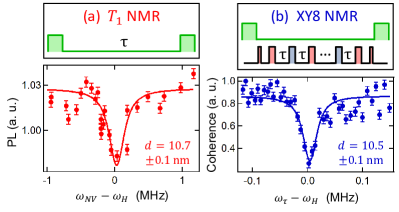
In order to verify this and further compare the two approaches, we conducted a comparative measurement using a single shallow 14NV centre, where the diamond was coated with a layer of PMMA. Fig. 4 shows the hydrogen spectrum measured via relaxometry (a) and via an XY8-256 sequence (b). Both spectra were acquired in a total time of about 2 hours, and show a clear feature at the 1H frequency with a similar signal-to-noise ratio. In addition, one can compare the NV depth, , inferred through fitting the appropriately normalised data from each method, assuming the signal comes from a semi-infinite bath of protons on a (100) surface SI . Using a proton density of , we find nm from the data, against nm from the XY8 data, indicating a high level of consistency between the two approaches. From the inferred depth, we deduce that 50% of the signal is generated by the closest protons, corresponding to a detection volume of about Staudacher2013 ; Loretz2014 .
The spectral resolution of spectroscopy, however, is currently limited by the dephasing rate (see Eq. (3)), while it is limited by with the XY8 method, and can be improved further using correlation spectroscopy Staudacher2015 ; Kong2015 ; Boss2016 . We note that both the sensitivity and spectral resolution of the approach could be dramatically improved by optimising , which motivates further work towards understanding and mitigating the decoherence of near-surface NV centres Myers2014 ; Rosskopf2014 ; Romach2015 .
V Conclusions
In summary, we have demonstrated the detection of proton spins external to a diamond using a microwave-free nano-NMR technique based on relaxometry of a single NV centre. While the electron-nuclear spin physics near the NV GSLAC are relatively complex, we have shown that the microwave-free protocol can nevertheless be implemented and the 1H resonances observed, which we have demonstrated using both isotopic forms of the NV centre. In addition, we have shown a sensitivity comparable to an existing nano-NMR protocol which requires quantum state manipulation via microwave excitation. The sensitivity as well as the spectral resolution of our approach could be improved via engineering of the diamond surface. We note that the resulting all-optical technique can be implemented using non-invasive excitation constrained within the diamond, using total internal reflection. The removal of microwave quantum control eliminates the possibility of spurious harmonics within the measurement and opens up applications in areas where such control is inherently difficult to achieve and/or invasive, such as spectroscopic imaging over wide fields of view or in scanning probe microscopy experiments.
Acknowledgements
This work was supported in part by the Australian Research Council (ARC) under the Centre of Excellence scheme (project No. CE110001027). L.C.L.H. acknowledges the support of an ARC Laureate Fellowship (project No. FL130100119). This work was supported in part by the Melbourne Centre for Nanofabrication (MCN) in the Victorian Node of the Australian National Fabrication Facility (ANFF).
References
- (1) M. W. Doherty, et al., The nitrogen-vacancy colour centre in diamond, Phys Rep 528, 1 (2013).
- (2) B. M. Chernobrod and G. P. Berman, Spin microscope based on optically detected magnetic resonance, J Appl. Phys. 97, 014903 (2005).
- (3) C. L. Degen, Scanning magnetic field microscope with a diamond single-spin sensor. Appl. Phys. Lett. 92, 243111 (2008).
- (4) J. M. Taylor, et al., High-sensitivity diamond magnetometer with nanoscale resolution, Nat. Phys. 4, 810 (2008).
- (5) G. Balasubramanian, et al., Nanoscale imaging magnetometry with diamond spins under ambient conditions, Nature 455, 648 (2008).
- (6) J. R. Maze, et al., Nanoscale magnetic sensing with an individual electronic spin in diamond, Nature 455, 644 (2008).
- (7) J. H. Cole, and L. C. L. Hollenberg, Scanning quantum decoherence microscopy, Nanotechnology 20, 495401 (2009).
- (8) L. T. Hall, J. H. Cole, C. D. Hill, and L. C. L. Hollenberg, Sensing of fluctuating nanoscale magnetic fields using nitrogen-vacancy centers in diamond, Phys. Rev. Lett. 103, 220802 (2009).
- (9) L. Rondin, J.-P. Tetienne, T. Hingant, J.-F. Roch, P. Maletinsky, and V. Jacques, Magnetometry with nitrogen-vacancy defects in diamond, Rep. Prog. Phys. 77, 056503 (2014).
- (10) R. Schirhagl, K. Chang, M. Loretz, and C. L. Degen, Nitrogen-vacancy centers in diamond: nanoscale sensors for physics and biology, Annu. Rev. Phys. Chem. 65, 83 (2014).
- (11) H. J. Mamin, M. Kim,, M. H. Sherwood, C. T. Rettner, K. Ohno, D. D. Awschalom, and D. Rugar, Nanoscale nuclear magnetic resonance with a nitrogen-vacancy spin sensor, Science 339, 557 (2013).
- (12) T. Staudacher, F. Shi, S. Pezzagna, J. Meijer, J. Du, C. A. Meriles, F. Reinhard, and J. Wrachtrup, Nuclear magnetic resonance spectroscopy on a (5-nanometer)3 sample volume, Science 339, 561 (2013).
- (13) M. Loretz, S. Pezzagna, J. Meijer, and C. L. Degen, Nanoscale nuclear magnetic resonance with a 1.9-nm-deep nitrogen-vacancy sensor, Appl. Phys. Lett. 104, 3 (2014).
- (14) C. Muller, et al., Nuclear magnetic resonance spectroscopy with single spin sensitivity, Nat. Commun. 5, 4703 (2014).
- (15) S. J. DeVience, et al., Nanoscale NMR spectroscopy and imaging of multiple nuclear species, Nat. Nano. 10, 129 (2015).
- (16) I. Lovchinsky et al., Nuclear magnetic resonance detection and spectroscopy of single proteins using quantum logic, Science 351, 836 (2016).
- (17) L. P. McGuinness et al., Quantum measurement and orientation tracking of fluorescent nanodiamonds inside living cells, Nat. Nano. 6, 358 (2011).
- (18) F. Shi, et al., Single-protein spin resonance spectroscopy under ambient conditions, Science 347, 1135 (2015).
- (19) M. Loretz,J. M. Boss, T. Rosskopf, H. J. Mamin, D. Rugar, and C. L. Degen, Spurious harmonic response of multipulse quantum sensing sequences, Phys. Rev. X 5, 021009 (2015).
- (20) D. A. Simpson, et al., Magneto-optical imaging of thin magnetic films using spins in diamond, Sci. Rep. 6, 22797 (2016).
- (21) P. Maletinsky et al., A robust scanning diamond sensor for nanoscale imaging with single nitrogen-vacancy centres, Nat. Nano. 7, 320 (2012).
- (22) J.-P. Tetienne, T. Hingant, J.-V. Kim, L. Herrera Diez, J.-P. Adam, K. Garcia, J.-F. Roch, S. Rohart, A. Thiaville, D. Ravelosona, V. Jacques, Nanoscale imaging and control of domain-wall hopping with a nitrogen-vacancy center microscope, Science, 344, 6190, 1366-1369 (2013).
- (23) J.-P. Tetienne, A. Lombard, D. A. Simpson, C. Ritchie, J. Lu, P. Mulvaney, L. C. L. Hollenberg, Scanning Nanospin Ensemble Microscope for Nanoscale Magnetic and Thermal Imaging, Nano Lett. 16, 326 (2016).
- (24) L. T. Hall, P. Kehayias, D. A. Simpson, A. Jarmola, A. Stacey, D. Budker, and L. C. L. Hollenberg, Detection of nanoscale electron spin resonance spectra demonstrated using nitrogen-vacancy centre probes in diamond, Nat. Commun. 7, 10211 (2016).
- (25) H. Clevenson, M. E. Trusheim, C. Teale, T. Schröder, D. Braje, D. Englund, Broadband magnetometry and temperature sensing with a light-trapping diamond waveguide, Nat. Phys. 11, 393 (2015).
- (26) S. Kaufmann, et al., Detection of atomic spin labels in a lipid bilayer using a single-spin nanodiamond probe, Proc. Natl. Acad. Sci. USA 110, 10894 (2013).
- (27) S. Steinert, et al., Magnetic spin imaging under ambient conditions with sub-cellular resolution, Nat. Commun. 4, 1607 (2013).
- (28) J.-P. Tetienne, et al., Spin relaxometry of single nitrogen-vacancy defects in diamond nanocrystals for magnetic noise sensing, Phys. Rev. B 87, 235436 (2013).
- (29) A. O. Sushkov et al., All-optical sensing of a single-molecule electron spin, Nano Letters 14, 6443 (2014).
- (30) J. D. A. Wood, D. A. Broadway, L. T. Hall, A. Stacey, D. A. Simpson, J-P. Tetienne, and L. C. L. Hollenberg, Wide-band, nanoscale magnetic resonance spectroscopy using quantum relaxation of a single spin in diamond, Phys. Rev. B 94, 155402 (2016).
- (31) D. A. Broadway, J. D. A. Wood, L. T. Hall, A. Stacey, M. Markham, D. A. Simpson, J-P. Tetienne, and L. C. L. Hollenberg, Spin dynamics of diamond nitrogen-vacancy centres at the ground state level anti-crossing and all-optical low frequency magnetic field sensing, arXiv:1607.04006 (2016).
- (32) X.-F. He, N. B. Manson, P. T. H. Fisk, Paramagnetic resonance of photoexcited N-V defects in diamond. I. Level anticrossing in the ground state, Phys. Rev. B 47, 8809 (1993).
- (33) R. J. Epstein, F. M. Mendoza, Y. K. Kato, D. D. Awschalom, Anisotropic interactions of a single spin and dark-spin spectroscopy in diamond, Nat. Phys. 1, 94 (2005).
- (34) A. Jarmola, V. M. Acosta, K. Jensen, S. Chemerisov, and D. Budker, Temperature-and magnetic-field-dependent longitudinal spin relaxation in nitrogen-vacancy ensembles in diamond, Phys. Rev. Lett. 108,197601 (2012).
- (35) See Supplemental Material.
- (36) J. R. Rabeau et al., Implantation of labelled single nitrogen vacancy centers in diamond using 15N, Appl. Phys. Lett. 88, 023113 (2006).
- (37) O. Lehtinen et al. Molecular dynamics simulations of shallow nitrogen and silicon implantation into diamond, Phys. Rev. B 93, 35202 (2016).
- (38) A. Dréau, M. Lesik, L. Rondin, P. Spinicelli, O. Arcizet, J.-F. Roch, and V. Jacques, Avoiding power broadening in optically detected magnetic resonance of single NV defects for enhanced dc magnetic field sensitivity, Phys. Rev. B 84, 195204 (2011).
- (39) V. Jacques, et al., Dynamic polarization of single nuclear spins by optical pumping of nitrogen-vacancy color centers in diamond at room temperature, Phys. Rev. Lett. 102, 057403 (2009).
- (40) A. Dréau, J. R. Maze, M. Lesik, J.-F. Roch, V. Jacques, High-resolution spectroscopy of single NV defects coupled with nearby 13C nuclear spins in diamond, Phys. Rev. B 85, 134107 (2012).
- (41) L. M Pham et al., NMR technique for determining the depth of shallow nitrogen-vacancy centers in diamond, Phys. Rev. B 93, 045425 (2015).
- (42) L. M. Pham et al., Enhanced solid-state multispin metrology using dynamical decoupling, Phys. Rev. B 86, 045214 (2012).
- (43) T. Staudacher, N. Raatz, S. Pezzagna, J. Meijer, F. Reinhard, C. A. Meriles, J. Wrachtrup, Probing molecular dynamics at the nanoscale via an individual paramagnetic centre, Nat. Comm. 6, 8527 (2015).
- (44) X. Kong, A. Stark, J. Du, L. P. McGuinness, F. Jelezko, Towards chemical structure resolution with nanoscale nuclear magnetic resonance spectroscopy, Phys. Rev. Applied 4, 024004 (2015).
- (45) J. M. Boss, K. Chang, J. Armijo, K. Cujia, T. Rosskopf, J. R. Maze, C. L. Degen, One- and Two-Dimensional Nuclear Magnetic Resonance Spectroscopy with a Diamond Quantum Sensor, Phys. Rev. Lett. 116, 197601 (2016).
- (46) B. A. Myers, A. Das, M. C. Dartiailh, K. Ohno, D. D. Awschalom, A. C. Bleszynski Jayich, Probing surface noise with depth-calibrated spins in diamond, Phys. Rev. Lett. 113, 027602 (2014).
- (47) T. Rosskopf et al., Investigation of surface magnetic noise by shallow spins in diamond, Phys. Rev. Lett. 112, 147602 (2014).
- (48) Y. Romach et al., Spectroscopy of Surface-Induced Noise Using Shallow Spins in Diamond, Phys. Rev. Lett. 114, 017601 (2015).