Near-field measurement of modal interference in optical nanofibers for sub-Angstrom radius sensitivity
Abstract
Optical nanofibers (ONF) of subwavelength dimensions confine light in modes with a strong evanescent field that can trap, probe, and manipulate nearby quantum systems. To measure the evanescent field and propagating modes, and to optimize ONF performance, a surface probe is desirable during fabrication. We demonstrate a nondestructive measurement of light propagation in ONFs by sampling the local evanescent field with a microfiber. This approach reveals the behavior of all propagating modes, and because the modal beat lengths in cylindrical waveguides depend strongly on radius, simultaneously provides exquisite sensitivity to the ONF radius. We show that our measured spatial frequencies provide a map of the average ONF radius (over a 600 micrometer window) along the 10 mm ONF waist with 40 picometer resolution and high signal-to-noise ratio. The measurements agree with scanning electron microscopy (SEM) to within SEM instrument resolution. This fast method is immune to polarization, intrinsic birefringence, mechanical vibrations, scattered light, and provides a set of constraints to protect from systematic errors in the measurements
I Introduction
The evanescent fields outside ONFs Tong et al. (2003) allow strong interactions with the surrounding medium Kien et al. (2005); Morrissey et al. (2013); Yalla et al. (2012); Fujiwara et al. (2011); Dawkins et al. (2011); Vetsch et al. (2010). These waveguides have enabled several advances in quantum information technologies, including optical switches O’Shea et al. (2013) and atom-mediated optical isolators Mitsch et al. (2014); Petersen et al. (2014), but have also facilitated fundamental experiments in nonlinear atom-light interactions Spillane et al. (2008), atom-number-resolving detection Béguin et al. (2014), electromagnetically induced transparency Sayrin et al. (2015); Gouraud et al. (2015); Jones et al. (2015); Kumar et al. (2015), and Bragg reflection from atoms Sørensen et al. ; Corzo et al. .
The control achieved in fabrication of high transmission ONFs in both the fundamental mode Hoffman et al. (2014) and higher-order modes (HOM) Ravets et al. (2013a) is excellent. A nondestructive tool to accurately measure the ONF radius and characterize the propagation of the modes is crucial for optimizing both fundamental and applied uses of ONFs. For example, the ONF radius, , governs the coupling between a nearby atom (trapped or free) and the allowed nanofiber modes (see e.g. Ref. Kien et al. (2005)). These modes have distinct effective refractive indices () that depend strongly on . We can use modal beating to extract both propagation properties and ONF geometry for optimizing atom-photon coupling. We recently examined propagation characteristics by imaging Rayleigh scattered (RS) light Hoffman et al. (2015). While RS is an effective tool for analyzing some propagation behavior, it uses far-field imaging and is hampered by excess scattered light, mechanical vibrations of the ONF, and imaging resolution so that only long-period modal beating can be cleanly resolved Hoffman et al. (2015); Szczurowski et al. (2011).
To circumvent the limitations of far-field imaging, contact techniques between an ONF and a microfiber probe have previously been used to measure the local radius variations of an ONF with sub-nanometer precision by propagating light through the microfiber probe and observing the mode spectrum of a whispering gallery or a composite photonic crystal cavity Birks et al. (2000); Sumetsky and Dulashko (2010); Semenova et al. (2015); Keloth et al. (2015). Though these approaches accurately measure ONF dimensions, they do not measure the propagation characteristics of the ONF. Other contact techniques rely on changes in the amplitude of the transmitted light, becoming sensitive to polarization and van der Waals forces, as in the recent work by Madsen et al. Madsen et al. , but do not directly sample the modal composition of the local field.
In this work, we measure the beat lengths between propagating nanofiber modes in the near field over the ONF length through evanescent coupling to a microfiber probe. This near-field approach provides high (1m) longitudinal resolution capable of measuring beating between any mode pairs and is immune to excess scattered light. The spatial frequencies are used to map the mean of the ONF radius to within 40 picometers over 600 m measurement windows along the ONF taper and waist. The amplitude of the beat frequency only enters in the signal to noise ratio of the resonance, which in this technique can be orders of magnitude better than those we obtained with Rayleigh scattering Hoffman et al. (2015).
II Theoretical Considerations
A standard optical fiber consists of a core of refractive index and radius , surrounded by a cladding with lower refractive index and radius . In our ONFs, is reduced to subwavelength dimensions by a flame-brush technique Hoffman et al. (2014). At these dimensions, the ONF can be considered as a simple dielectric of index = , surrounded by = 1.0, as the original fiber core becomes negligible. The tapers connecting the standard fiber on the input and output side to the ONF waist have milliradian angles for adiabatic propagation Ravets et al. (2013a).
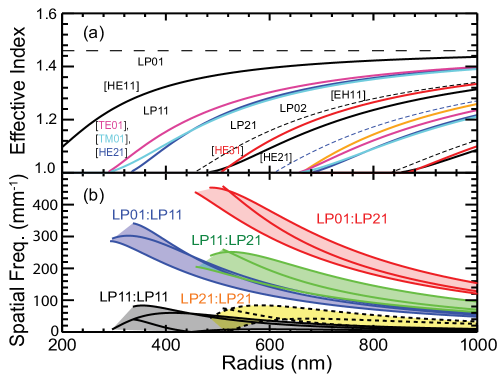
Each ONF mode has a waveguide propagation constant, = , where is the free-space propagation constant, 2. (See Fig. 1 for the dependence of and the spatial frequencies between specific mode pairs). decreases with , as the evanescent field samples more of the surrounding, lower index medium; when equals the surrounding index, the mode reaches cutoff and radiates out of the waveguide. Fig. 1(a) shows for several modes in an ONF as a function of . Because of the high index contrast (), several modes are allowed even when . In this strong guiding regime, the scalar linearly-polarized (LP) basis commonly used for standard optical fibers is replaced by a full vector mode basis, but for convenience we still use the basis to group the modes into families. For example, the , , and two degenerate modes all belong to the mode family. The family has two degenerate modes, so that between the and families, there are 6 unique beat frequencies.
Two modes with different and effective indices will interfere with beat length , corresponding to a spatial frequency . Figure 1(b) shows for several mode pairs in the lowest four mode families with groups of curves shaded according to which families are involved. As decreases, the curves end abruptly when one of the modes reaches cutoff. Near the cutoffs, interfamily beating is restricted to m (¿ 200 mm-1) (e.g. between the and families), while for intrafamily beating, m (¡ 100 mm-1).
III Experiment
The ONFs are drawn to design radii of 390 nm that support the and mode families. We use a stabilized diode laser with = 795 nm (Vescent D2-100-DBR) to launch superpositions of all 6 modes in the and families Ravets et al. (2013a) so that beat frequencies between all possible pairs of propagating modes can be observed on the waist.
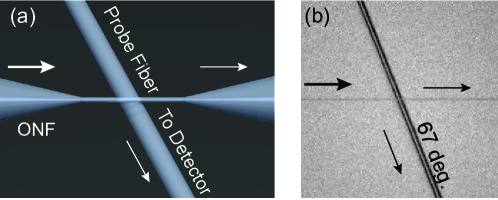
To detect the propagating light, we use a fiber probe with 6-m-diameter waist that contacts the ONF from below with a crossing angle of 67 degrees, as drawn in Fig. 2(a). Figure 2(b) shows an image of the probe fiber in contact with the ONF. The ONF has a taper angle = 1 mrad, a design waist = 390 nm, and waist length = 10 mm. At = 390 nm, the waist supports all modes in the and families at = 795 nm. A small crossing angle would provide excellent optical coupling to the probe fiber, but would decrease spatial resolution; a large crossing angle improves spatial resolution, but reduces optical coupling to propagating modes of the probe fiber. Our crossing angle is a compromise between these issues and restrictions due to optical mounts and the apparatus. The probe fiber is standard, single-mode SM750 optical fiber tapered in the same pulling apparatus. Because this probe fiber is highly multimode in the waist, only a small percentage of the evanescently-coupled light reaches the detector, which measures only the light guided in the probe fiber core. For our ONF, crossing angle, and probe fiber, the power detected is typically of the power propagating in the ONF waist (1–2 mW) for the modes of interest.
The contact point is translated at 20 m/sec over the ONF length by the same high-resolution stepper motors used during ONF fabrication to measure the propagation behavior in the ONF. Although this approach could lead to scratches on the ONF Sumetsky and Dulashko (2010), we monitored the transmitted power and intensity distribution before and after the measurement and saw no degradation. We have found that speeds slower than this can result in discontinuous signals due to stick-slip between the two fibers, but the ideal speed depends also on crossing angle and tension.
IV Results
IV.1 Propagation behavior
Figure 3 shows the detected light as a function of propagation distance () along the fiber. Fig. 3(a) shows the detected power from about 15 mm before the center of the waist on the input taper, and continues to 15 mm onto the output taper. The origin of the -axis is the middle of the approximately 10-mm-long waist . We choose this origin because the taper is nominally symmetric, making comparisons between the modal distribution in the input and output tapers apparent.
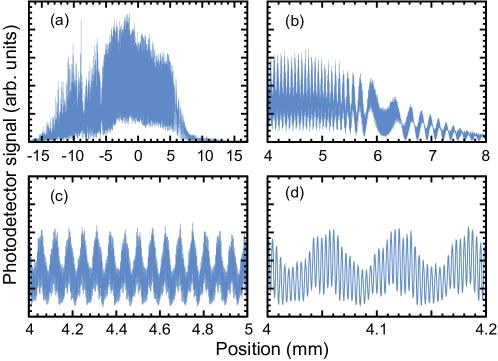
Several properties of the light propagation can be observed in Fig. 3. Because the field in the ONF is evanescently coupled to the probe fiber, the signal amplitude in Fig. 3(a) is largest on the waist ( mm). The detected power is significantly greater and more heavily structured on the input taper ( mm) than on the output taper ( mm), where the average signal amplitude smoothly decays with clean oscillations. This asymmetry is due to nonadiabaticity of the pull, causing excitation of higher-order modes when the light guidance transitions from core-cladding guidance to cladding-air guidance. On the input taper, these higher-order modes reach cutoff, eventually leaving only the and to interfere on the waist and output taper. This leads to fewer observed beat frequencies, shown in the region from mm of Fig. 3(b). Figs. 3(b)-(d) show successively narrower ranges of data near the output of the waist, with two beat length scales apparent in Fig. 3(d). The shorter length scale, with m, is due to interference between the and modes; the structure with m is due to intramodal interference between members of the family.
IV.2 Spectrogram analysis
We quantify the spatial frequencies and identify participating modes using spectrogram analysis Ravets et al. (2013b); Hoffman et al. (2015). Briefly, we Fourier transform the signals measured in Fig. 3(a) with a sliding window of 600 m width to calculate the local beat frequencies as a function of . Fig. 4(a) depicts the design profile for the fiber and Fig. 4(b) shows the resulting spectrogram.
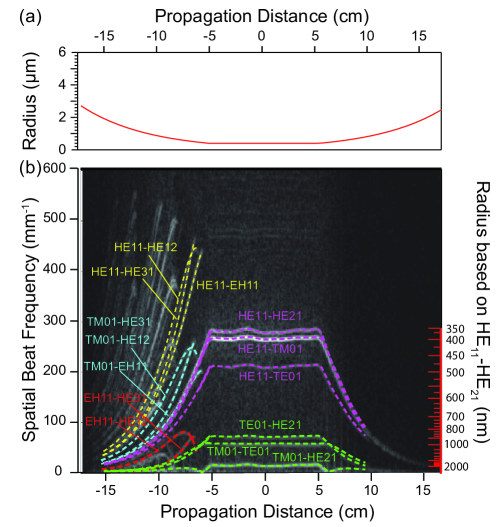
Each curve in Fig. 4(b) is due to the interference of two modes. On the input side ( mm), the complicated spatial structure observed in Fig. 3(a) is decomposed into numerous curves. Far from the waist, each curve begins with both low amplitude and low spatial frequency. The curves are less visible because in these regions most of the field is in the ONF, so the evanescent field is small. Also, the effective indices far from cutoff are all approximately , so the beat frequencies are low.
Closer to the waist, the curve amplitudes and spatial frequencies increase. Most of the curves abruptly end, similar to the calculations shown in Fig. 1(b). We show in Fig. 4(b) a number of calculated curves superimposed on the spectrogram to estimate . To label the unknown curves, we first determined the local as a function of using a single known spectrogram curve () and the calculations of Fig. 1(b). The right axis shows this conversion. Using this , other mode pairs can be identified by comparison to Fig. 4(b). The shortest visible beat lengths 2.0 m ( mm-1) are close to the shortest observable in fused silica corresponding to m ( 625 mm-1).
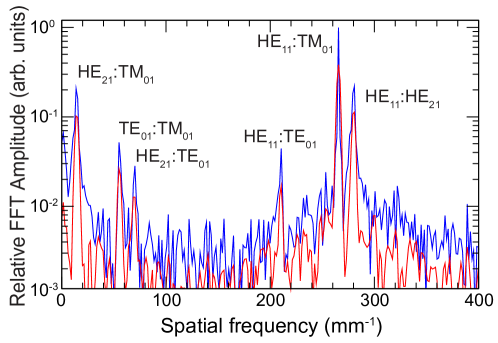
On the waist, only the fundamental (one mode) and first higher order (three modes) mode families can propagate, and the observed spatial frequencies are approximately constant. With these two mode families, there are 6 observable and nondegenerate pairs of interfering modes on the waist (other faint features near 500 mm-1 on the waist are due to aliasing artifacts). The fundamental mode interferes with the three nondegenerate modes of the family with spatial frequencies near =300 mm-1. Three additional frequencies below = 100 mm-1 occur due to interference between the modes within the family. The lowest frequency curve, corresponding to the interference, shows a zero crossing at mm, evident in the calculated curves shown in Fig. 1(b) near = 450 nm.
The observed interference is surprising, as these two modes are orthogonal everywhere and their individual modal powers are constant. In the Rayleigh scattering results of Ref.Hoffman et al. (2015), we observed no beating between these two modes for this reason. However, because our probe fiber is highly multimode at the point of contact and is single mode at the detector, the relative phase between the and modes that are evanescently coupled may affect the amount of light that reaches the detector, where the fiber is single mode, even though the strength of the evanescent field does not change.
IV.3 Fiber radius
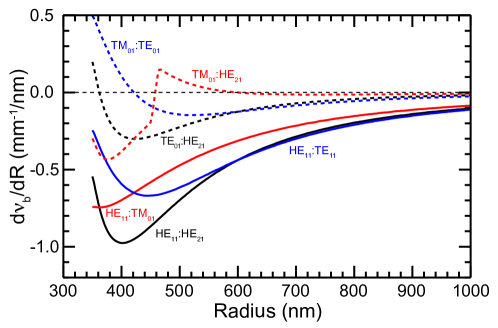
The beat length varies particularly steeply with near the mode cutoffs [Fig. 1(b) and Fig. 4(b)]. This property can be used to determine with high precision. Fig. 5 shows for each of the allowed mode pairs on the waist, at 795 nm. The sensitivity is particularly strong for the curves (solid lines), with the curve achieving = -1 mm-1/nm, and the curve achieving = -0.7 mm-1/nm at = 400 nm. Conversely, is insensitive to for the pair near =420 nm, and the pair near 360 nm. The spectrogram in Fig. 4(b) shows these characteristics clearly in the waist region of this ONF, which had a design radius of = 390 nm: The observed fluctuations in beat frequency are strongest for the curve, while the curve is constant. At larger , other mode pairs can be used for high sensitivity.
We can find not only the value of at a given point but map its local variations with high precision on the waist. To do this we determine the central frequencies of the features in each 600-m-long FFT window comprising the spectrogram as in Fig. 6. Over this window size, which is smaller than the flame diameter used for heating the fiber, the beat frequencies are relatively constant and the spectral features are transform-limited. Following the spectroscopic rule that the center of a resonance can be determined by its full width at half maximum (FHHM) divided by the signal-to-noise ratio in the unfiltered data (blue trace of Fig. 6), we estimate that the beat note near mm-1 has a FWHM of 0.5 mm-1 with a signal to noise better than 80. This estimate gives an uncertainty in the resonance center less than mm-1, and an uncertainty in of nm. The origin of the noise in Figs. 6-8 is largely from stick-slip between the probe fiber and ONF, which causes phase discontinuities, and electronic noise. Optical noise from bulk Rayleigh scattering inside the ONF has negligible coupling into the single mode of the probe fiber.
Having determined an estimate for the resolution of the method, we now proceed in a more quantitative way: The centers of transform-limited features in discrete FFTs can be accurately found by applying a mild Gaussian windowing function to the data (=400m) prior to calculating the FFT Gasior and Gonzalez (2004) (red trace in Fig. 6). This broadens the spectral features to a known Gaussian form that can easily be fitted. Applying this approach to the curve, we find that the beat frequencies on the waist of the ONF vary from 271.13 0.03 mm-1 to 265.56 0.03 mm-1, corresponding to radii nm to nm over the 10 mm waist, where the uncertainty reflects 95% confidence windows on the Gaussian fitting function using a 600-m-long FFT window.
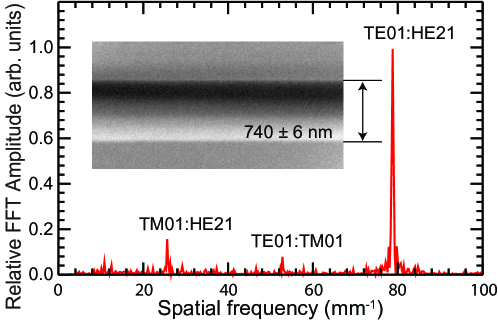
We verified the accuracy of the method using scanning electron microscopy (SEM). Fig. 7 shows the lower part of the spectrum of spatial frequencies for another ONF that could then be destroyed in the SEM. Note that only two of the three marked beat frequencies are independent, with . The beat frequency, with signal-to-noise ratio close to 10, gives an estimate of the fiber radius of 742 0.3 nm. This value is within the bounds measured by the SEM of 740 6 nm. This fiber probe measurement is at least an order of magnitude more precise than SEM and is also nondestructive.
IV.4 Mode Control
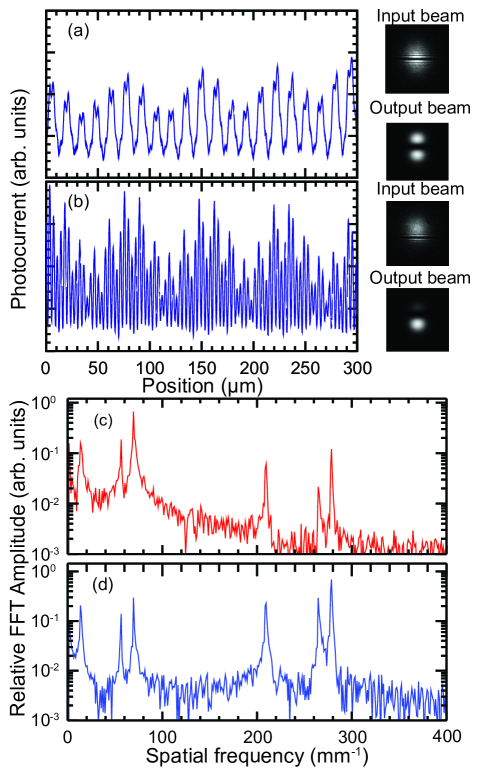
This evanescent probe technique can spatially resolve high frequency interfamily mode beating. The amplitude of the beating is proportional to the product of two mode amplitudes. We can control the relative strengths of any pair of desired modes on the waist by looking at the magnitude of their beat note in the Fourier transform. We demonstrate one use of the technique by suppressing the fundamental mode family propagating on the ONF waist in Fig. 8. Relative weights of the and families are controlled by inserting a -phase-plate into the input Gaussian beam Ravets et al. (2013b). Without a phase plate, well-aligned fiber coupling of the input Gaussian beam has maximum overlap with the mode, whereas a centered plate ideally has only contribution. Mixtures of these families are produced by decentering the plate [intensity distributions at the fiber input and output are next to Fig. 8(a) and Fig. 8(b)]. Figures 8(a) and Fig. 8(b) show two traces over the same section of the ONF, with their respective FFTs on the bottom [Fig. 8(c) and Fig. 8(d)], when a phase plate is used to control the relative amount of and modal content within the ONF. Fig. 8(a) is the raw oscilloscope data when the fundamental mode is suppressed by centering a pi-phase-plate in the input beam. The peaks above 200 mm-1, due to the beating, are smaller than than the intramodal beating. When the phase plate is shifted down [input picture next to Fig. 8(b)], so that the beam has a mixture of fundamental and higher modes, all 6 peaks in the FFT are strong. The highest beat frequencies at almost 300 mm-1 correspond to beating with the fundamental mode, producing oscillations with m, close to the theoretical limit of 2 for silica ONFs, something impossible to resolve with Rayleigh scattering Hoffman et al. (2015).
V Discussion and Conclusions
As increases, numerous inter- and intrafamily spatial frequency can be observed and identified using this near field scanning approach with sub-micron beat-length resolution. This resolution is high enough to measure the minimum possible m for this work with = 1.4534 and our propagating = 795 nm. The main limitation of the method comes from the requirement of an allowed higher-order mode family to provide measurable beat frequencies. Single-mode operation occurs when (V-number = 2.405), making measurements of nm impractical because of the short optical wavelengths required.
Good agreement with all beat frequency curves can only be satisfied for the correct value of . We used the experimentally-obtained frequencies for one of the beat frequencies to extract based on that curve. We then used these radii to calculate the 5 other curves. An incorrect value of results in poor agreement; one cannot compensate for an incorrect value of by adjusting . For a fixed value of and a set of beat frequencies with uncertainties, as in Fig. 6, of 0.03 mm-1, the data are consistent only as long as the index agrees to within 2 x 10⁻⁴ Malitson (1965). The dispersion curve of fused silica is typically quoted to an accuracy 1 x 10⁻⁵. This self-consistency check strongly suppresses any systematic effects in the procedures to either extract the radius or study the propagation of the higher order modes in the ONF.
The technique presented here has a high signal to noise ratio, which allows high spatial resolution. It does this with immunity to scattered light and ONF mechanical stress and vibrations. The mode-dependent coupling from the ONF to the probe fiber conditions the amplitudes of the beat resonances, but does not change the frequency of the beating. The amplitudes then give only qualitative information about the coupling. The average radius with its sub-nanometer resolution comes from the beating frequency, and shows robustness and repeatability while the scanning in situ is fast. The analysis of the transmission properties for higher order modes and their cutoffs give unique protection against systematic errors. The excellent spatial resolution in the radius determination can aid in evaluating the uniformity of the pulled fiber (e.g. the noticeable variation in in the test fiber of Fig. 3, and can be used to optimize ONF production.
Acknowledgements
We thank Je-Hyung Kim for his help with the SEM imaging.
Funding Information
Army Research Office (ARO) (Atomtronics MURI (528418)); Defense Advanced Research Projects Agency (DARPA) (HR0011411122); National Science Foundation (NSF) (PHY-1430094); Office of Naval Research (ONR).
References
- Tong et al. (2003) L. Tong, R. R. Gattass, J. B. Ashcom, S. He, J. Lou, M. Shen, I. Maxwell, and E. Mazur, Nature 426, 816 (2003).
- Kien et al. (2005) F. L. Kien, S. D. Gupta, V. I. Balykin, and K. Hakuta, Phys. Rev. A 72, 032509 (2005).
- Morrissey et al. (2013) M. J. Morrissey, K. Deasy, M. Frawley, R. Kumar, E. Prel, L. Russell, V. G. Truong, and S. Nic Chormaic, Sensors 13, 10449 (2013).
- Yalla et al. (2012) R. Yalla, F. L. Kien, M. Morinaga, and K. Hakuta, Phys. Rev. Lett. 109, 063602 (2012).
- Fujiwara et al. (2011) M. Fujiwara, K. Toubaru, T. Noda, H.-Q. Zhao, and S. Takeuchi, Nano Lett. 11, 4362 (2011).
- Dawkins et al. (2011) S. T. Dawkins, R. Mitsch, D. Reitz, E. Vetsch, and A. Rauschenbeutel, Phys. Rev. Lett. 107, 243601 (2011).
- Vetsch et al. (2010) E. Vetsch, D. Reitz, G. Sagué, R. Schmidt, S. T. Dawkins, and A. Rauschenbeutel, Phys. Rev. Lett. 104, 203603 (2010).
- O’Shea et al. (2013) D. O’Shea, C. Junge, J. Volz, and A. Rauschenbeutel, Phys. Rev. Lett. 111, 193601 (2013).
- Mitsch et al. (2014) R. Mitsch, C. Sayrin, B. Albrecht, P. Schneeweiss, and A. Rauschenbeutel, Nat. Commun. 5, 5713 (2014).
- Petersen et al. (2014) J. Petersen, J. Volz, and A. Rauschenbeutel, Science 346, 67 (2014).
- Spillane et al. (2008) S. M. Spillane, G. S. Pati, K. Salit, M. Hall, P. Kumar, R. G. Beausoleil, and M. S. Shahriar, Phys. Rev. Lett. 100, 233602 (2008).
- Béguin et al. (2014) J.-B. Béguin, E. M. Bookjans, S. L. Christensen, H. L. Sørensen, J. H. Müller, E. S. Polzik, and J. Appel, Phys. Rev. Lett. 113, 263603 (2014).
- Sayrin et al. (2015) C. Sayrin, C. Clausen, B. Albrecht, P. Schneeweiss, and A. Rauschenbeutel, Optica 2, 353 (2015).
- Gouraud et al. (2015) B. Gouraud, D. Maxein, A. Nicolas, O. Morin, and J. Laurat, Phys. Rev. Lett. 114, 180503 (2015).
- Jones et al. (2015) D. E. Jones, J. D. Franson, and T. B. Pittman, Phys. Rev. A 92, 043806 (2015).
- Kumar et al. (2015) R. Kumar, V. Gokhroo, and S. N. Chormaic, New Journal of Physics 17, 123012 (2015).
- (17) H. L. Sørensen, J.-B. Béguin, K. W. Kluge, I. Iakoupov, A. S. Sørensen, J. H. Müller, E. S. Polzik, and J. Appel, arXiv: , 1601.04869 ().
- (18) N. V. Corzo, B. Gouraud, A. Chandra, A. Goban, A. S. Sheremet, D. Kupriyanov, and J. Laurat, arXiv: , 1604.03129 ().
- Hoffman et al. (2014) J. E. Hoffman, S. Ravets, J. Grover, P. Solano, P. R. Kordell, J. D. Wong-Campos, S. L. Rolston, and L. A. Orozco, AIP Advances 4, 067124 (2014).
- Ravets et al. (2013a) S. Ravets, J. E. Hoffman, L. A. Orozco, S. L. Rolston, G. Beadie, and F. K. Fatemi, Opt. Express 21, 18325 (2013a).
- Hoffman et al. (2015) J. E. Hoffman, F. K. Fatemi, G. Beadie, S. L. Rolston, and L. A. Orozco, Optica 2, 416 (2015).
- Szczurowski et al. (2011) M. Szczurowski, W. Urbanczyk, M. Napiorkowski, P. Hlubina, U. Hollenbach, H. Sieber, and J. Mohr, Appl. Opt. 50, 2594 (2011).
- Birks et al. (2000) T. A. Birks, J. C. Knight, and T. E. Dimmick, IEEE Photon. Tech. Lett. 12, 182 (2000).
- Sumetsky and Dulashko (2010) M. Sumetsky and Y. Dulashko, Opt. Lett. 35, 4006 (2010).
- Semenova et al. (2015) Y. Semenova, V. Kavungal, Q. Wu, and G. Farrell, Proc. SPIE 9634, 96343F (2015).
- Keloth et al. (2015) J. Keloth, M. Sadgrove, R. Yalla, and K. Hakuta, Opt. Lett. 40, 4122 (2015).
- (27) L. S. Madsen, C. Baker, H. Rubinsztein-Dunlop, and W. P. Bowen, arXiv:1606.04064 .
- Ravets et al. (2013b) S. Ravets, J. E. Hoffman, P. R. Kordell, J. D. Wong-Campos, S. L. Rolston, and L. A. Orozco, J. Opt. Soc. Am. A 30, 2361 (2013b).
- Gasior and Gonzalez (2004) M. Gasior and J. L. Gonzalez, AIP Proc. Conf. 732, 276 (2004).
- Malitson (1965) I. H. Malitson, J. Opt. Soc. Am. 55, 1205 (1965).