Validation of Twitter opinion trends with national polling aggregates: Hillary Clinton vs Donald Trump
Alexandre Bovet, Flaviano Morone, Hernán A. Makse
Levich Institute and Physics Department, City College of New York, New York, New York 10031, USA
Abstract
Measuring and forecasting opinion trends from real-time social media is a long-standing goal of big-data analytics. Despite its importance, there has been no conclusive scientific evidence so far that social media activity can capture the opinion of the general population. Here we develop a method to infer the opinion of Twitter users regarding the candidates of the 2016 US Presidential Election by using a combination of statistical physics of complex networks and machine learning based on hashtags co-occurrence to develop an in-domain training set approaching 1 million tweets. We investigate the social networks formed by the interactions among millions of Twitter users and infer the support of each user to the presidential candidates. The resulting Twitter trends follow the New York Times National Polling Average, which represents an aggregate of hundreds of independent traditional polls, with remarkable accuracy. Moreover, the Twitter opinion trend precedes the aggregated NYT polls by 10 days, showing that Twitter can be an early signal of global opinion trends. Our analytics unleash the power of Twitter to uncover social trends from elections, brands to political movements, and at a fraction of the cost of national polls.
Several works have showed the potential of online social media, in particular of the microblogging platform Twitter, for analyzing the public sentiment in general [1, 2, 3, 4] or to predict stock markets movements or sales performance [5, 6, 7, 8, 9]. With the increasing importance of Twitter in political discussions, a considerable number of studies [10, 11, 12, 13, 14, 15, 16, 17, 18, 19, 20, 21, 22, 23, 24, 25, 26, 27] also investigated the possibility to analyze political processes and predict political elections from data collected on Twitter. However, these initial investigations achieved only mixed results and engendered a number of critical studies [28, 20, 29] questioning their methods and findings. One of the main criticisms is that instead of measuring the political support for a candidate or a party, they measure the political attention toward it, those two concepts being not necessarily correlated. Indeed, most work compare the volume of tweets, or mentions, related to the different candidates with traditional polls or election results. Lexicon-based sentiment analysis[30, 31, 32] has also been used to improve this approach by attributing a positive or negative sentiment to the tweets containing mentions of the candidates or parties. However, not only does lexicon-based approach perform poorly on the informal, unstructured, sometimes ironic, language of Twitter[33], but sentiment analysis does not allow one to differentiate attention from political support, especially during political scandals[29]. In this case, correctly capturing the context of the events is crucial to measure supports.
Recent works[34, 35] have shown that by going beyond sentiment analysis, and by considering all the terms used in tweets, even the terms usually considered neutral, a more accurate measurement of the Twitter opinion during the 2012 US election was possible. Moreover, evidences suggest that it is possible to differentiate Republican and Democrat Twitter users based only on their usage of words[36]. Ceron et al.[34, 37, 38] used a supervised machine learning approach based on a hand labeled training set to estimate the proportion of tweets in favor of each candidate in the 2012 US election and the 2012 Italian center-left primaries. Beauchamp[35] extracted significant textual features from Twitter by fitting a model to existing polls and showed that these features improved state level polls prediction. Despite all these improvements, opinion time series derived from Twitter have not been validated so far with any traditional polling performed at the large scale.
Here, we focus on the 2016 US Presidential Election by collecting Twitter data regarding the two top candidates to the presidency: Hillary Clinton (Democratic Party) and Donald J. Trump (Republican Party). We develop a supervised learning approach to measure the opinion of Twitter users where we do not try to classify tweets as expressing positive or negative sentiment, but as supporting or opposing one of the candidates. Our approach innovates by using the network of hashtag co-occurrence to discover all the hashtags relevant to the elections and to assess the consistency of our hashtag classification. This allows us to automatically build a training set approaching one million documents, which is two order of magnitude larger than what hand labeling typically allows. Moreover, using an in-domain training set not only helps us to capture the informalities of Twitter language, but also permits us to capture the rich context of the 2016 US election. We do not attempt to predict the outcome of the elections from Twitter, but we show that we can precisely measure the supports of each candidate in Twitter, and that while our approach is independent of traditional polls, the opinion trend we measure in Twitter closely matches the New York Times (NYT) National Polling Average[39] and anticipates it by several days. The agreement we find significantly exceeds results of previous attempts comparing Twitter-based metric time series with traditional polls [10, 13, 17, 34, 29], as we perform a systematic benchmark against all previous methods and show that our method outperform all of them. By training our model only on the first part of our dataset, we can still predict the results of the NYT polls up to 10 days in advance during the rest of the election period. We thus validate the use of Twitter activity to capture trends existing in the society at the national level. We also show that, contrary to the measure of the supports of each candidate, the attention toward the candidates, measured by previous studies[10, 13, 17, 29], does not agree with the NYT national polls.
Finally, by classifying individual users instead of tweets, we correctly take into account the difference in activity of each users and we gain unique insight on the dynamics and structure of the social network of Twitter users in relation to their political opinion. We show that the difference in behavior and activity between the supporters of the two candidates results in the fact that Twitter’s opinion mainly measures the engagement of Clinton supporters. This explains the discrepancy between Twitter opinion and the outcome of the election. Detecting such a dichotomy before the election is an important warning signal indicating that the opinion trend from the polls may not be representative of the electorate.
1 Results
1.1 Social network of Twitter users
We collect tweets mentioning the two top candidates in the 2016 US presidential election from June 1st until election day on November 8th, 2016 by using Twitter Search API to retrieve the following queries: trump OR realdonaldtrump OR donaldtrump and hillary OR clinton OR hillaryclinton. The resulting dataset consists of 98 million tweets with the keywords about Donald Trump sent by 6.7 million users and 78 million tweets with the keywords about Hillary Clinton sent by 8.8 million users. The combination of the two datasets results in a total of 171 million unique tweets. The total number of users is 11 million with an average of 1.1 million tweets per day (standard deviation of 0.6 million) sent by an average of about 375,000 distinct users (standard deviation of 190,000) per day.
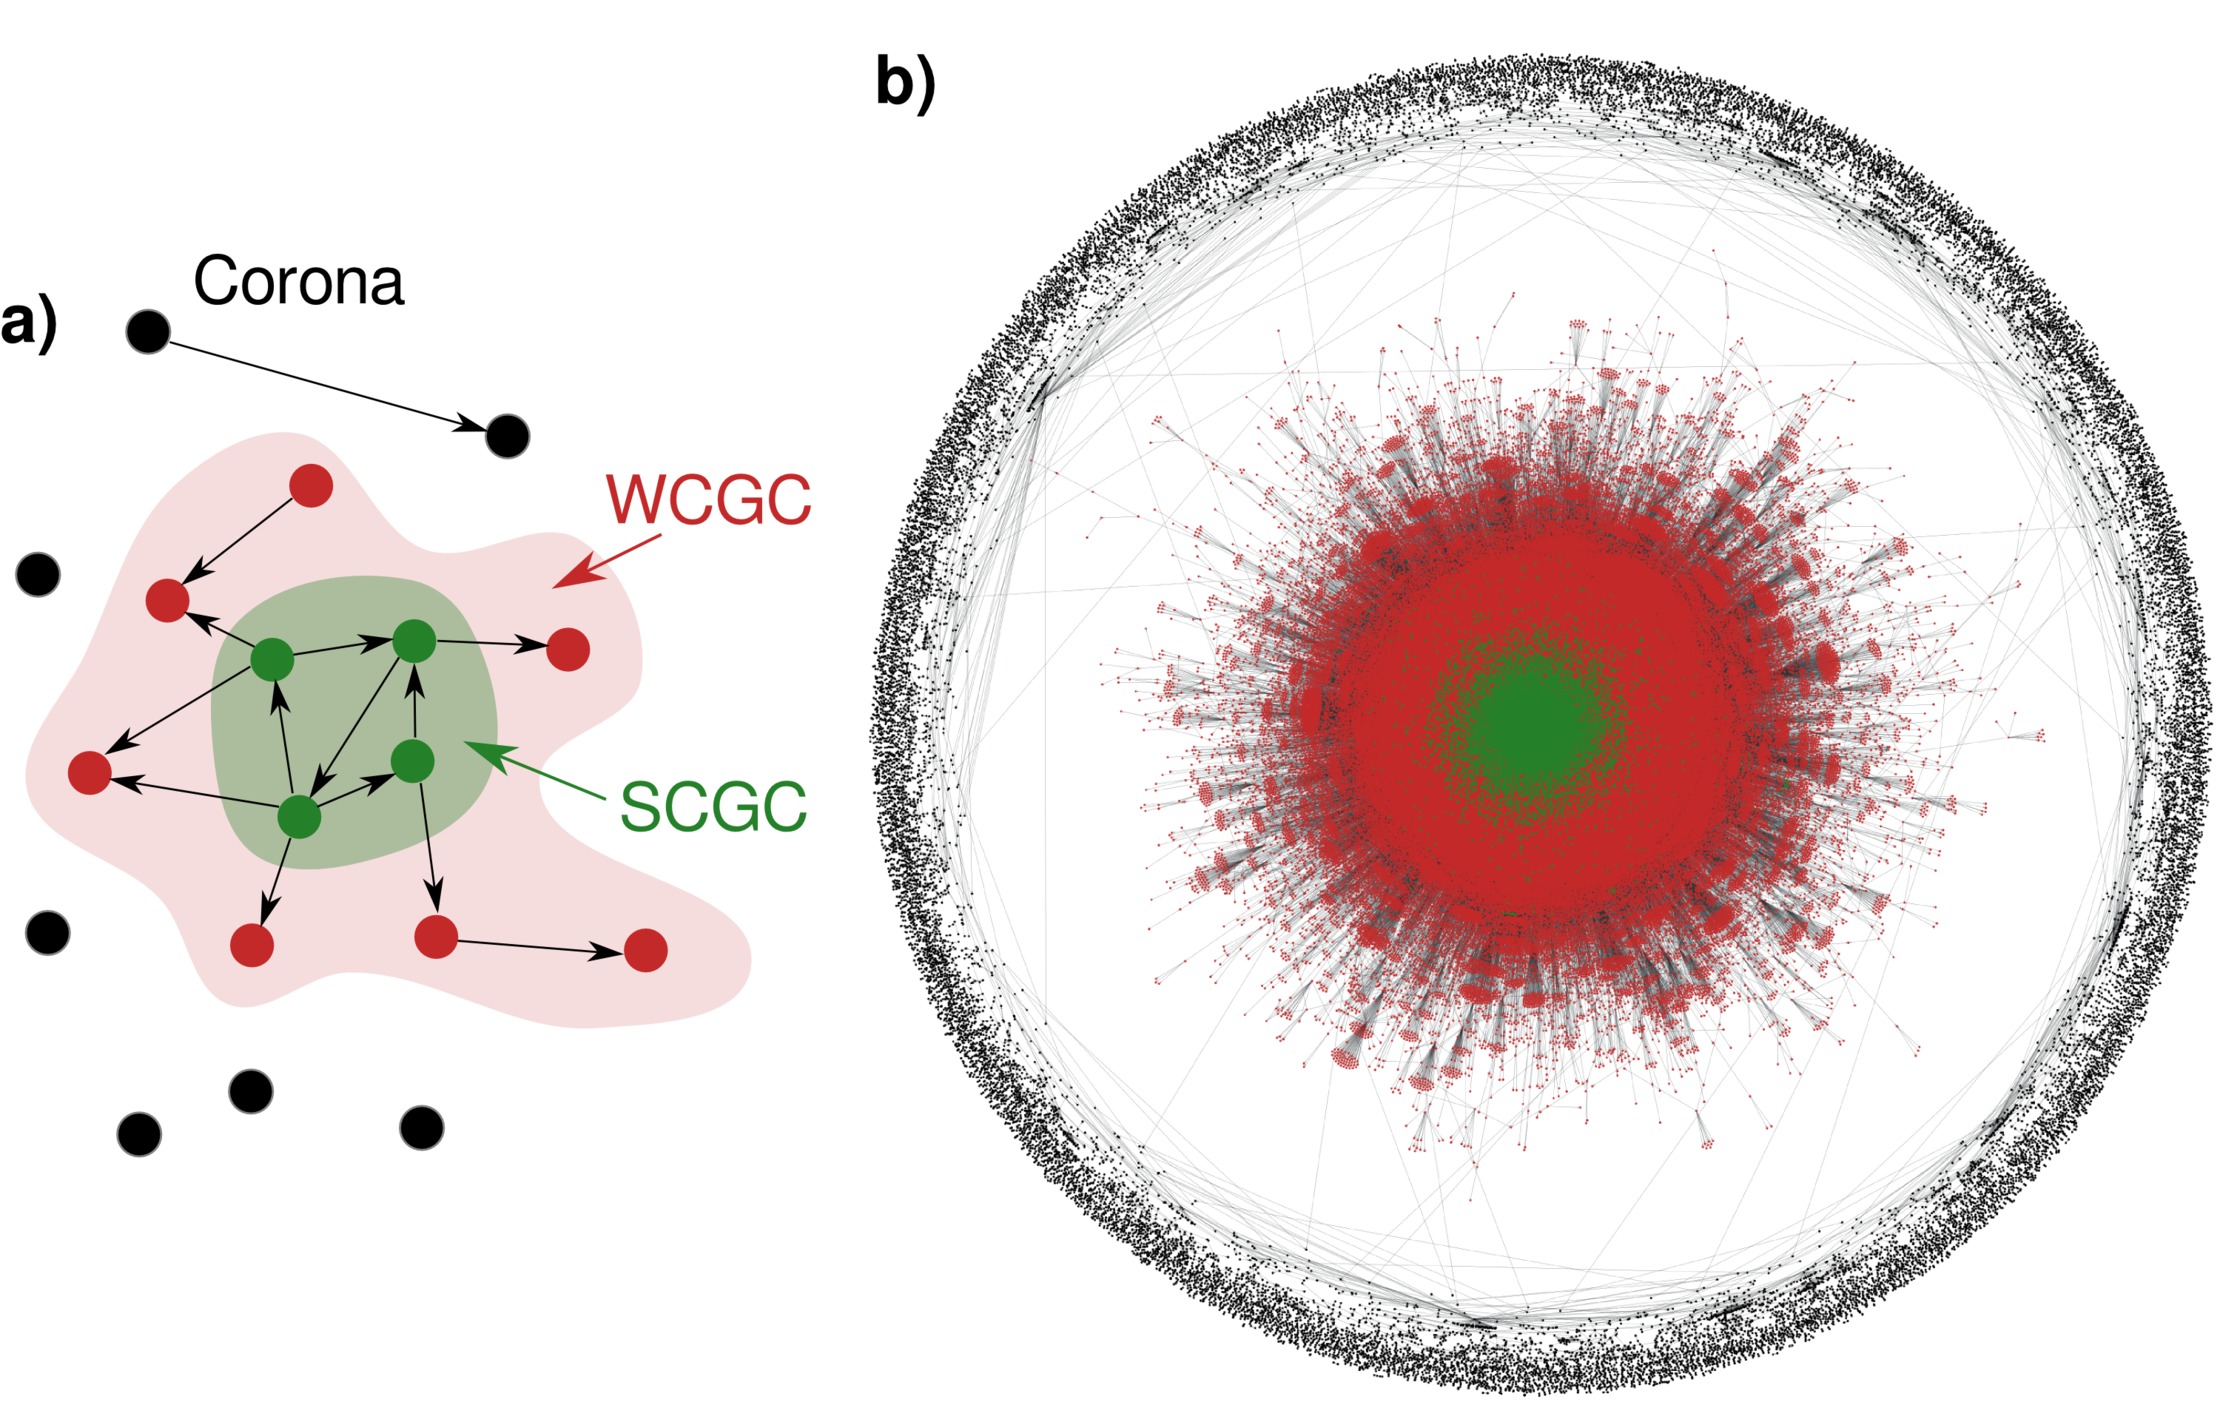
We then build the daily social networks from user interactions following the methods developed in Ref. [40] (see Methods 3.1). A directed link between two users is defined whenever one user retweets, replies to, mentions or quotes another user. Using concepts borrowed from percolation theory[41, 42] we define different connected components to characterize the connectivity properties of the network of Twitter users: the strongly connected giant component (SCGC), weakly connected giant component (WCGC) and the corona (the rest of the network – composed of smaller subgraphs not connected to the giant components SCGC and WCGC).
The SCGC is formed by the users that are part of interaction loops and are the most involved in discussions while WCGC is formed by users that do not necessarily have reciprocal interactions with other users (see Fig. 1a). A typical daily network is shown in Fig. 1b.
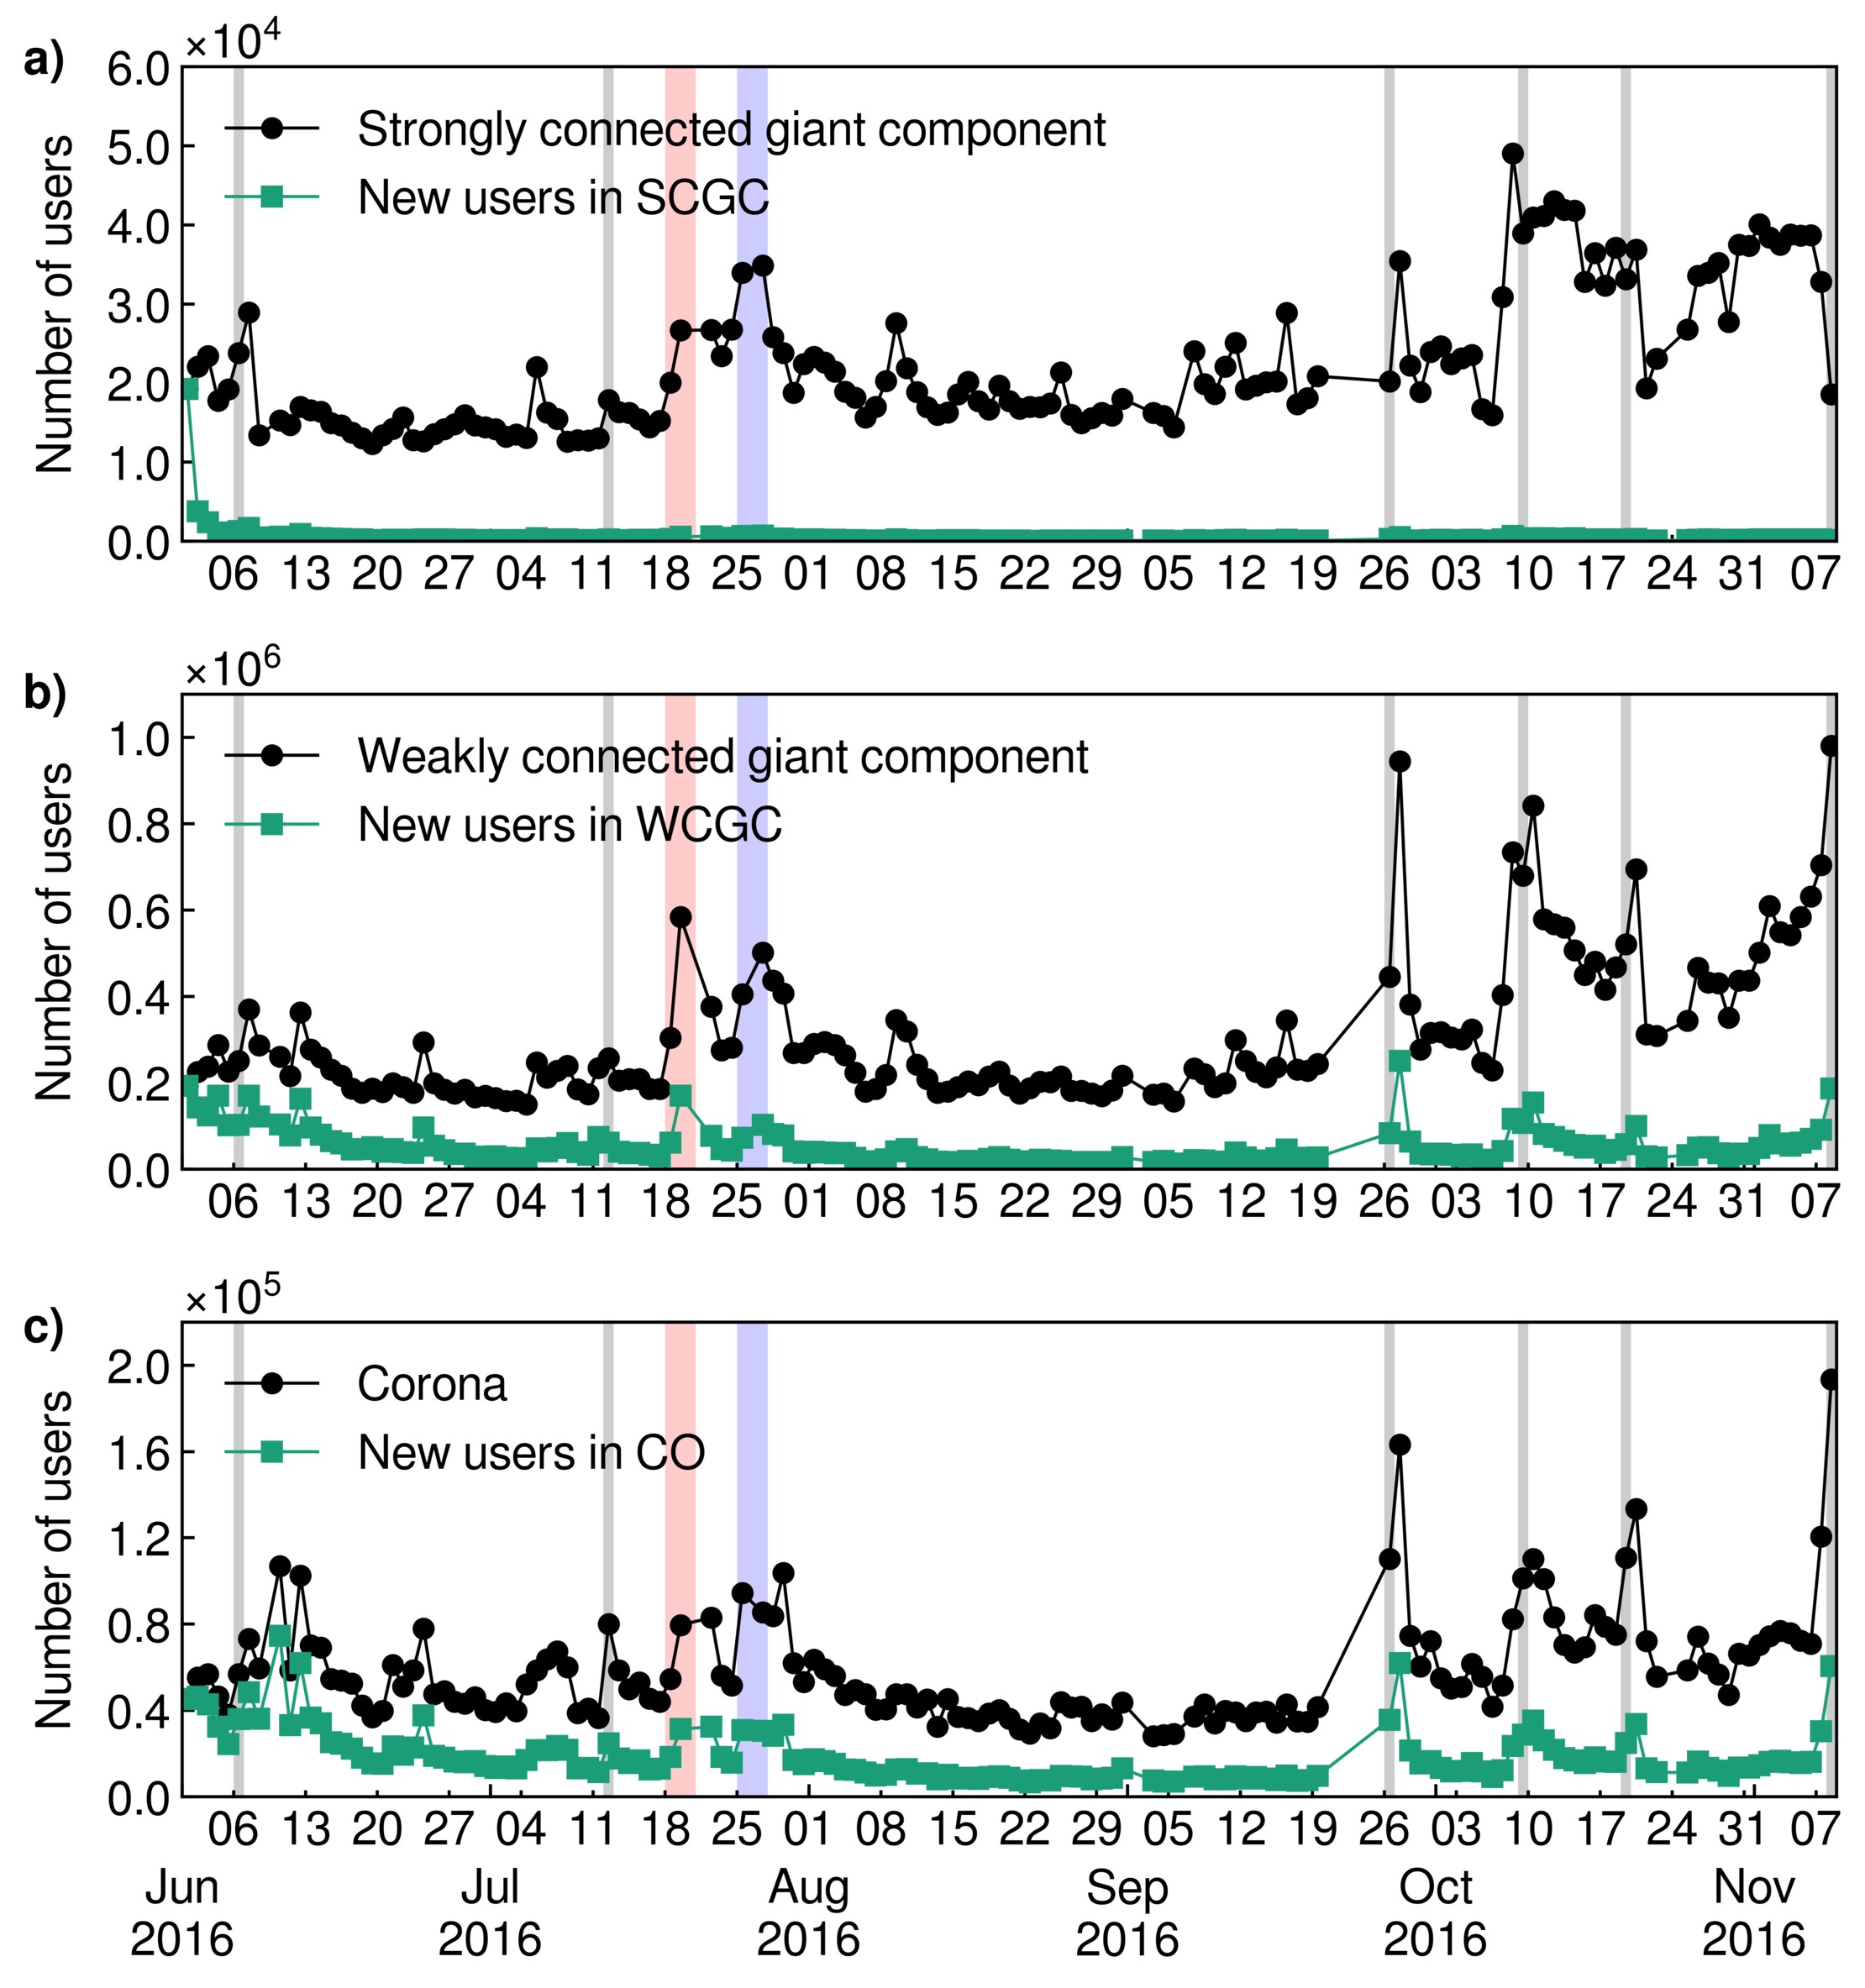
We monitor the evolution of the size of the SCGC, WCGC and the corona
as shown in Fig. 2.
The WCGC has an average daily size 310,000 (standard
deviation of 160,000 users) is approximately 14 times larger than the
SCGC with 22,000 (standard deviation of 8,600) daily users
(see Figs. 2a and 2b).
The average daily number of users in the
corona is approximately 58,000 with a standard deviation of 25,000
users Fig. 2c.
Fluctuations in the size of the three compartments
are visible in the large spikes in activity occurring during important
events that happened during the period of observation.
For instance,
on June 6, when Hillary Clinton secured enough delegates to be the
nominee of the Democratic Party.
Bernie Sanders (who was the second contender for the Democratic
Nomination) officially terminated his campaign and endorsed Hillary
Clinton on July 12.
The Republican and Democratic Conventions were
held between June 18-21 and June 25-28, respectively
and the three presidential debates were held on
September 26, October 9 and October 19.
The fluctuations related to these events are more important in the WCGC and
corona than in the SCGC.
The number of new users – those appearing in our
dataset for the first time – in each compartment is displayed in green
in Fig. 2. Most new users arrive and connect
directly to the WCGC or populate the disconnected corona while
relatively few users join directly the strongly connected
component.
This is expected as the users belonging to SCGC are those who
are supposed to be the influencers in the campaigns,
since for users in the SCGC, the information can arrive
from any other member of the giant component, and, vice-versa, the information can flow from the member
to any other user in the SCGC.
Thus, it may take time for a new arrival to belong to the SCGC.
After the first week of observation, the number of new
users arriving directly to the SCGC per day stays stable below
1,000.
1.2 Opinion of Twitter users
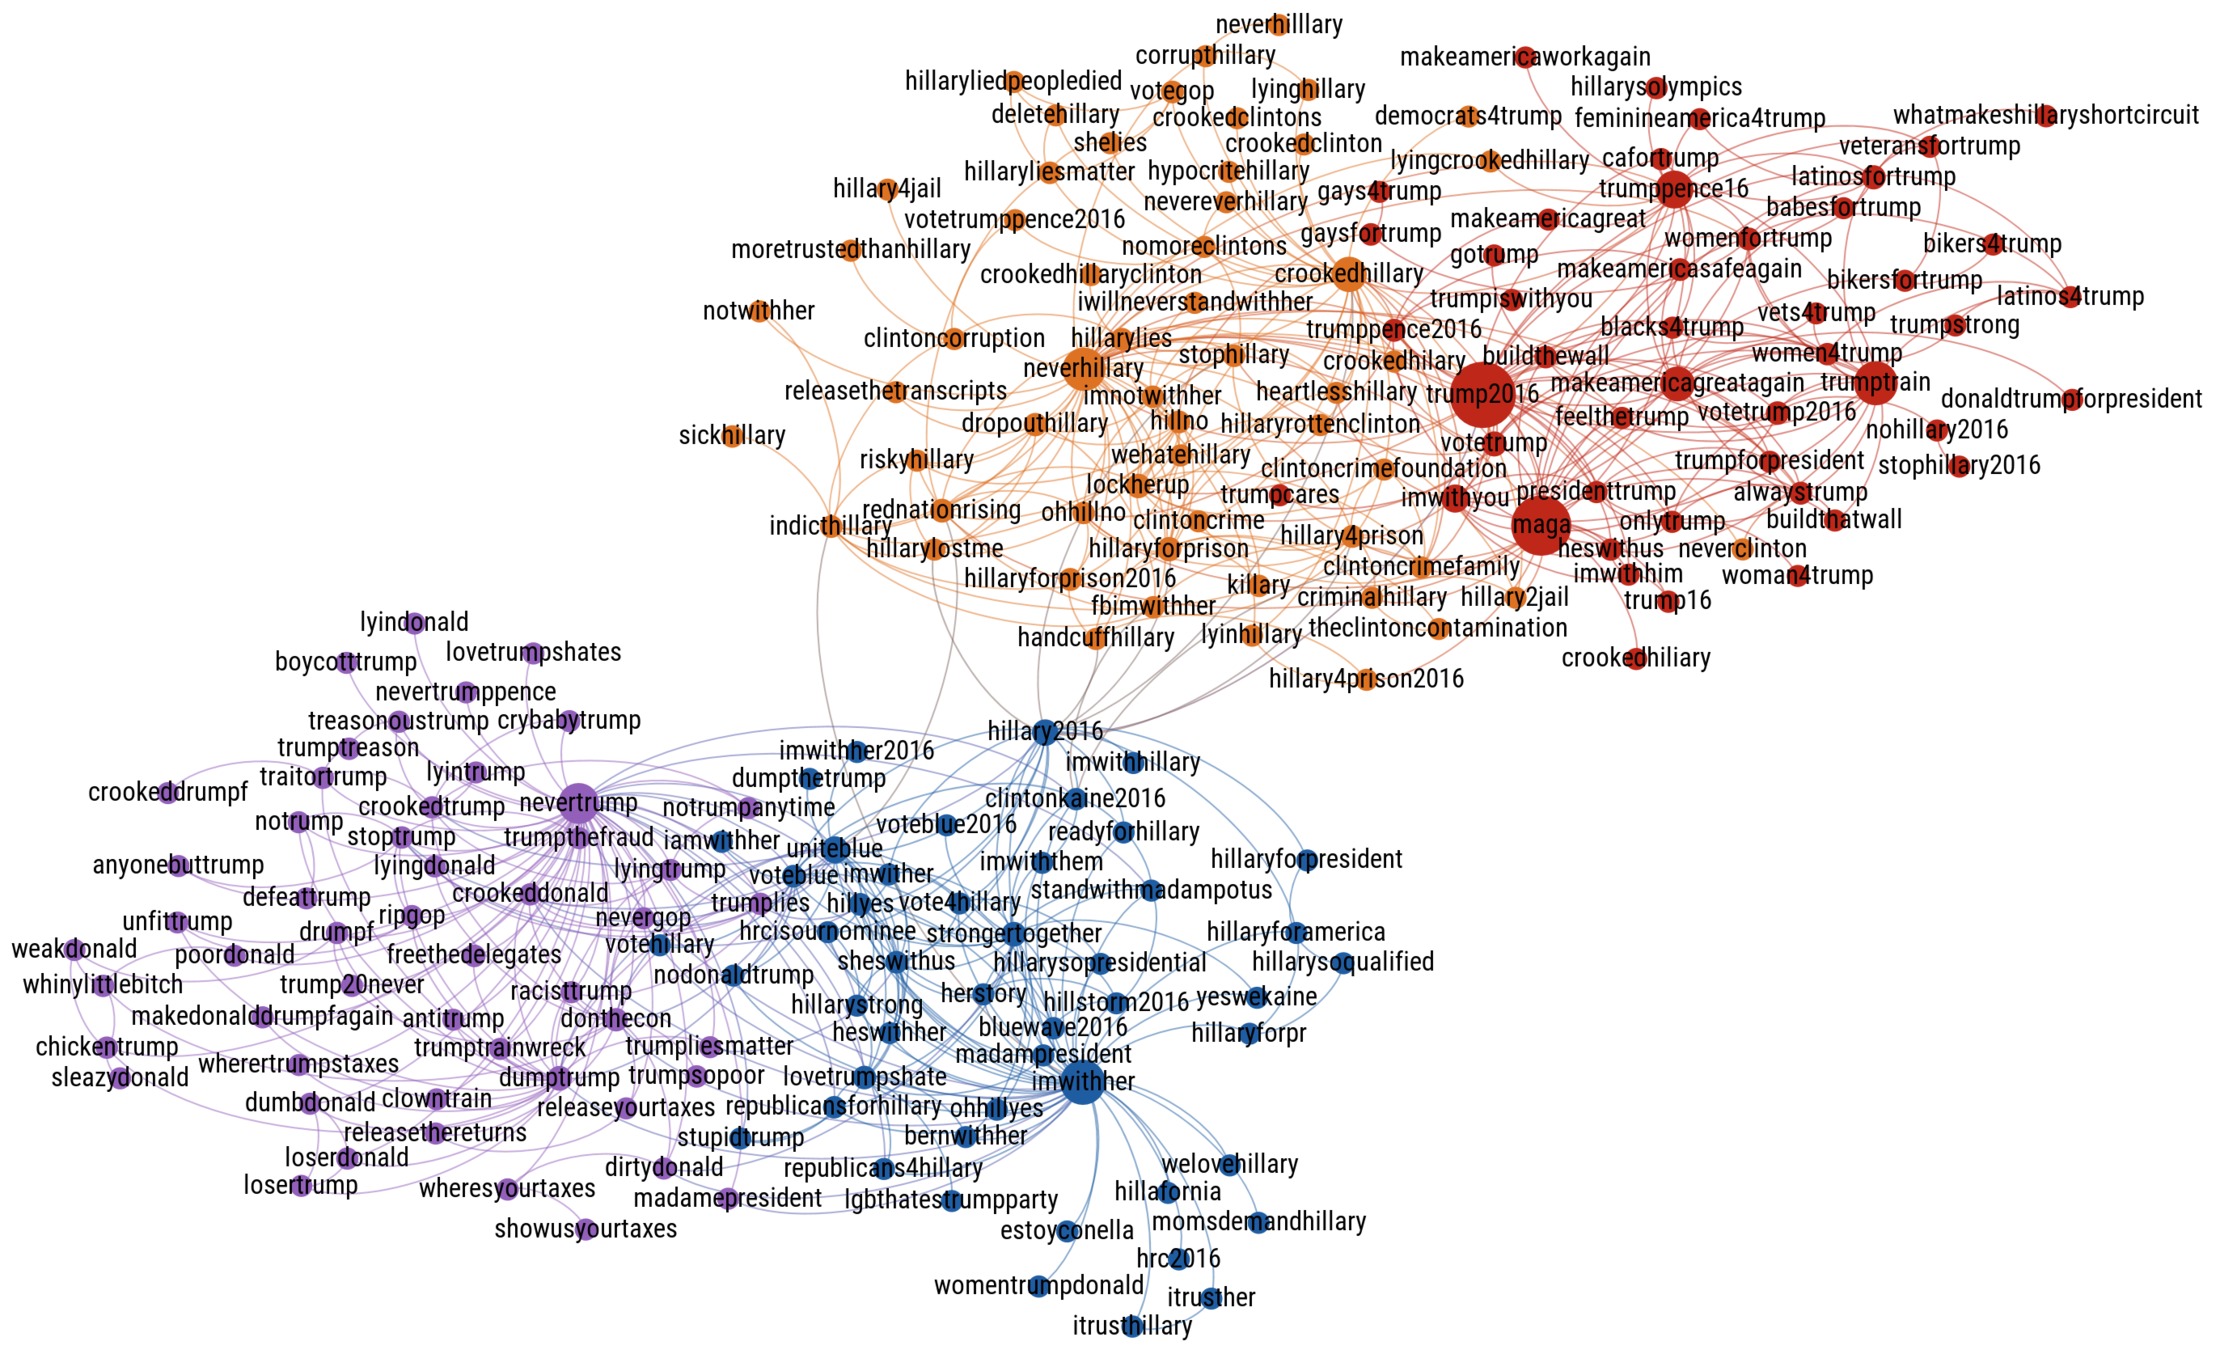
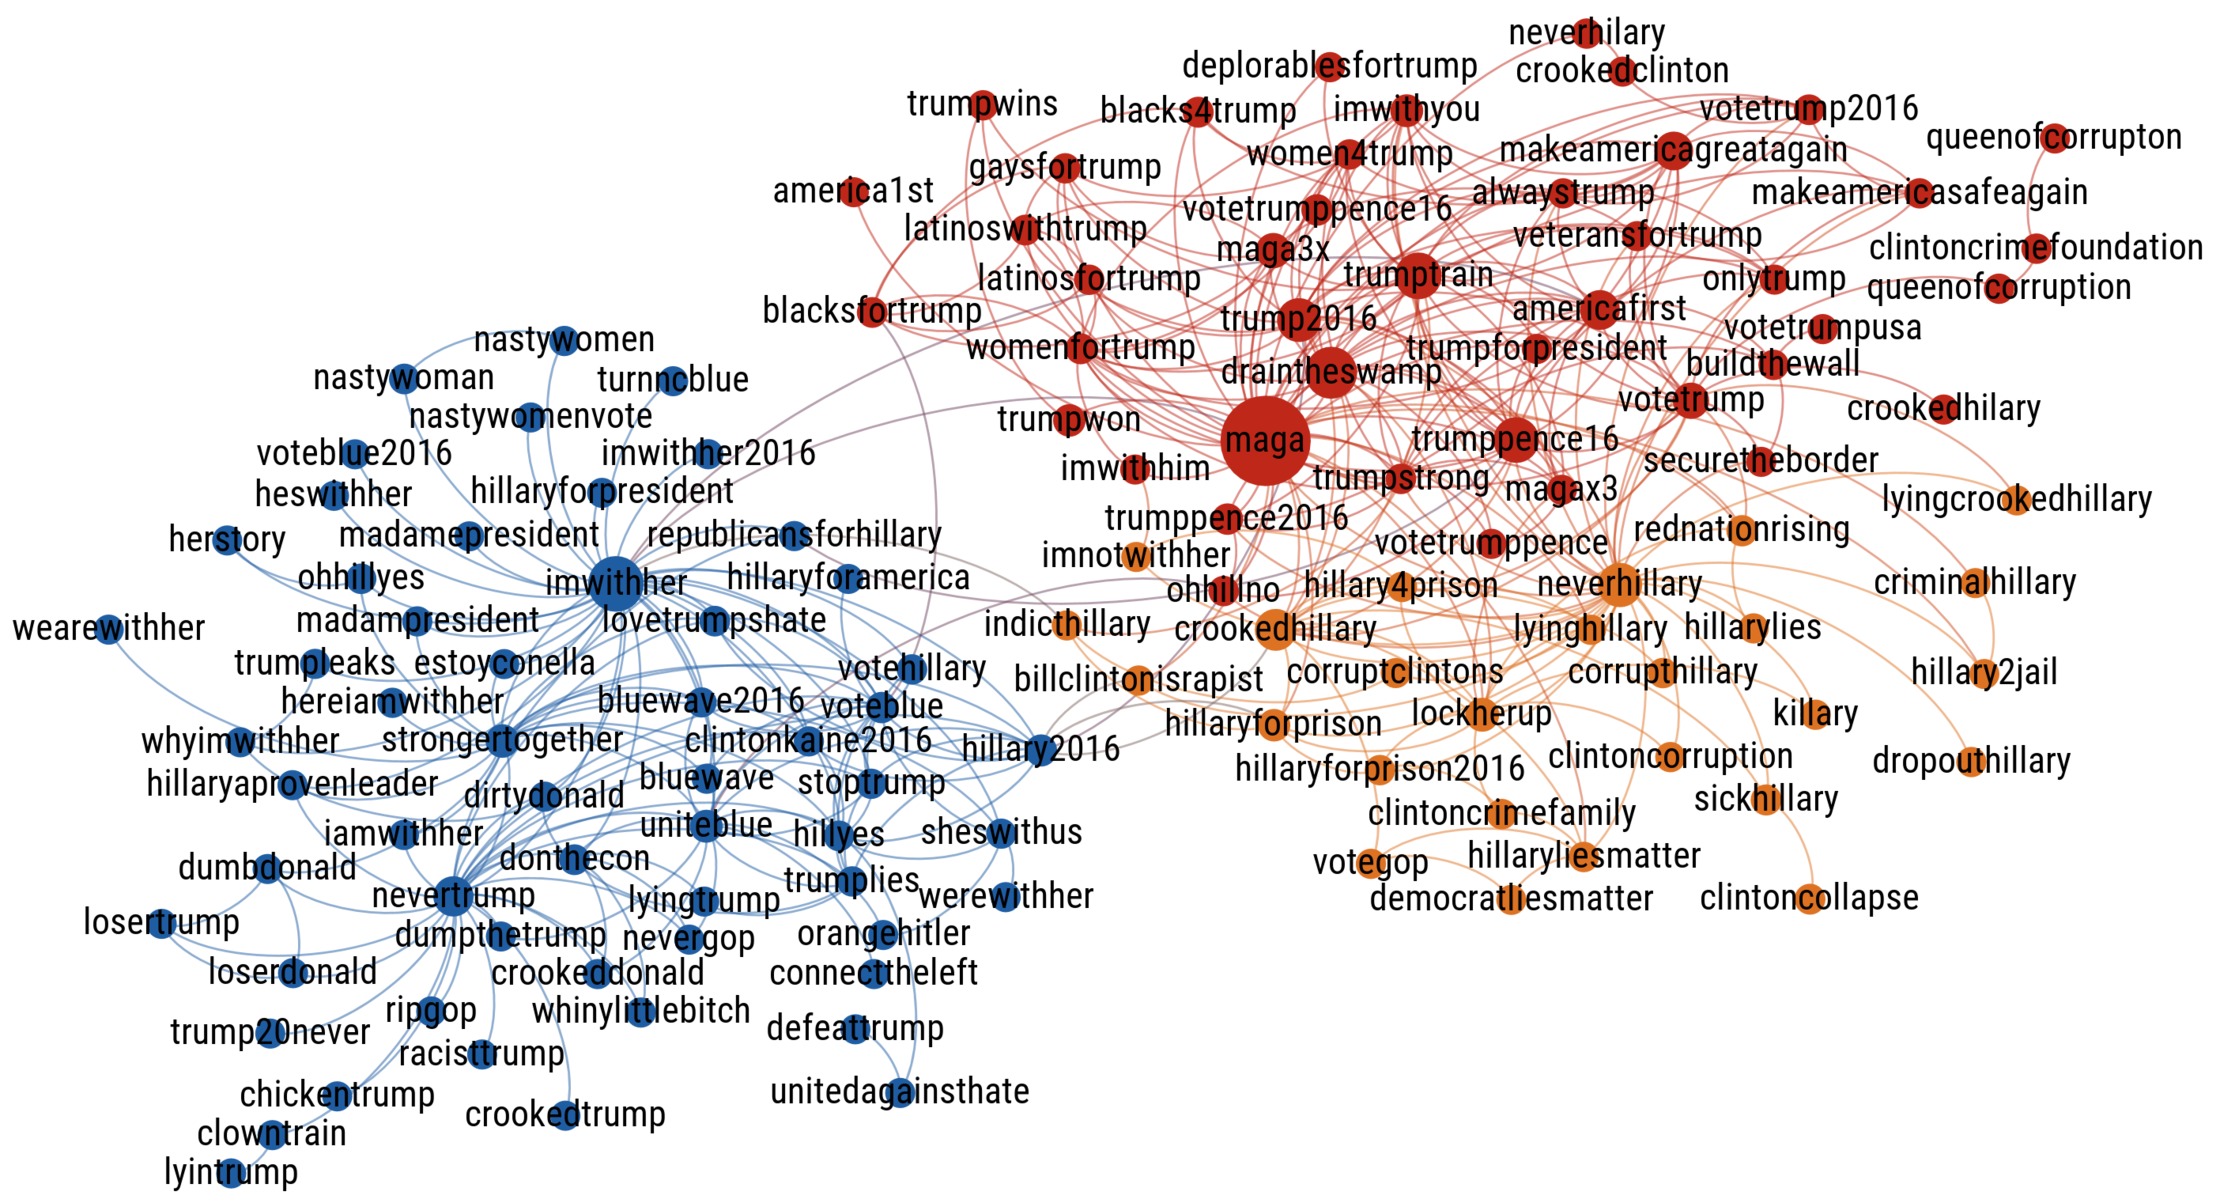
We use a set of hashtags expressing opinion to build a set of labeled tweets, which are used in turn to train a machine learning classifier (see Methods 3.2 and 3.3). Figure 3 displays the network of hashtags co-occurrence discovered with our algorithm from June 1st to September 1st. The network corresponding to the period from September 1st to November 8th displays similar characteristics and is shown in the Supplementary Information. Hashtags are colored according to the four categories, pro-Trump (red), anti-Hillary (orange), pro-Clinton (blue) and anti-Trump (purple). Two main clusters, formed by the pro-Trump and anti-Hillary on the right and pro-Clinton and anti-Trump on the left, are visible, indicating a strong relation between the usage of hashtags in these two pairs of categories.
The existence of these two main clusters reveals the strong polarization of the opinion in our dataset and motivates our decision to reduce our classification of tweets to two categories: pro-Trump or anti-Hillary and pro-Clinton or anti-Trump, in the following designated as Trump supporters and Clinton supporters, respectively. The clear separation of hashtag usage in two main clusters corroborates previous studies showing that, in the case of political issues, Twitter users exchange primarily among individuals with similar ideological preferences as shown in Barbera et al.[45]. This result allows us to use the hashtags from the two clusters to create a labeled training set of tweets that is large enough (1 million tweets) so that the opinion of all the Twitter users (11 million) can be inferred with confidence such that it agrees with the NYT National Polling Average.
In principle, it may not be a given fact that any topic of interest could lead to the same separation in the hashtag network. We could imagine another topic of discussion in Twitter, let’s say, “Samsung Galaxy versus IPhone”, where users express their opinion about the two smartphones. In this case, one would be interested to see whether the co-occurrence hashtag network separates into two distinct clusters as in the case of Clinton/Trump. If this is the case, then it implies that the topic is polarized and our analytics can be applied confidently to obtain the number of users in favor of one smartphone or the other. However, it could be the case, that the hashtags do not separate into two groups. In this case, we would conclude that the topic is not polarized enough and therefore there are not well defined groups. Thus, the separation in the hashtag network is a necessary ingredient that allows to perform the supervised classification.
Note also that, although Hillary Clinton and Donald Trump were officially nominated as presidential candidate of their respective party only during the conventions, they both secured enough pledged delegates to become the nominee before their party’s convention. Donald Trump secured enough delegates on May 26 while Hillary Clinton did it on June 6.
Taking into account the entire observation period,
we identify more hashtags in the
pro-Trump (n=60) than in the pro-Hillary (n=52) categories and
approximately the same number in the anti-Trump (n=62) and
anti-Hillary (n=65) categories. The number of tweets using at least
one of the classified hashtags account for 30% of all the tweets
containing at least one hashtag.
We find more tweets having hashtags exclusively in the Trump supporters category
than exclusively in the Clinton supporters category (9.6 million for Trump versus
3.0 million for Clinton).
These tweets also correspond to more users in the Trump camp than in the Hillary camp
(538,720 for Trump versus 393,829 for Clinton).
Although these figures might suggest a clear advantage for Trump in Twitter,
one need to take into account
the whole population of users in the dataset to correctly estimate the popularity of each
candidate.
This is what we show in section , where the daily opinion of each users is determined
after having classified our entire dataset of tweets.
1.3 Generalization of the method to multi-partite elections and topics beyond elections
A two-classes classification scheme was the best approach in the case of the 2016 US Presidential elections since the elections where dominated by two candidates. However, in the case of multi-partite political systems like some European or Latin American countries, we can implement a multi-class classification scheme. This is done, for example, generalizing the binary classification used with Trump/Clinton to a multi-classification scheme involving three or more Parties.
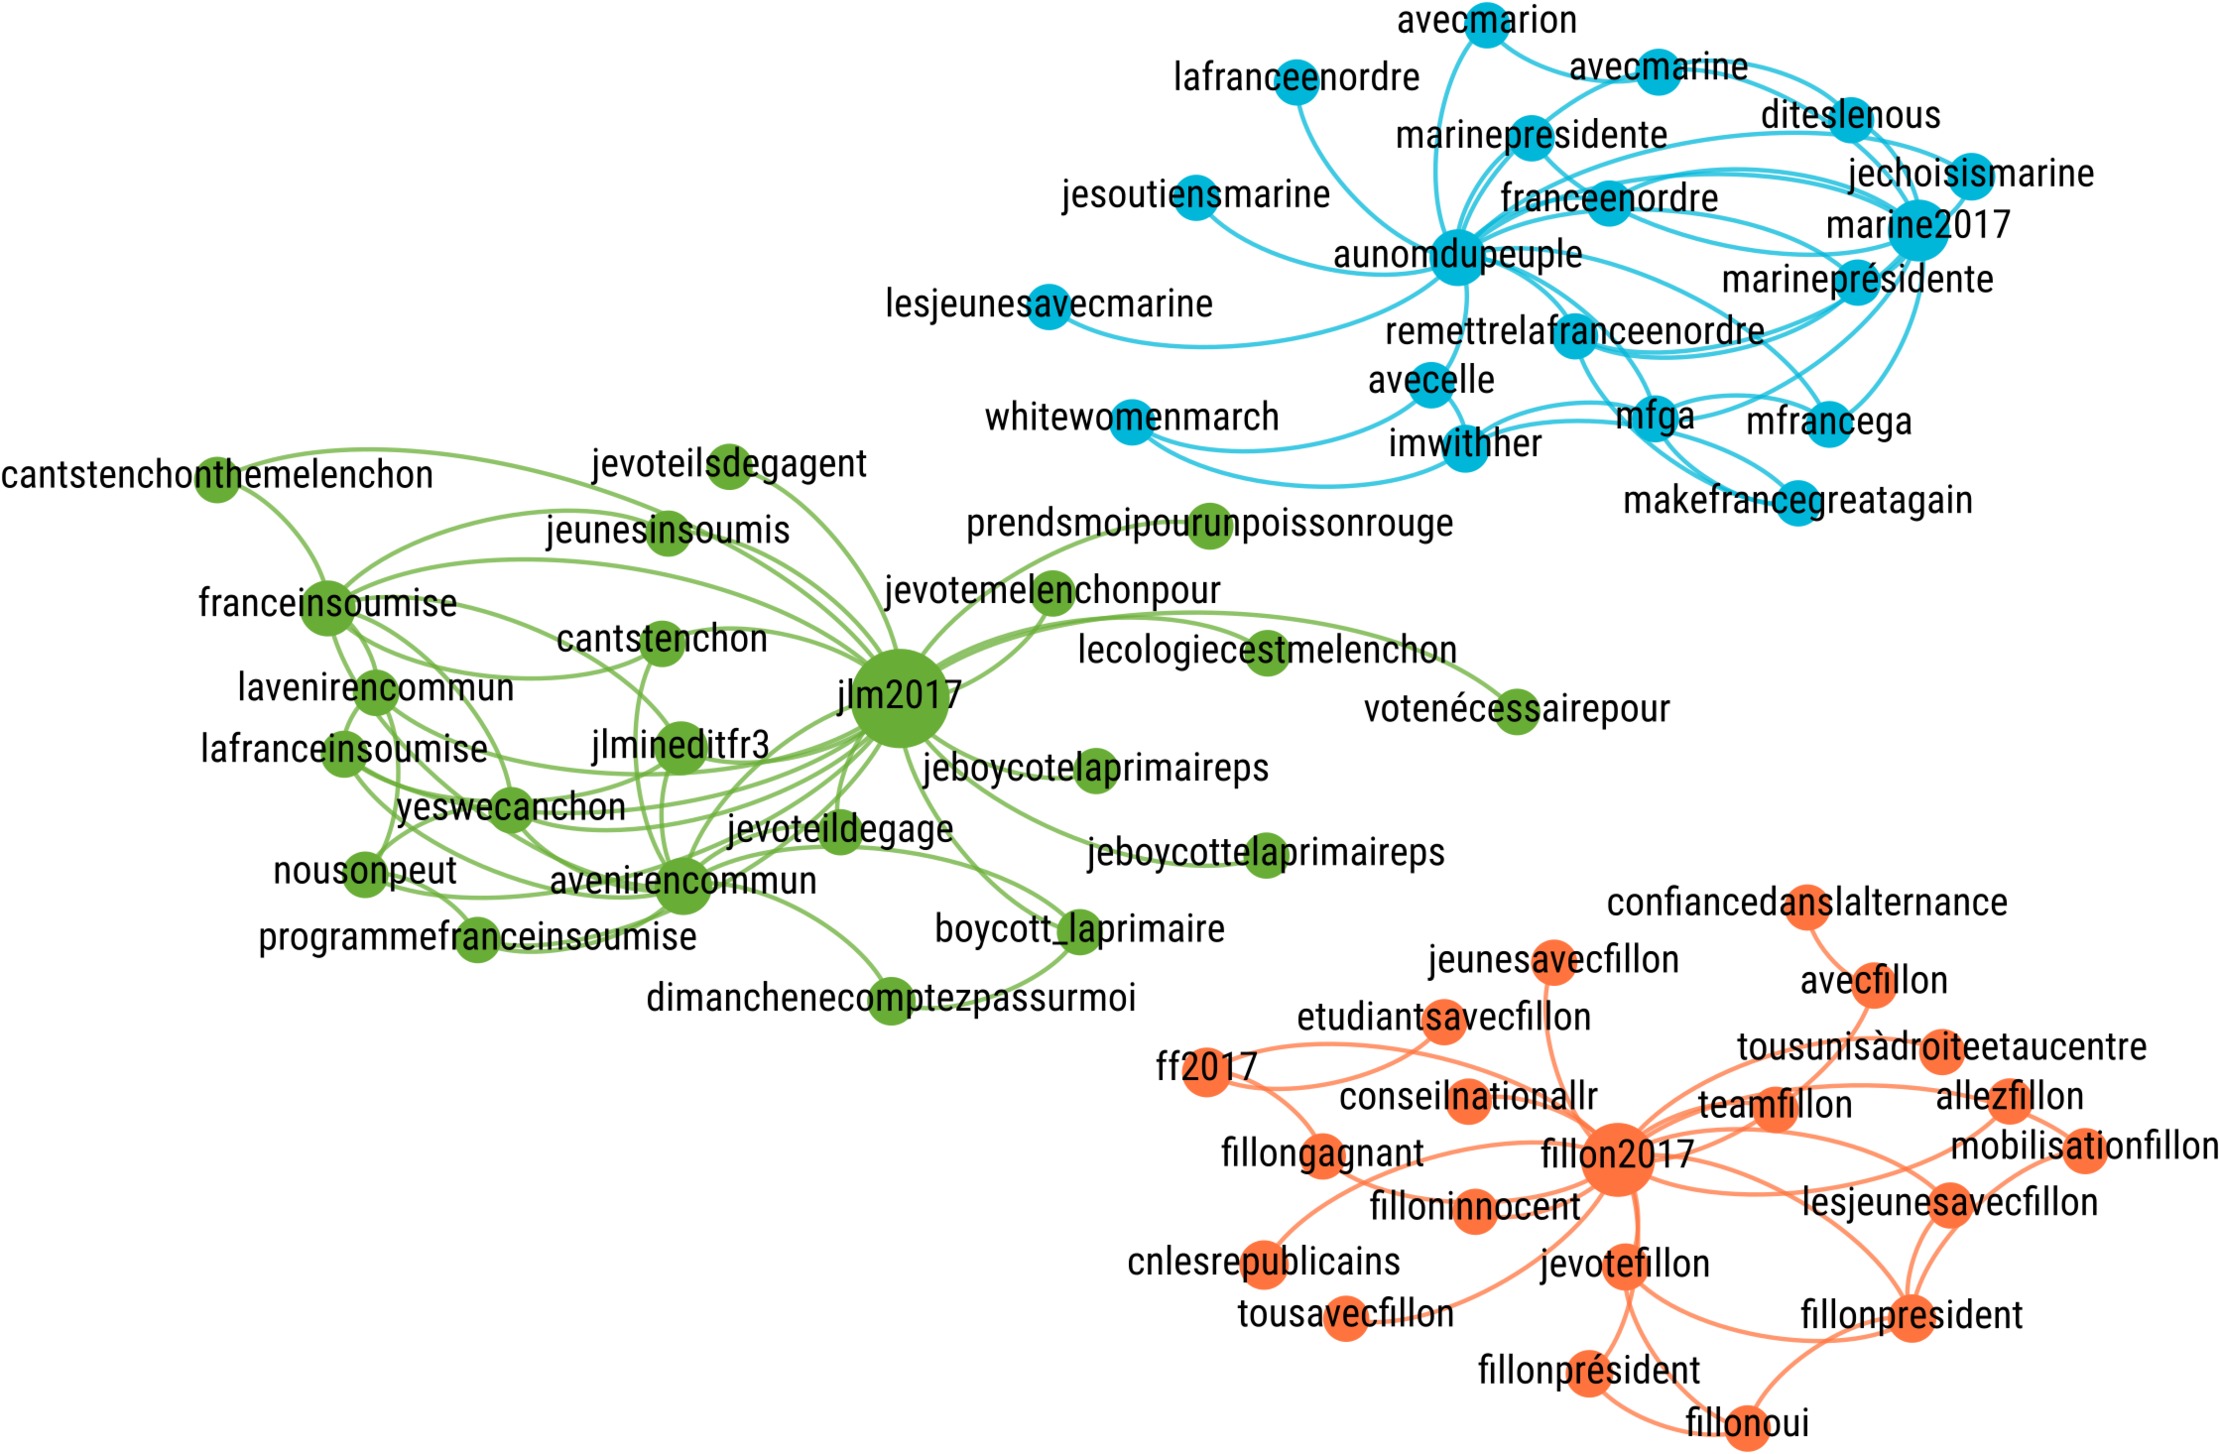
The important ingredient for the application of the supervised learning technique to any kind of topic is the separation of the hashtag co-occurrence network in well-defined clusters identifying the main opinions toward the issue at hand. For instance, in the case of Trump/Clinton, the separation of the co-occurrence hashtag network into two clear camps allowed the application of the supervised method to the American election with two main candidates. In the case of the current French election, we have collected tweets related to three main candidates of the 2017 French Presidential election (François Fillon, Marine Le Pen and Jean-Luc Mélanchon) to test the generality of our analytics to this kind of multi-partite political systems. The chosen candidates correspond to the three main confirmed candidates at the time of data acquisition (December 19th, 2016 to January 31st, 2017). This is the reason why we did not acquire data about Emmanuel Macron, who ultimately passed the first round of the elections along with Marine Le Pen. The results of the co-occurrence hashtag networks emanating from the tweets related to the French elections are shown in Fig. 16 in the Supplementary Information. We find that a separation of the co-occurrence network into three clear clusters is achieved for the hashtags employed by users expressing supports to three candidates to the French presidential election. Each group expresses predilection for each of the three French presidential candidates indicating that the opinion inference methods can be applied to this kind of situation as well.
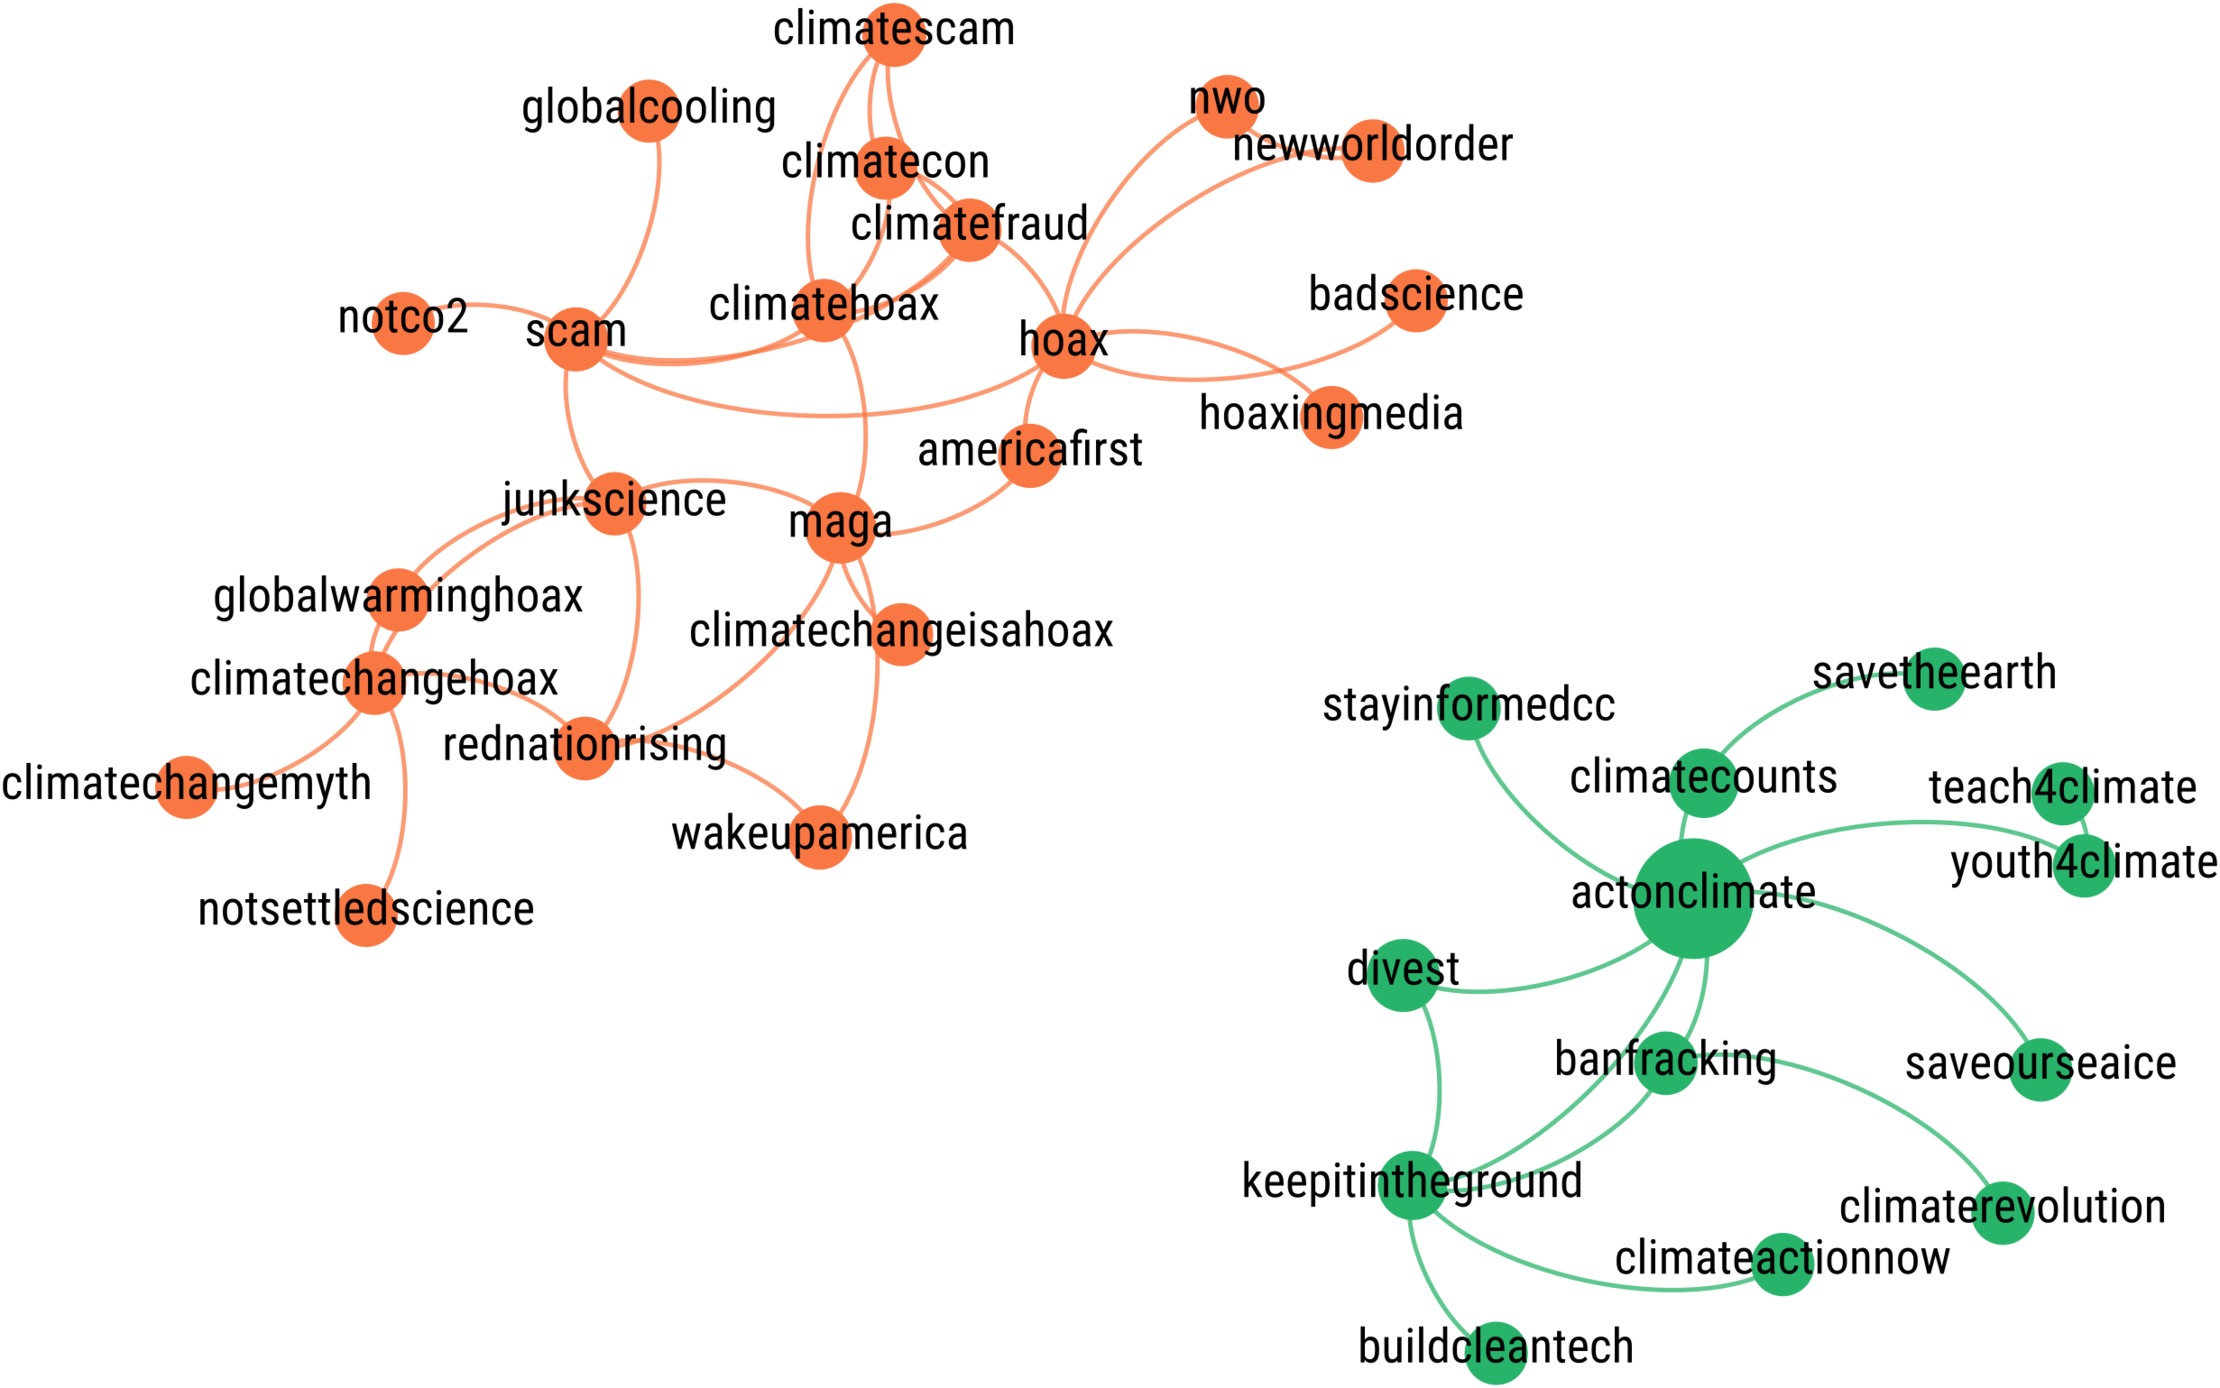
Furthermore, we have also investigated whether the method can be implemented for public opinion outside an election setting. These “generality tests” are of importance to distinguish an ad-hoc research (anecdotal) versus a methodological contribution. For this purpose, we have collected tweets from a single topic, such as “climate change”, in search of a generalization of our algorithms. Figure 15 in the Supplementary Information shows the result of the hashtag co-occurrence network in this case. We find that this network naturally splits into two groups, one with hashtags supporting action toward climate change and the other with hashtags depicting climate change as a hoax. This result suggests that our machine learning and co-occurrence hashtag network method can be generalized to topics beyond the election setting. The minimal ingredients to apply our methods are the existence of a set of users interested in the topic and the appearance of separated hashtag clusters in the co-occurrence network. This separation was evident in all cases considered in this study: the US and French elections as well as climate change.
Our approach can thus be extended to understand general trends from social media including, but not restricted to, societal issues, opinion on products and brands, to political movements.
1.4 Measuring political support
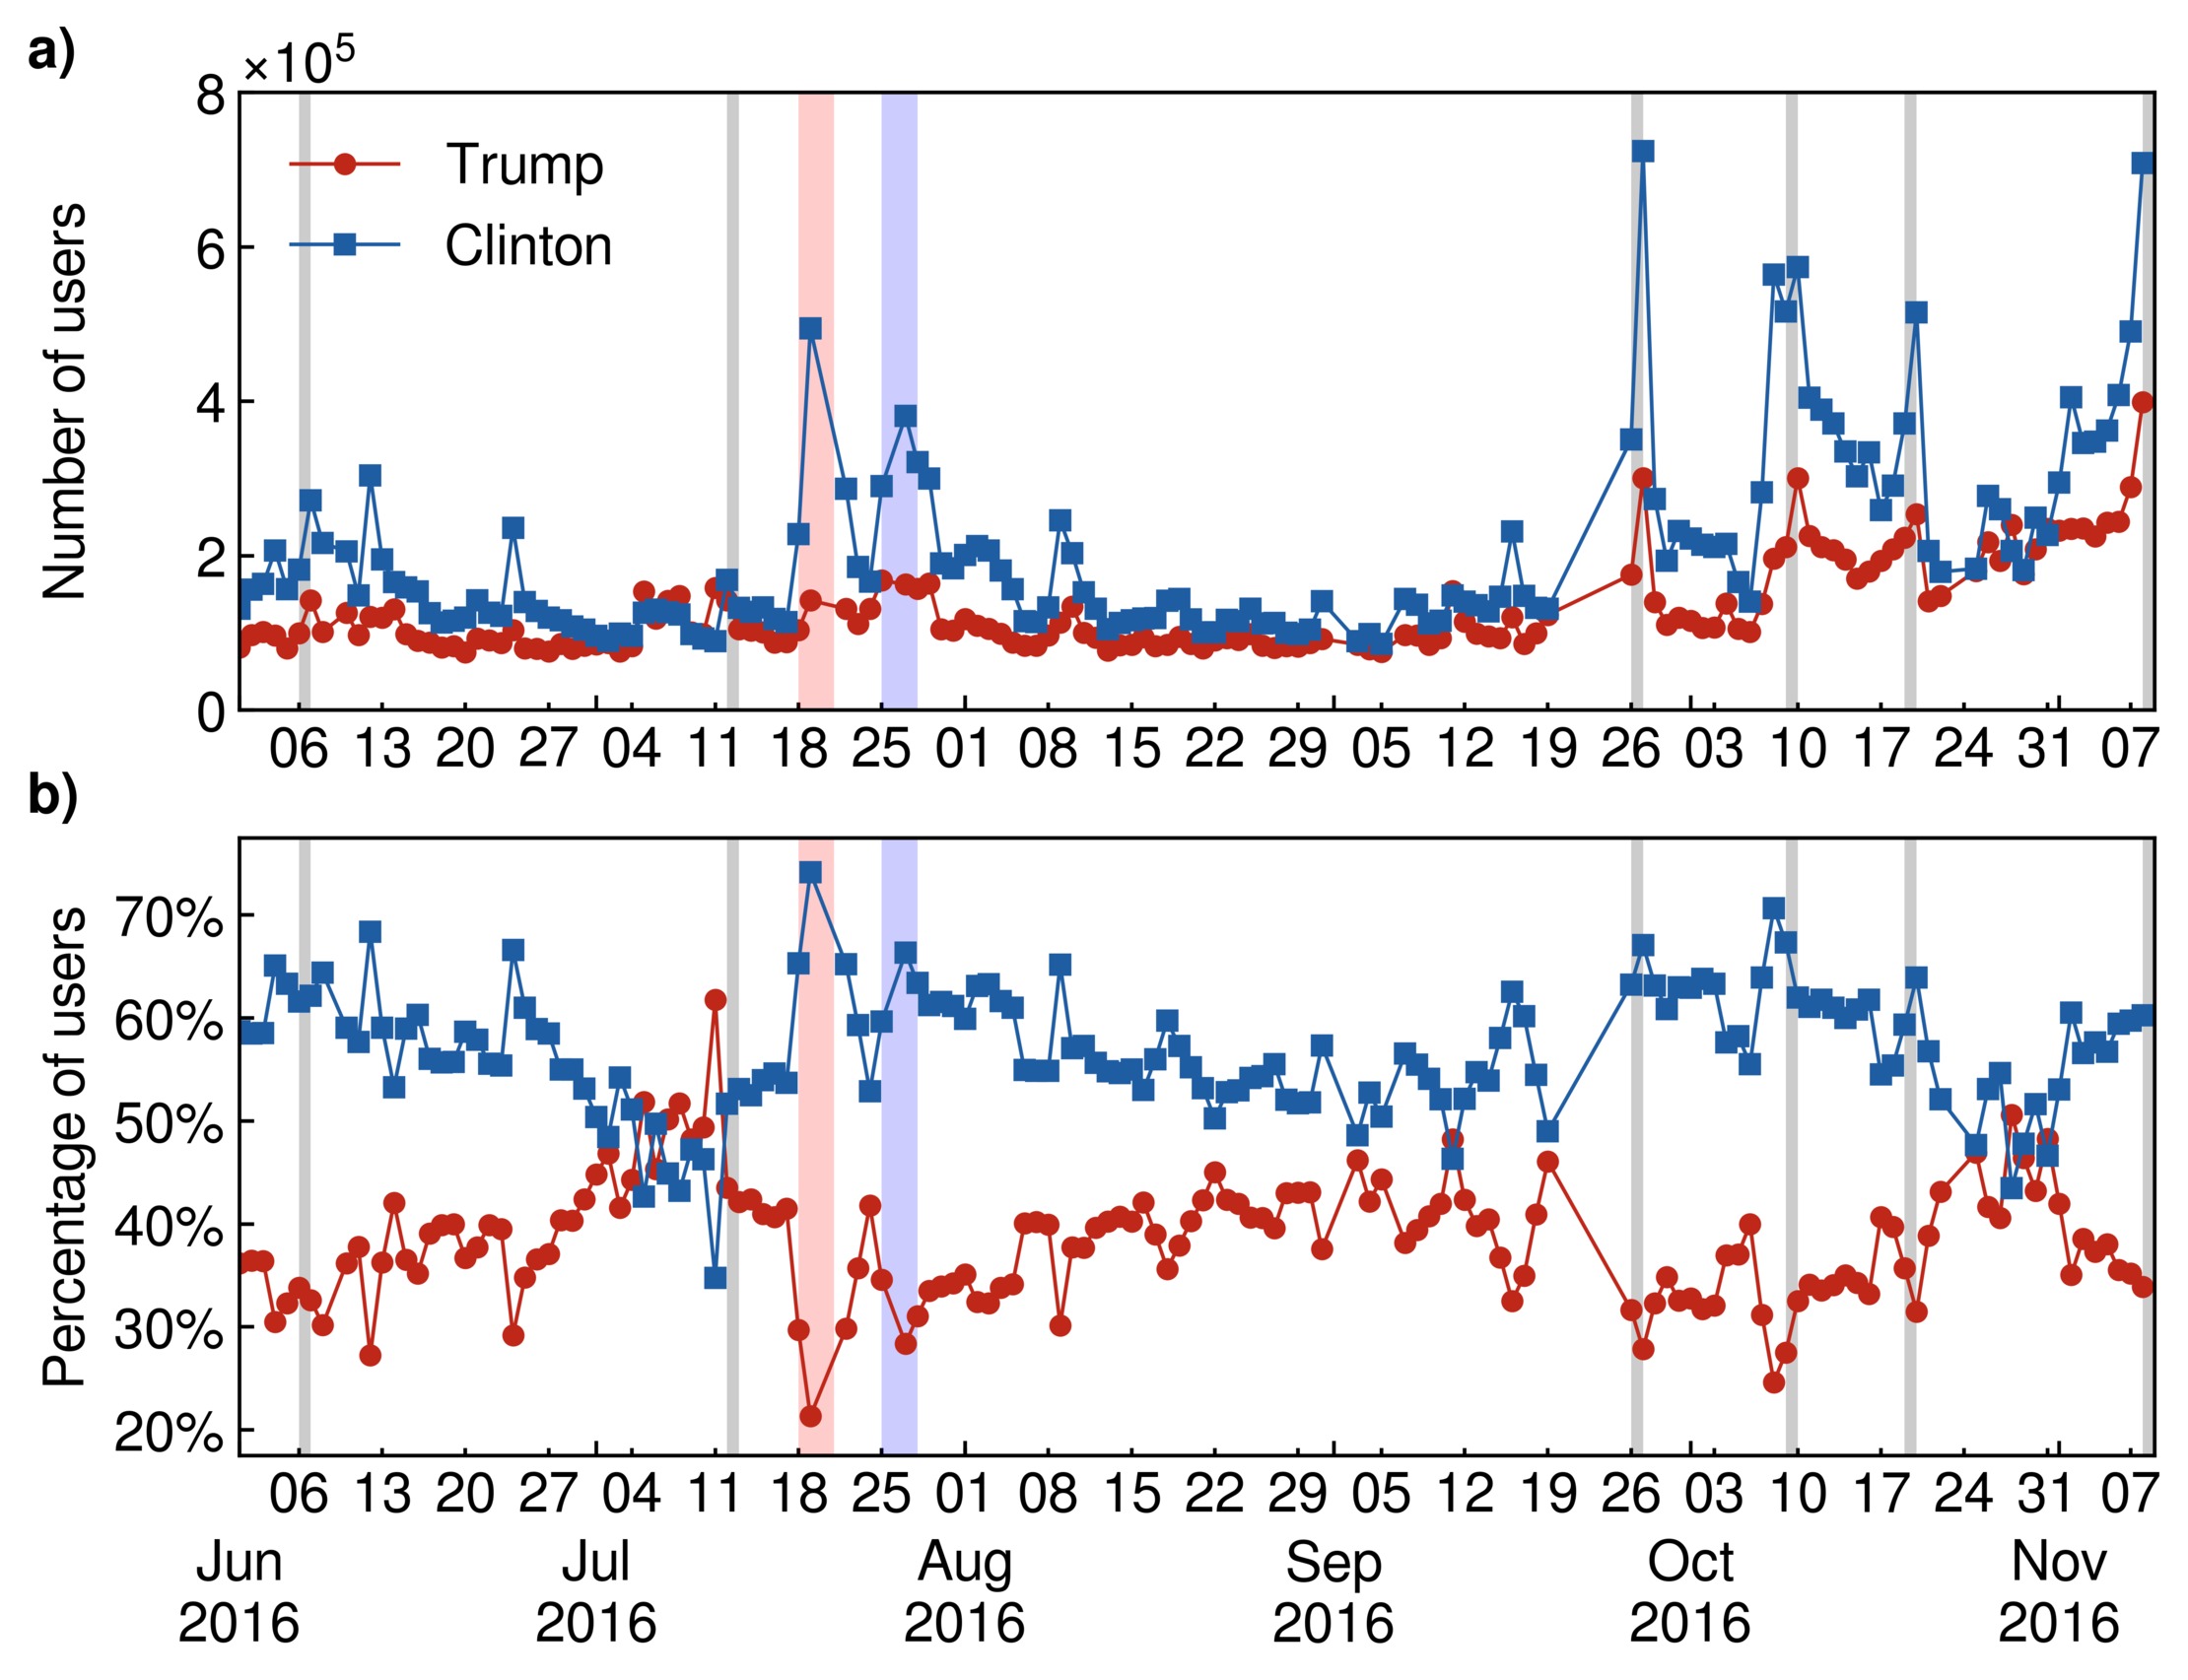
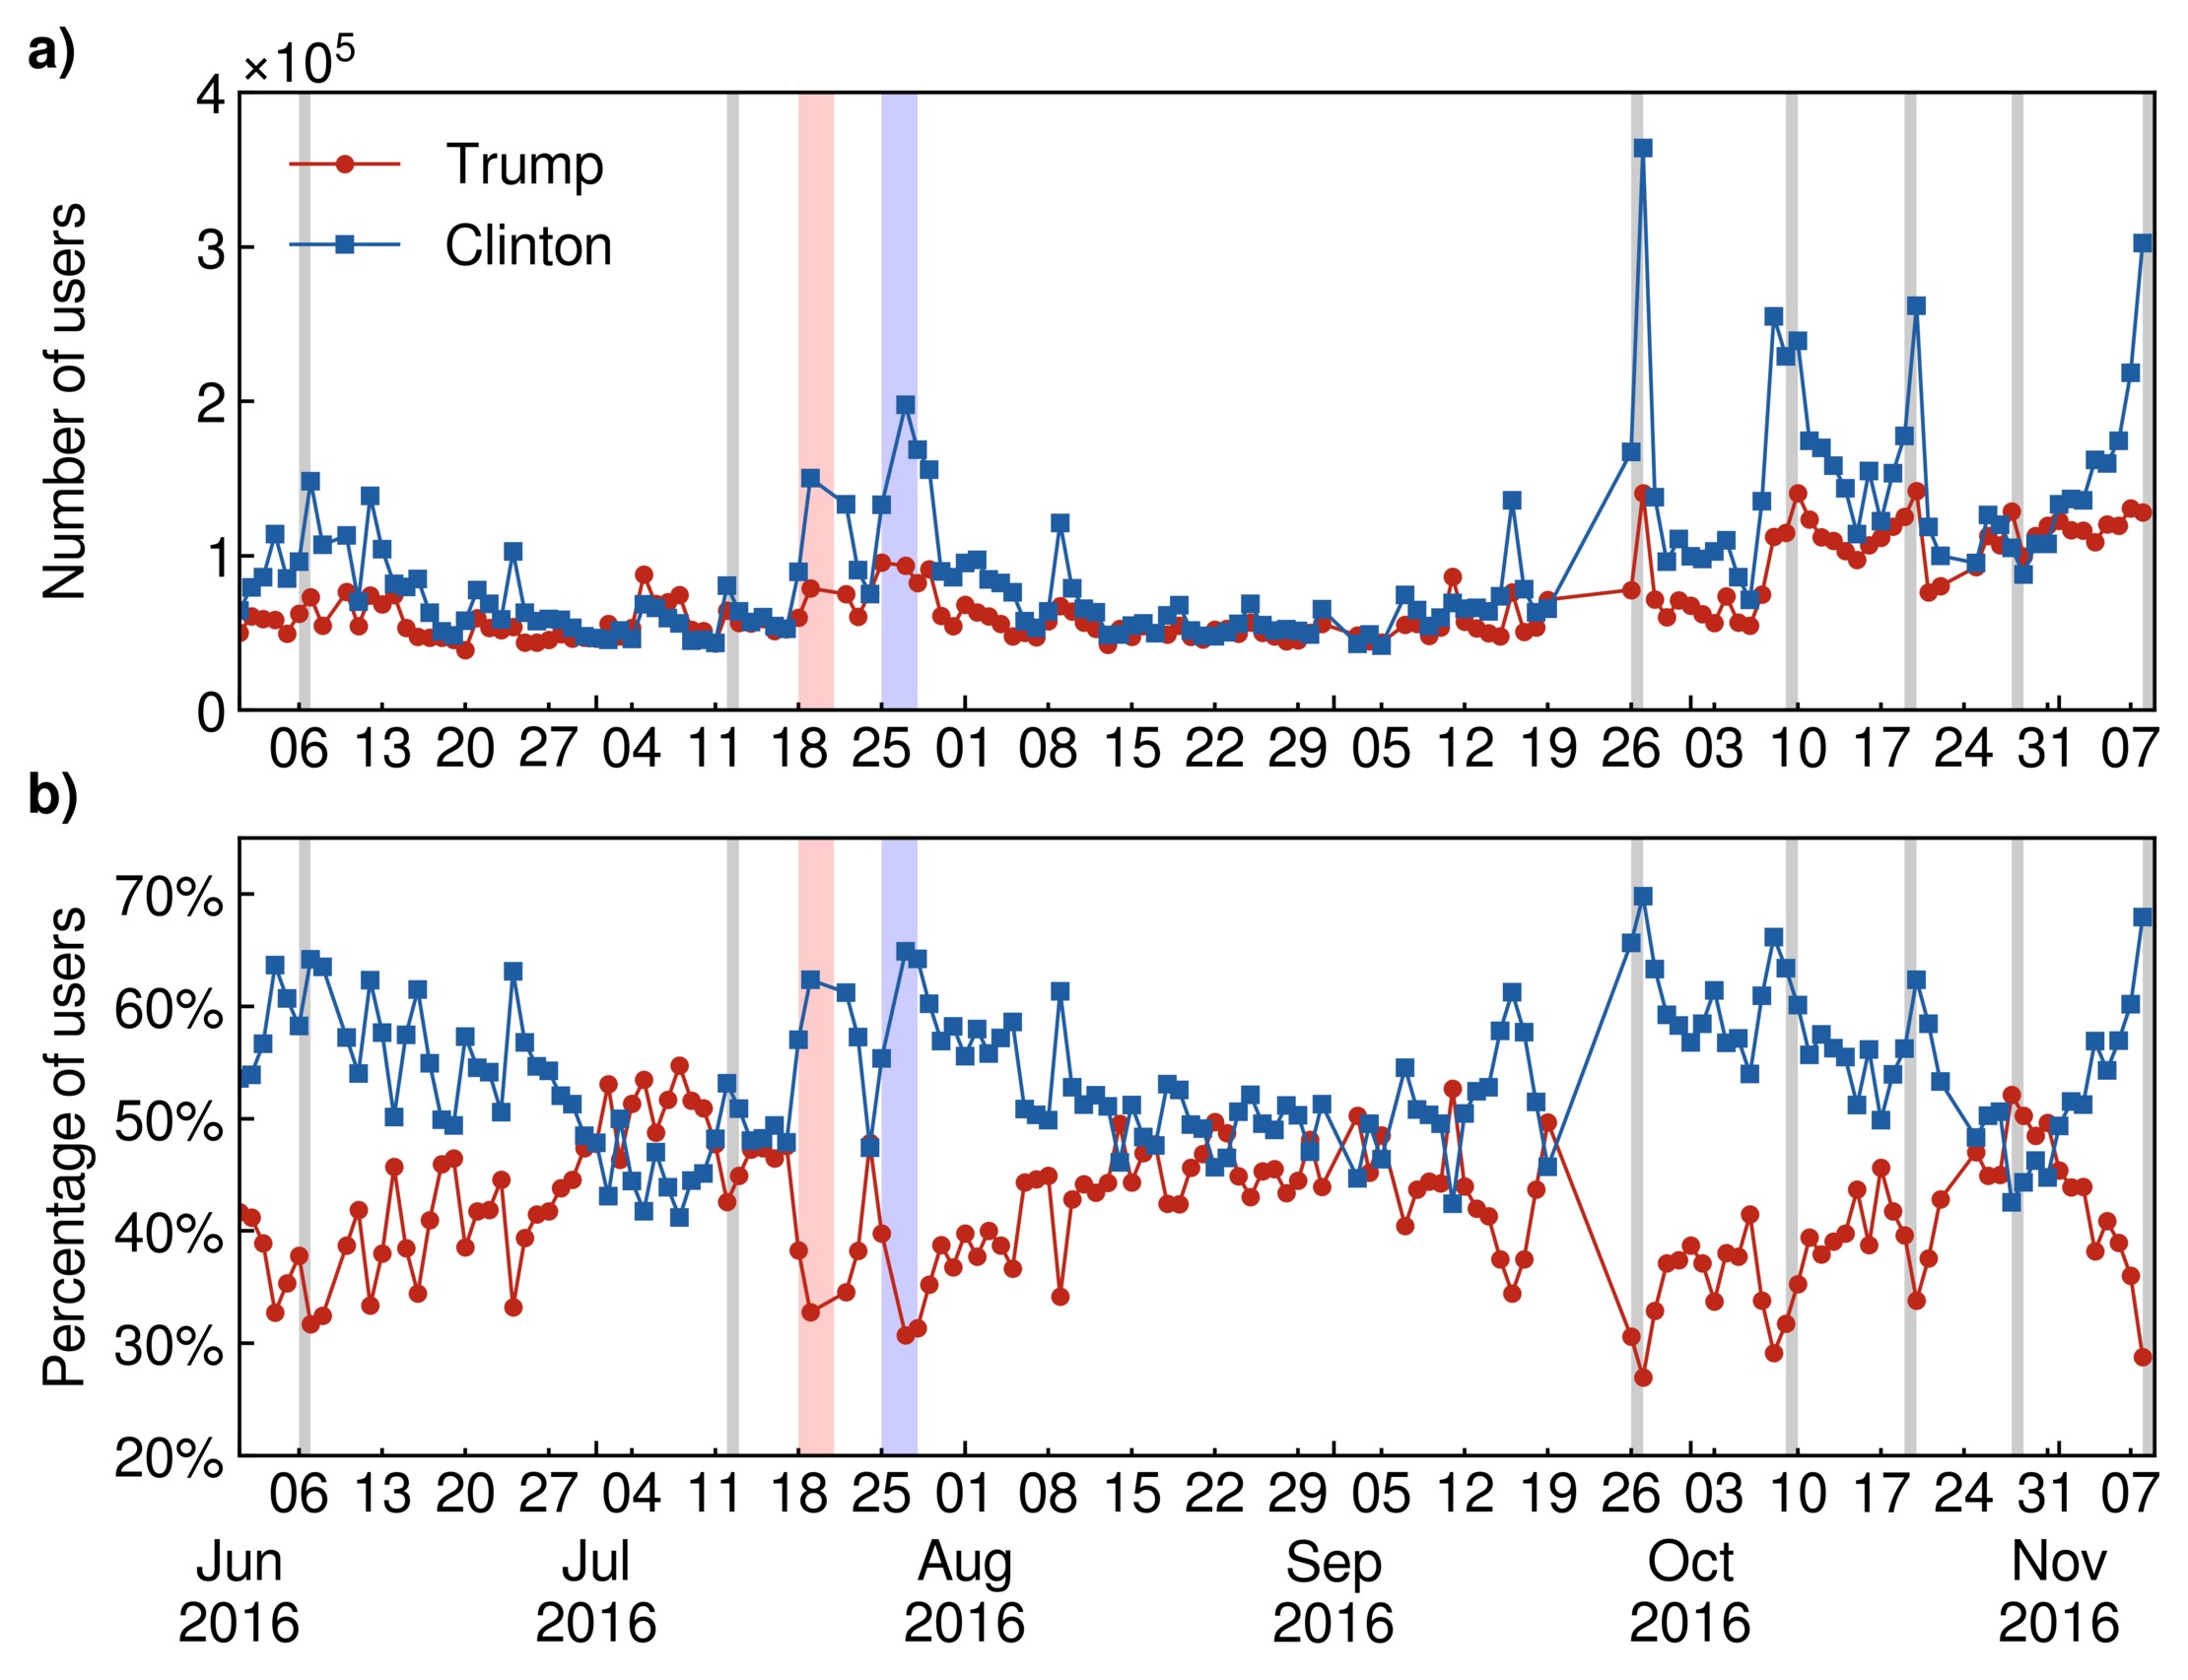
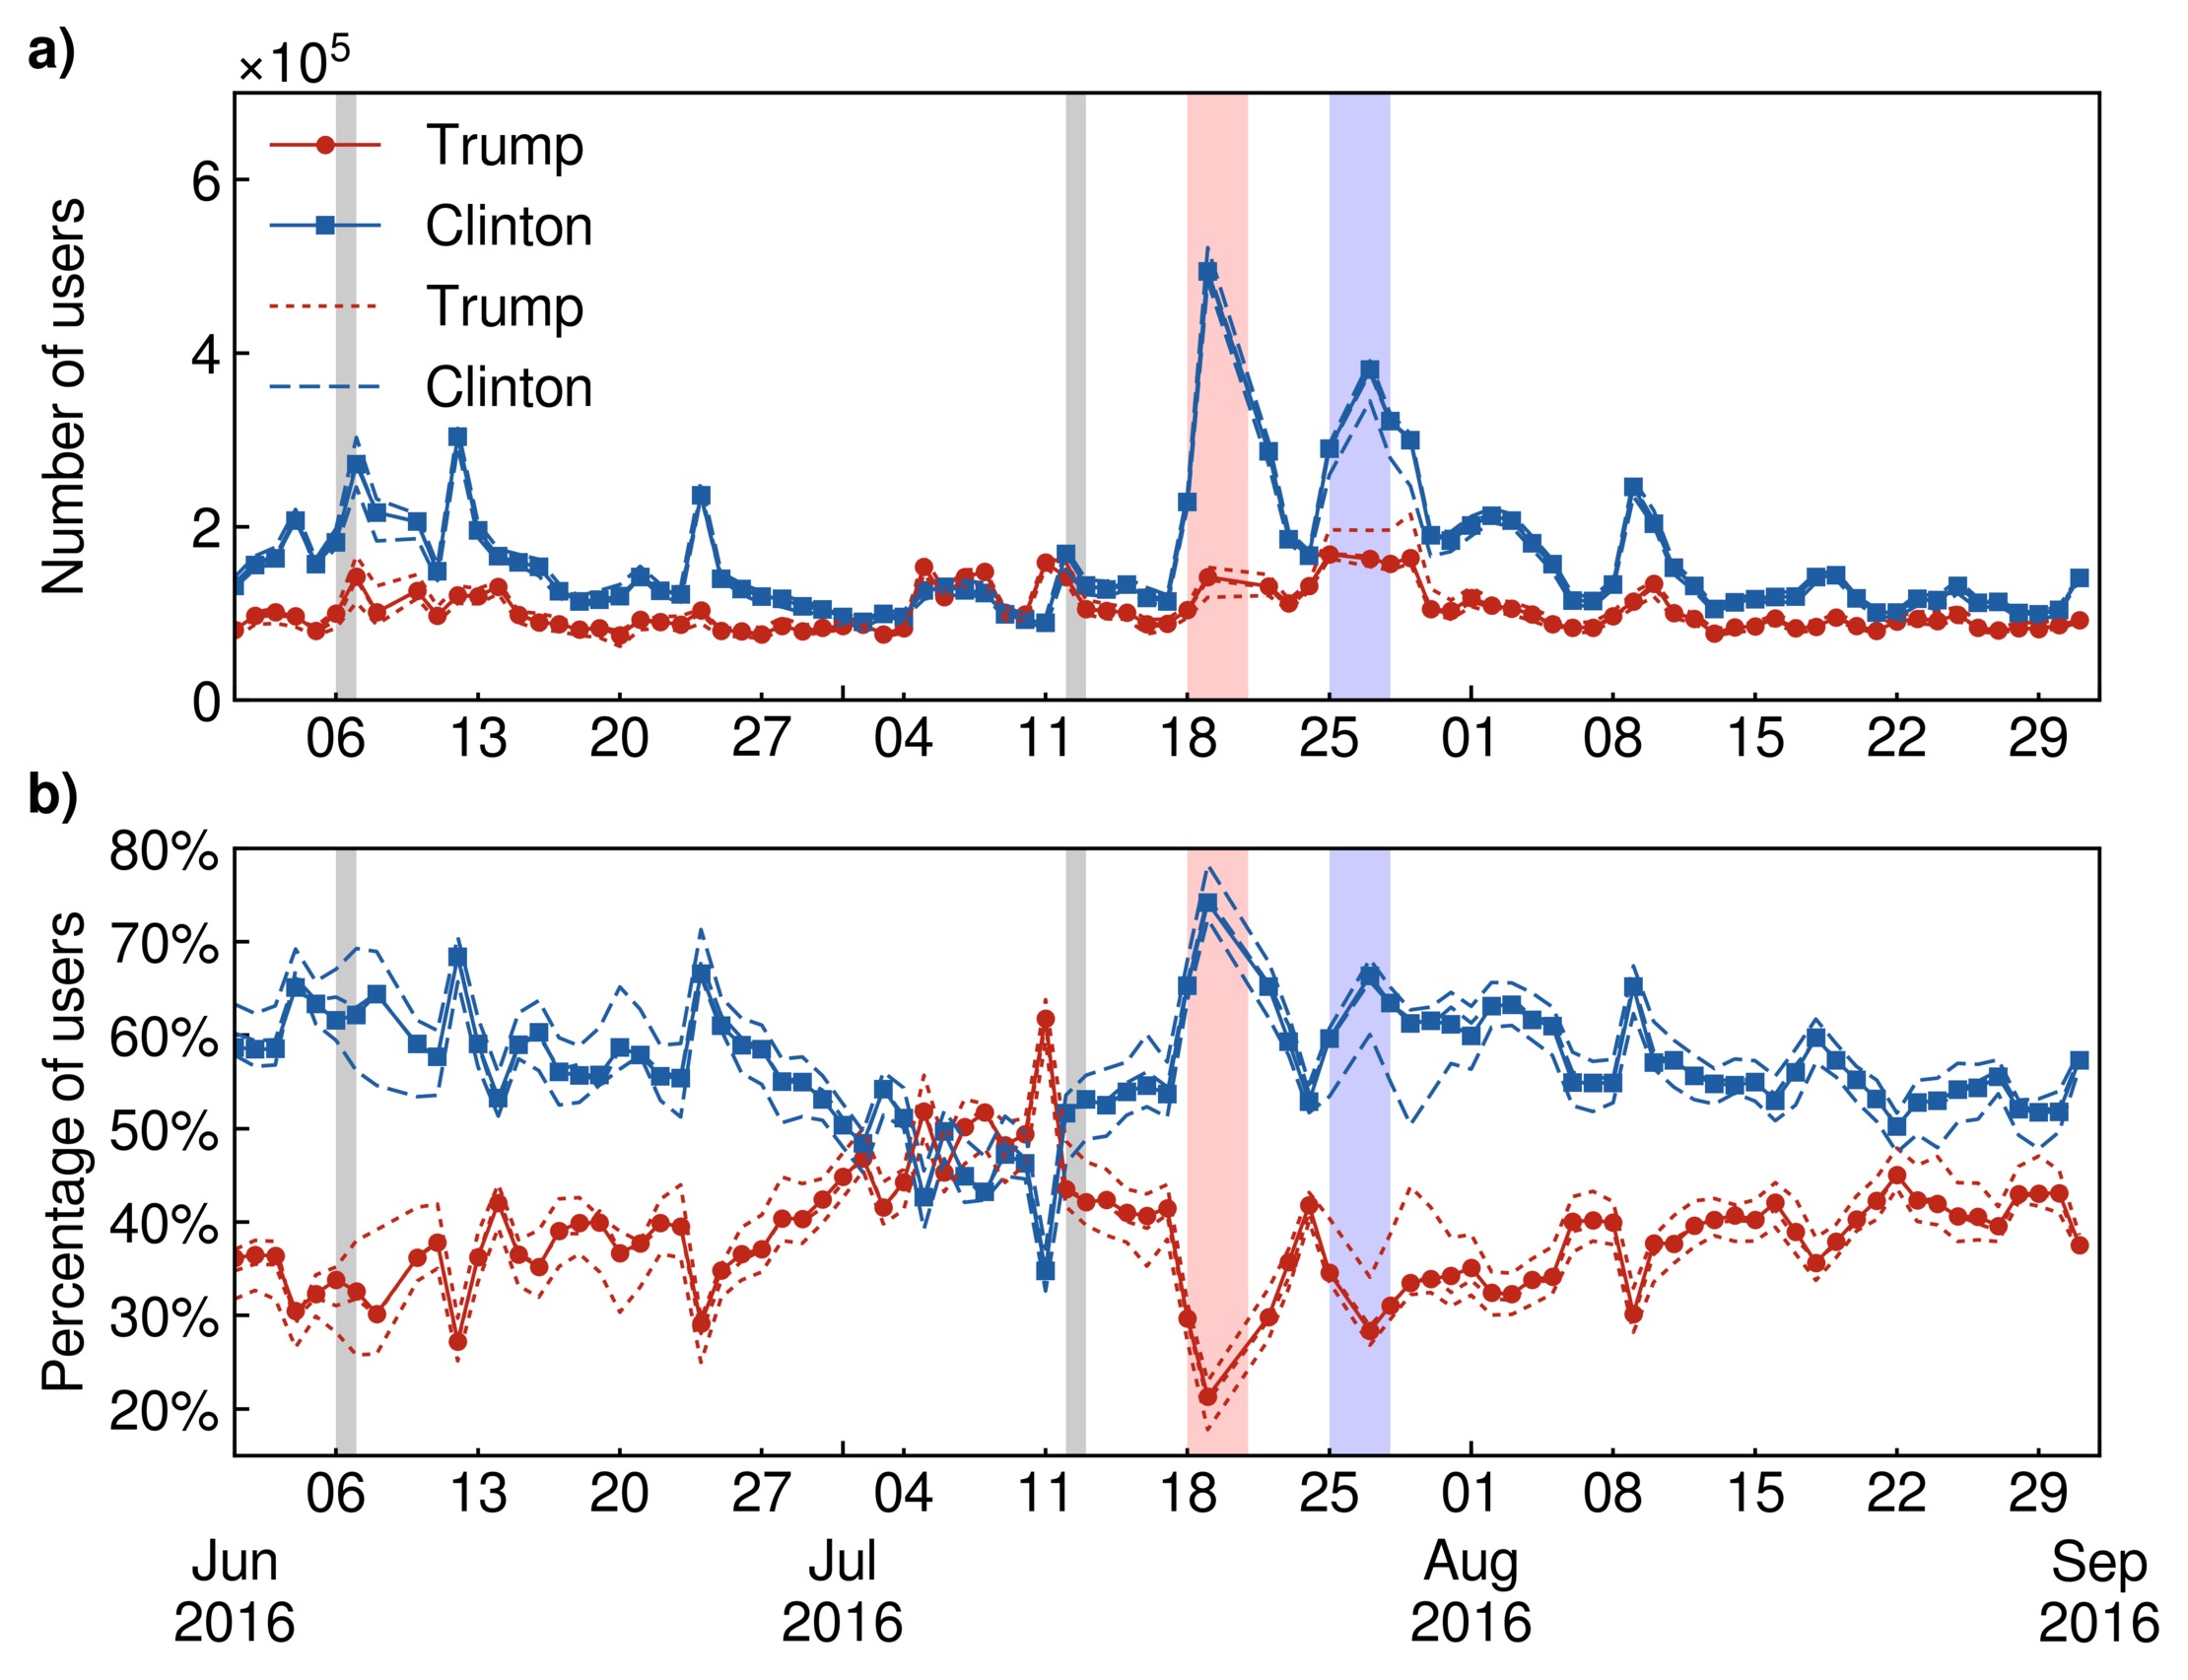
The absolute number of users expressing support for Clinton and Trump as well as relative percentage of supporters for each party’s candidate in the strongly connected component and in the entire population dataset are shown in Figs. 4 and 5, respectively. Results for the weakly connected component are similar to the whole population. The support of each users is assigned to the candidate for which the majority of its daily tweets are classified (see Methods 3.3). Approximately 4.5% of the users are unclassified every day, as they posts the same number of tweets supporting Trump and Clinton. We only consider tweets originating from official Twitter clients in order to discard tweets that might originate from bots and to limit the number of tweets posted from professional accounts. After this filtering, 92% of the) total number of tweets remain.
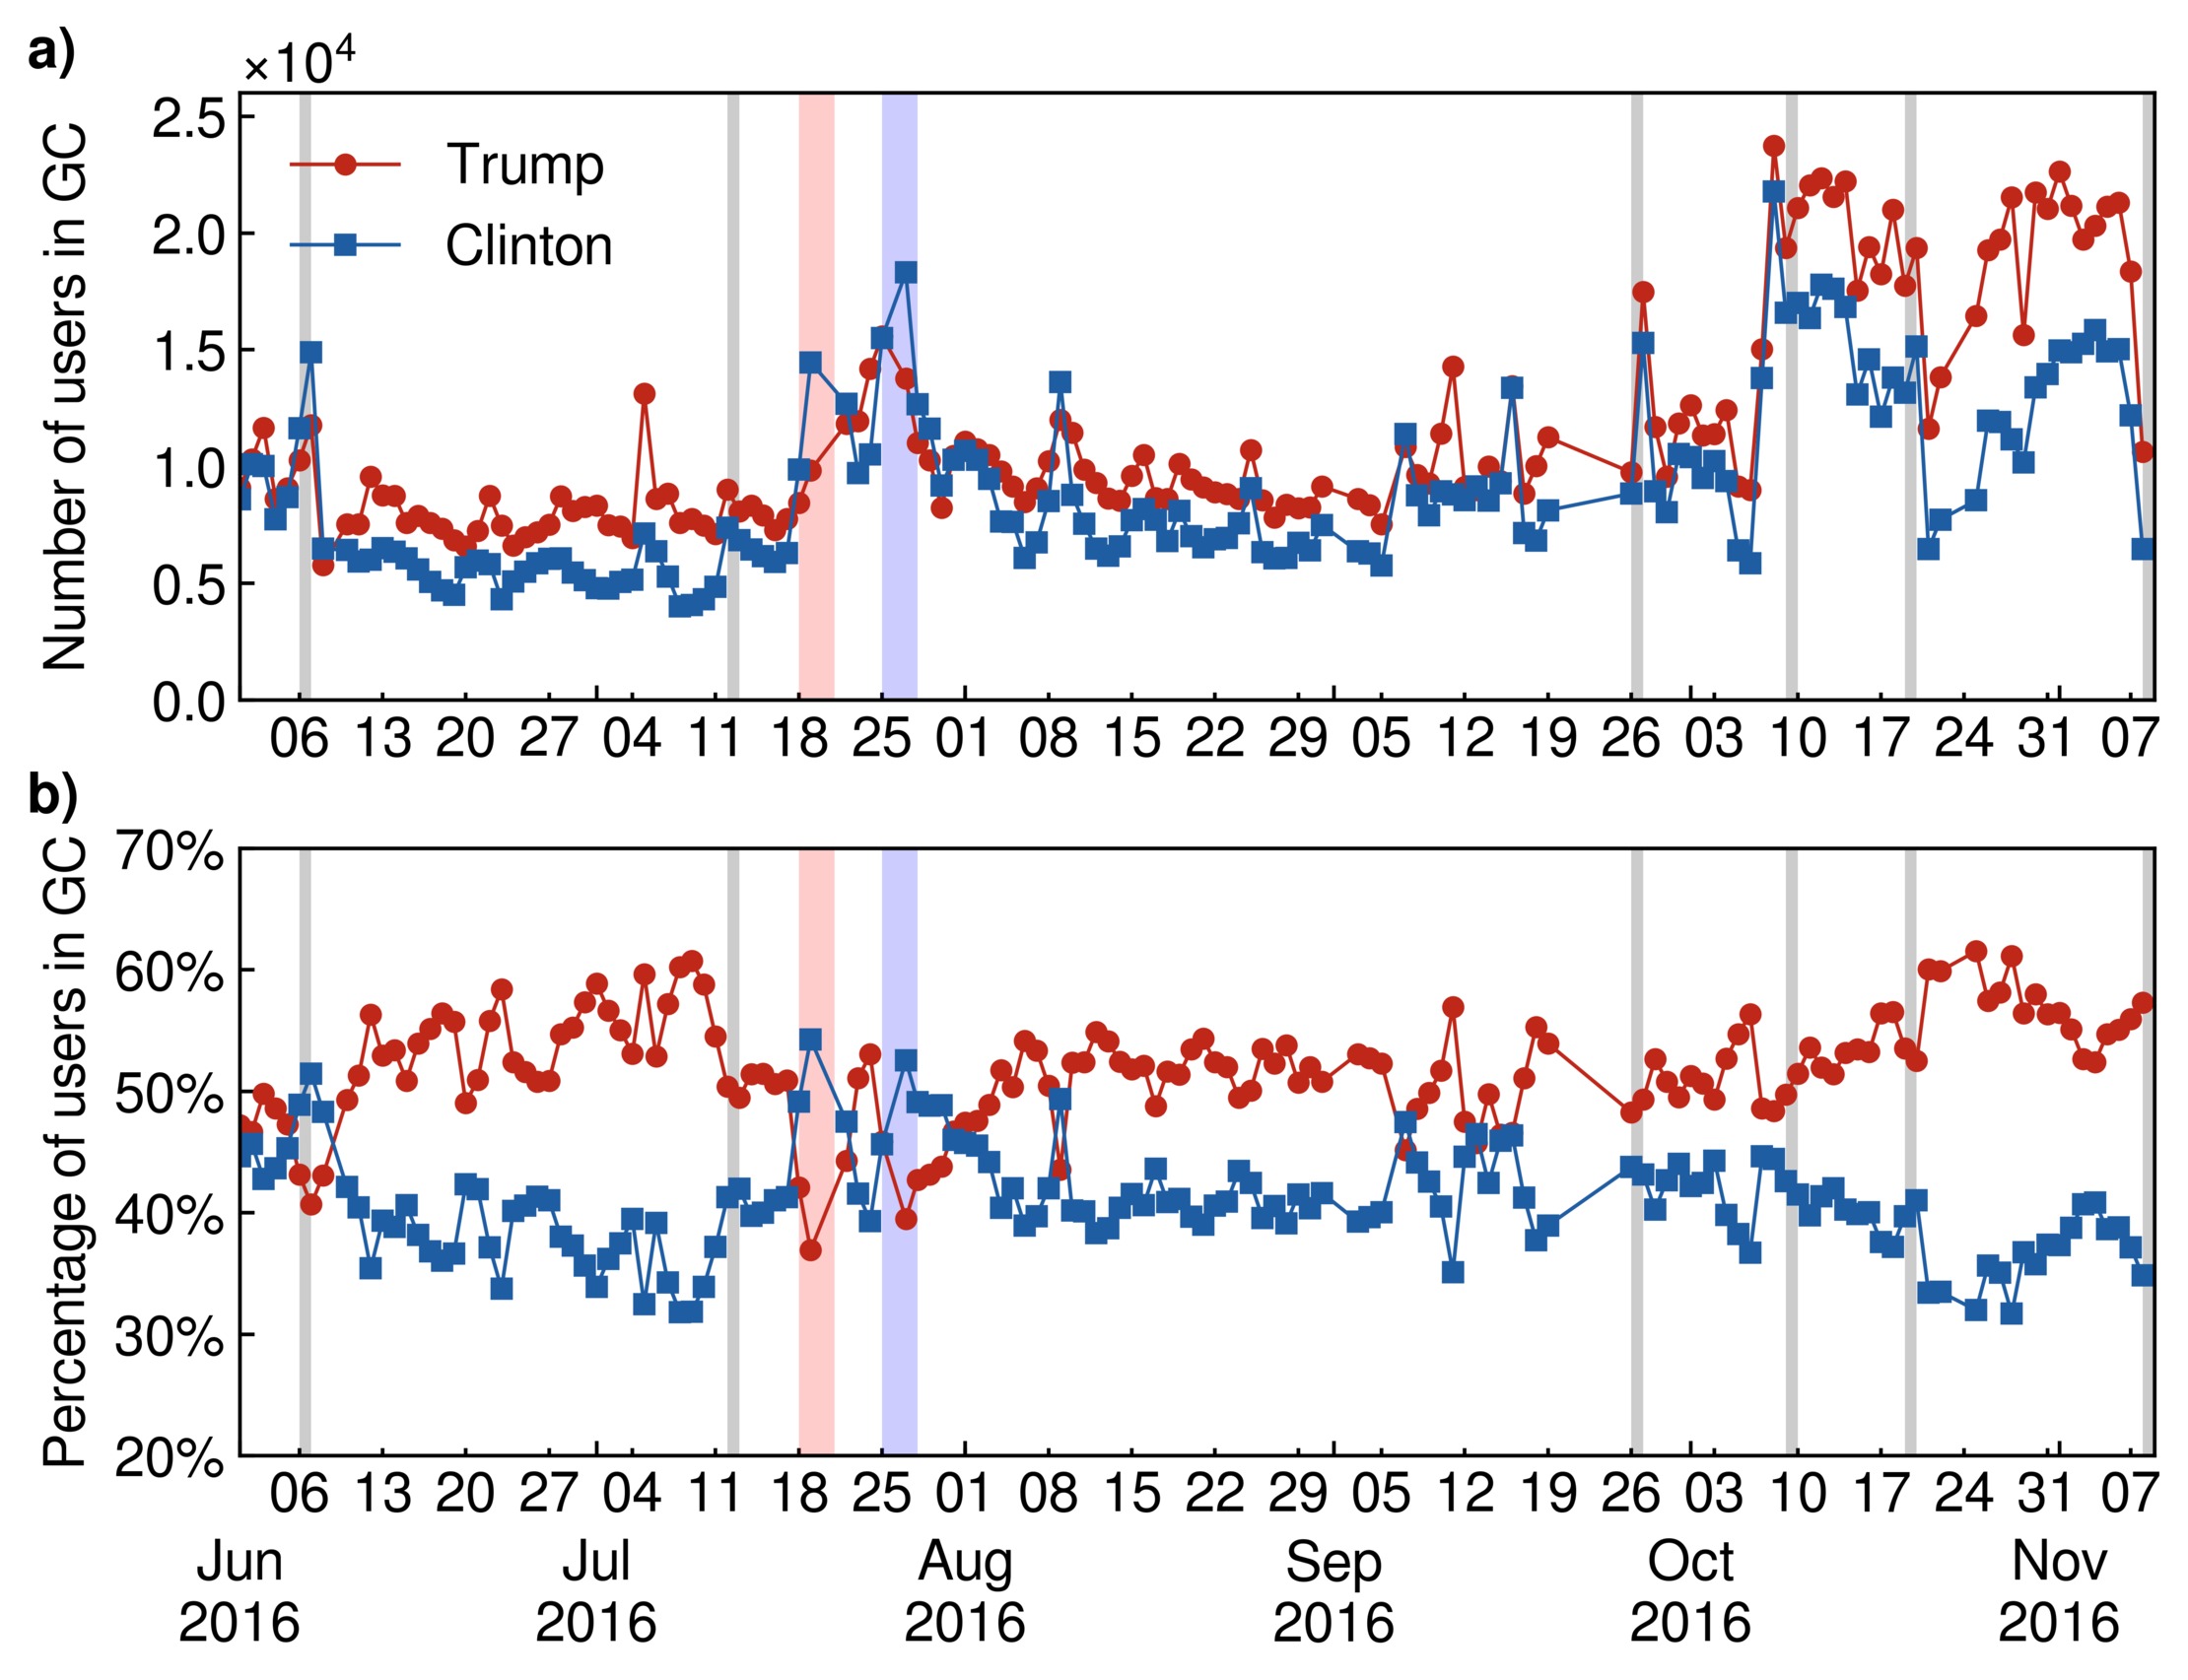
We find important differences in the popularity of the candidates
according to the giant components considered. The majority of users
in the SCGC are clearly in favor of Donald Trump for the majority
of the time of observation (Fig. 4).
However, the
situation is reversed, with Clinton being more popular than Trump,
when the entire Twitter dataset population is taken into account
(Fig. 5), revealing a difference in the network
localization of the users belonging to the different political
parties.
A difference in the dynamics of the supporters’ opinion is
also uncovered: during important events, such as
the conventions or the presidential debates, Hillary Clinton’s supporters show
a much more important response than Donald Trump’s supporters (Fig. 5a)
and even sometimes slightly dominate the SCGC (Fig. 4b).
This difference in behavior is also manifested in the fact
that spikes in favor of Donald Trump in the percentage of opinion (Fig. 5b),
such as on October 28 when FBI Director, James B. Comey, sent a letter to the Congress saying that new emails,
potentially linked to the closed investigation into whether Hillary Clinton had mishandled classified
information, had be found,
correspond rather to a lack of activity of Clinton’s supporters then to an increase in the
engagement of Trump’s supporters (seen in Fig. 5a).
We analyze these differences in behavior and their impact on the Twitter
opinion trend in section 1.6.
The inversion of the opinion of the SCGC as compared with the result of the whole network allows us to understand the behavior of Trump/Clinton voters in a way that only Twitter can, since the network information is only available from Twitter but not from the National Polls. That is, the Trump supporters are the majority in the SCGC, while the Clinton supporters are the majority in the whole network. This last result is the only one that agree with the NYT National Polls. Using the entire dataset allows us to capture the opinion of the full Twitter population, which is what we then find in agreement with the National Polls.
1.5 Comparison with national polls aggregates
We next compare the daily global opinion measured in our entire Twitter dataset with the opinion obtained from traditional polls. We use the National Polling Average computed by the New York Times (NYT)[39] which is a weighted average of all polls (n=270) listed in the Huffington Post Pollster API (http://elections.huffingtonpost.com/pollster/api). Greater weights are given to polls conducted more recently and polls with a larger sample size. Three types of traditional polls are used: live telephone polls, online polls and interactive voice response polls. The sample size of each poll typically varies between several hundreds and tens of thousands respondents and therefore the aggregate of all polls considered by the NYT represents a sampling size in the hundred of thousand of respondents.
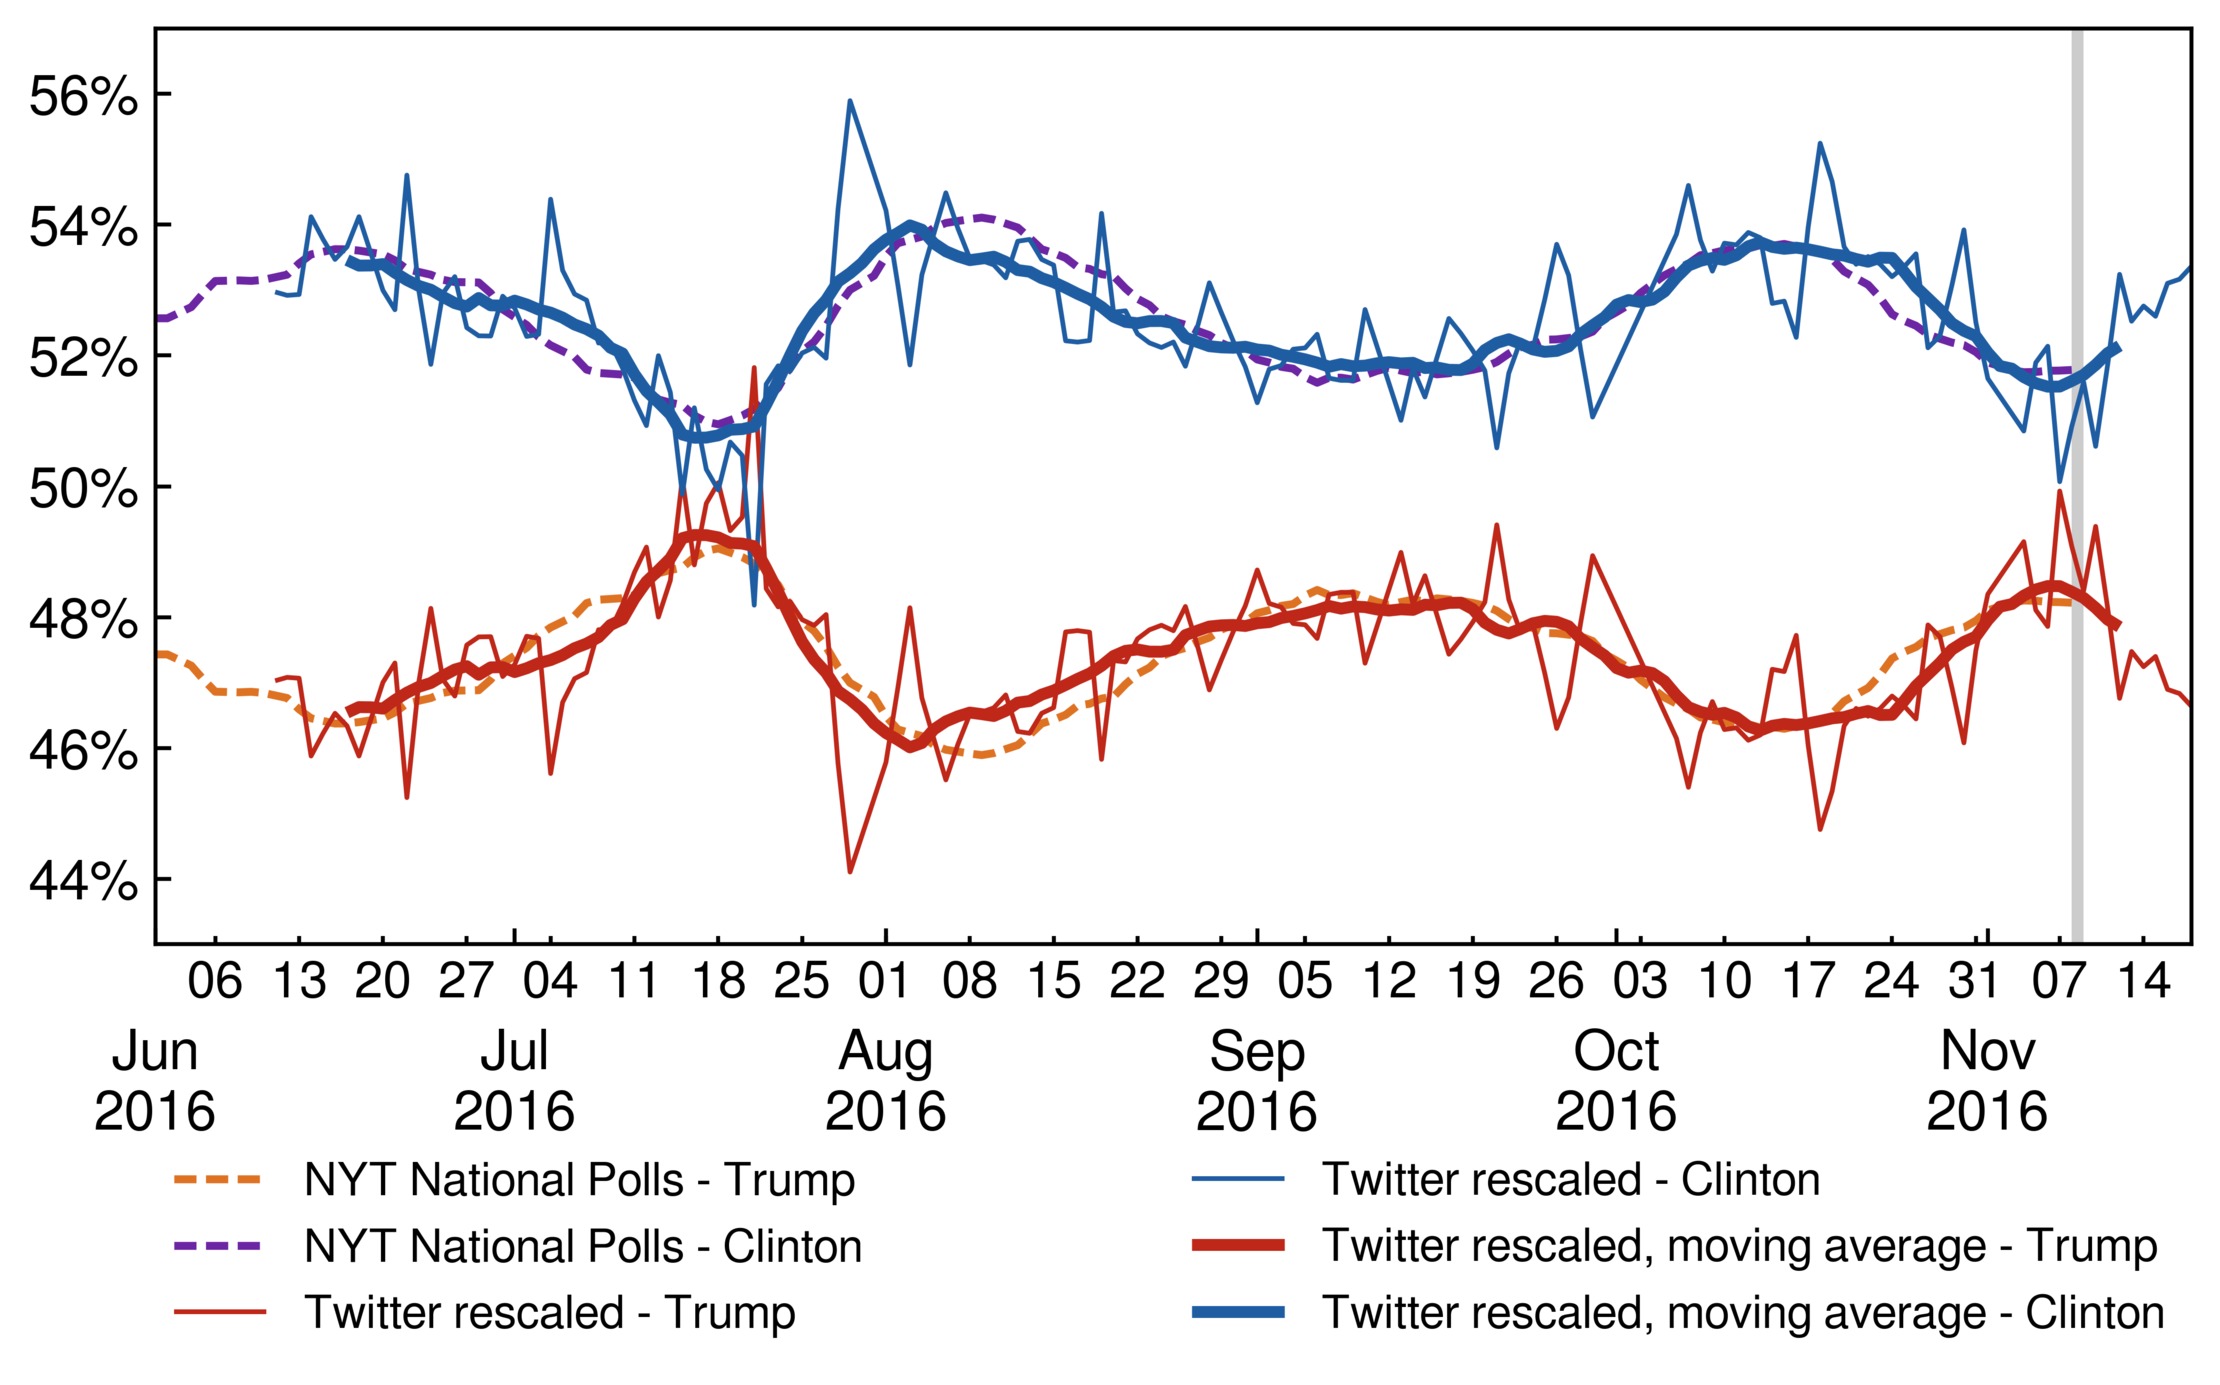
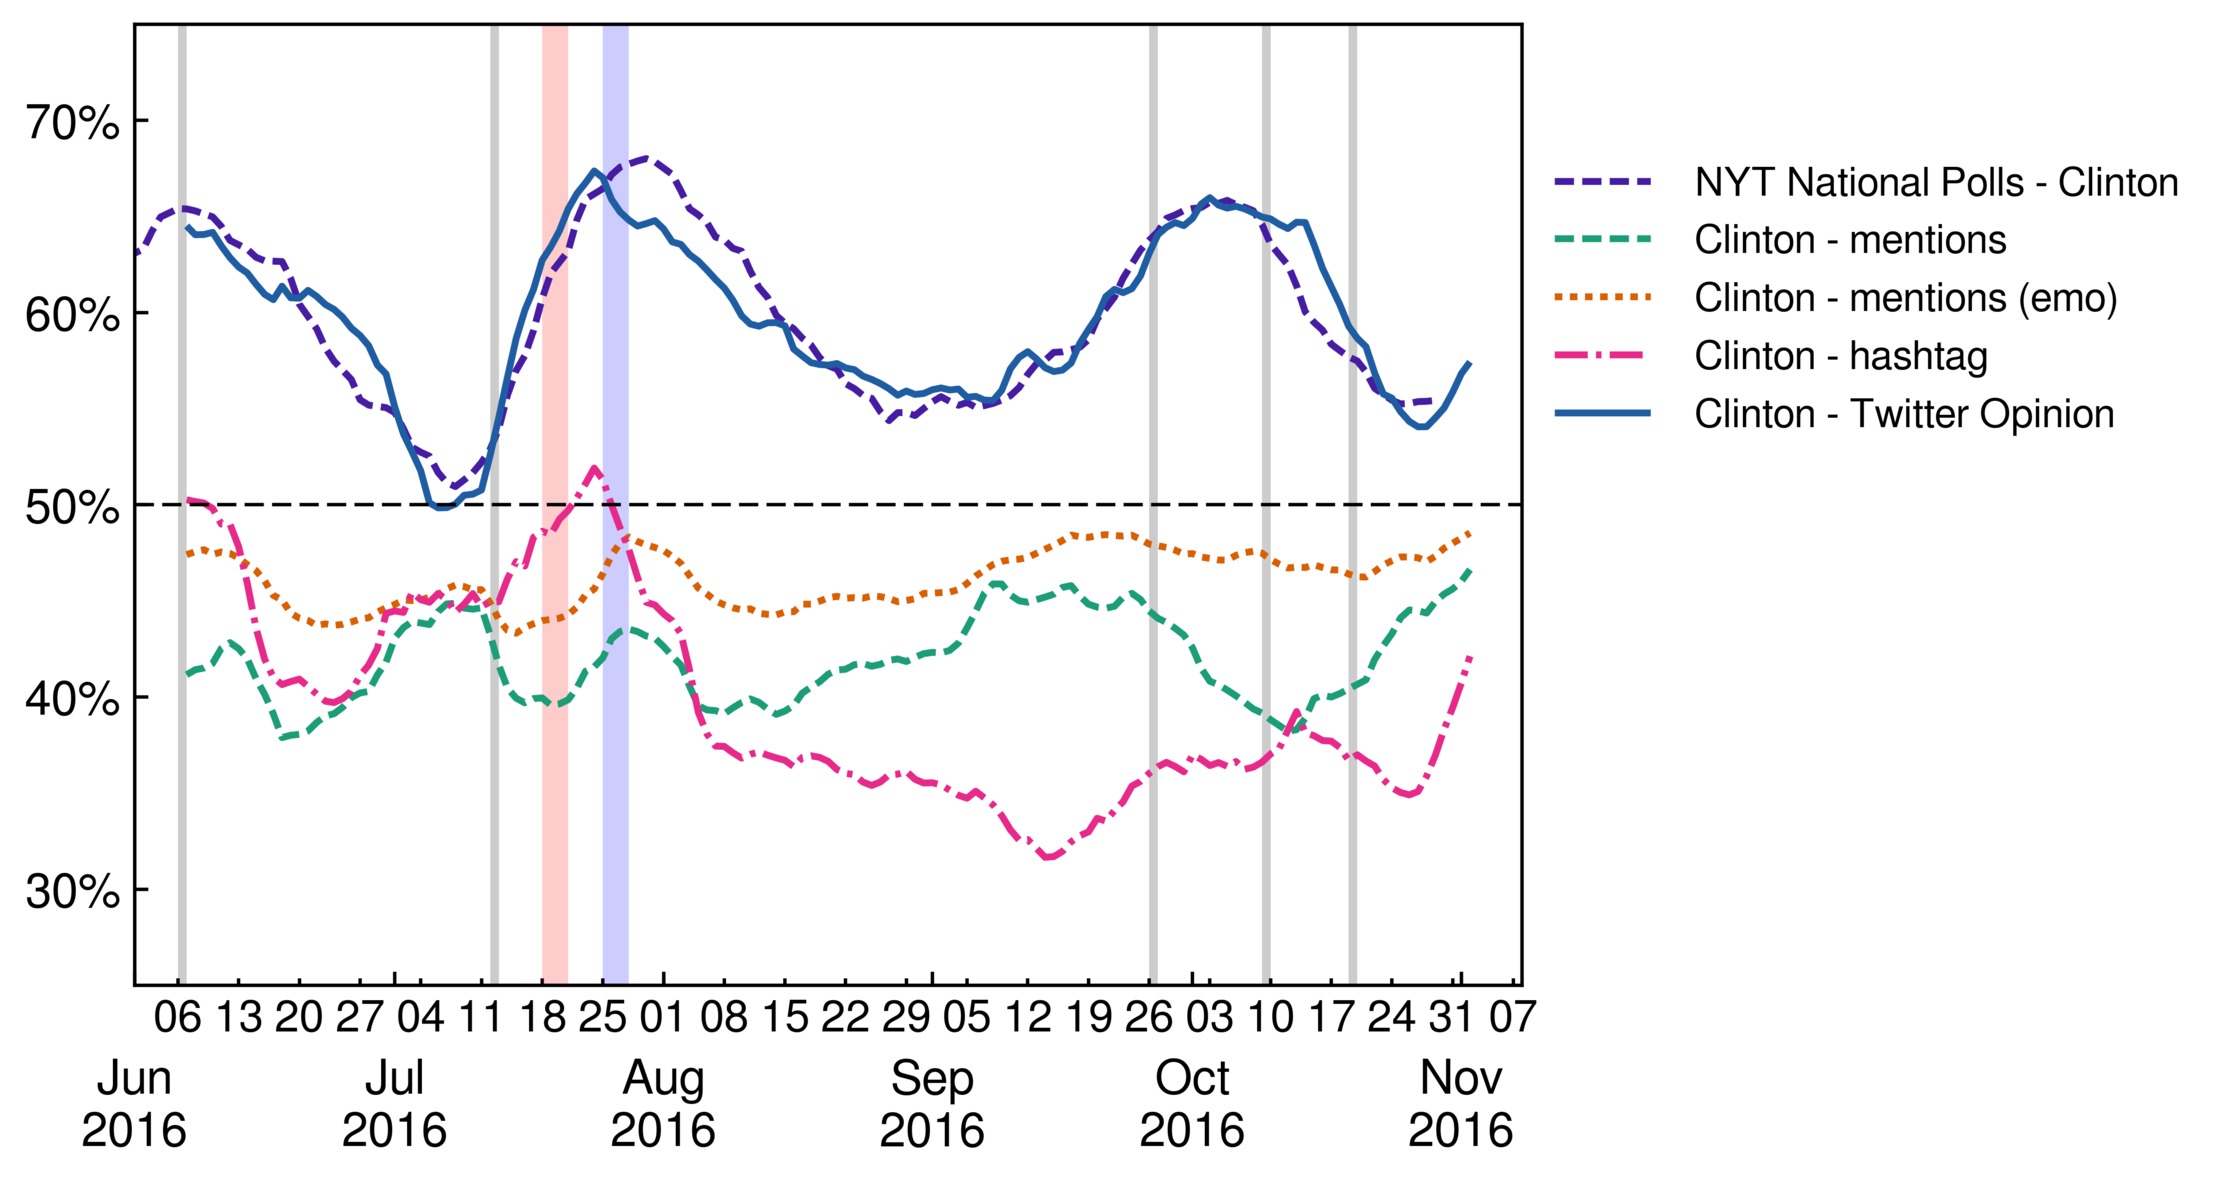
We remove the shares of undecided and third party candidates from the NYT polling average and compare the resulting relative opinion trend with the ratio of Twitter users in favor of Donald Trump or Hillary Clinton. The comparison between our Twitter opinion, Fig. 5b, and the New York Times national polling average is shown in Fig. 6. The global opinion obtained from our Twitter dataset is in excellent agreement with the NYT polling average..
The scale of the oscillations visible in the support trends in Twitter and in the NYT polls are also in agreement beyond the small scale fluctuations which are visible in the Twitter opinion time series since it represents a largely fluctuating daily average. Furthermore, a time shift exists between the opinion in Twitter and the NYT polls in the sense that the Twitter data anticipates the NYT National Polls by several days. This shift reflects the fact that Twitter represents the fresh, instantaneous opinion of its users while traditional polls may represent a delayed response of the general population that takes more time to spread, as well as typical delays in performing and compiling traditional polls by pollsters.
In order to precisely evaluate the agreement between Twitter and NYT time series, we perform a least square fit of a linear function of the Twitter normalized ratio of supporters of each candidate to their NYT normalized popularity percentage (see Methods 3.4). Specifically, we apply the following transformation:
| (1) |
where is the ratio of Twitter users in favor of a candidate at day to which we applied a backward moving average with a window length . The rescaling parameters and are the parameters that fit the NYT polls and is a time delay between the Twitter opinion and the polls. The moving window average of days converts fluctuating daily data into a smooth trend that can be compared with the NYT smooth time series aggregated over many polls performed over several days. We use a backward window average to ensure that no data from the future is used. Note that a backward moving average induces an artificial backward time shift of (see Methods 3.4) so that the full time shift between the Twitter time-series and the NYT polls that we report below is given by .
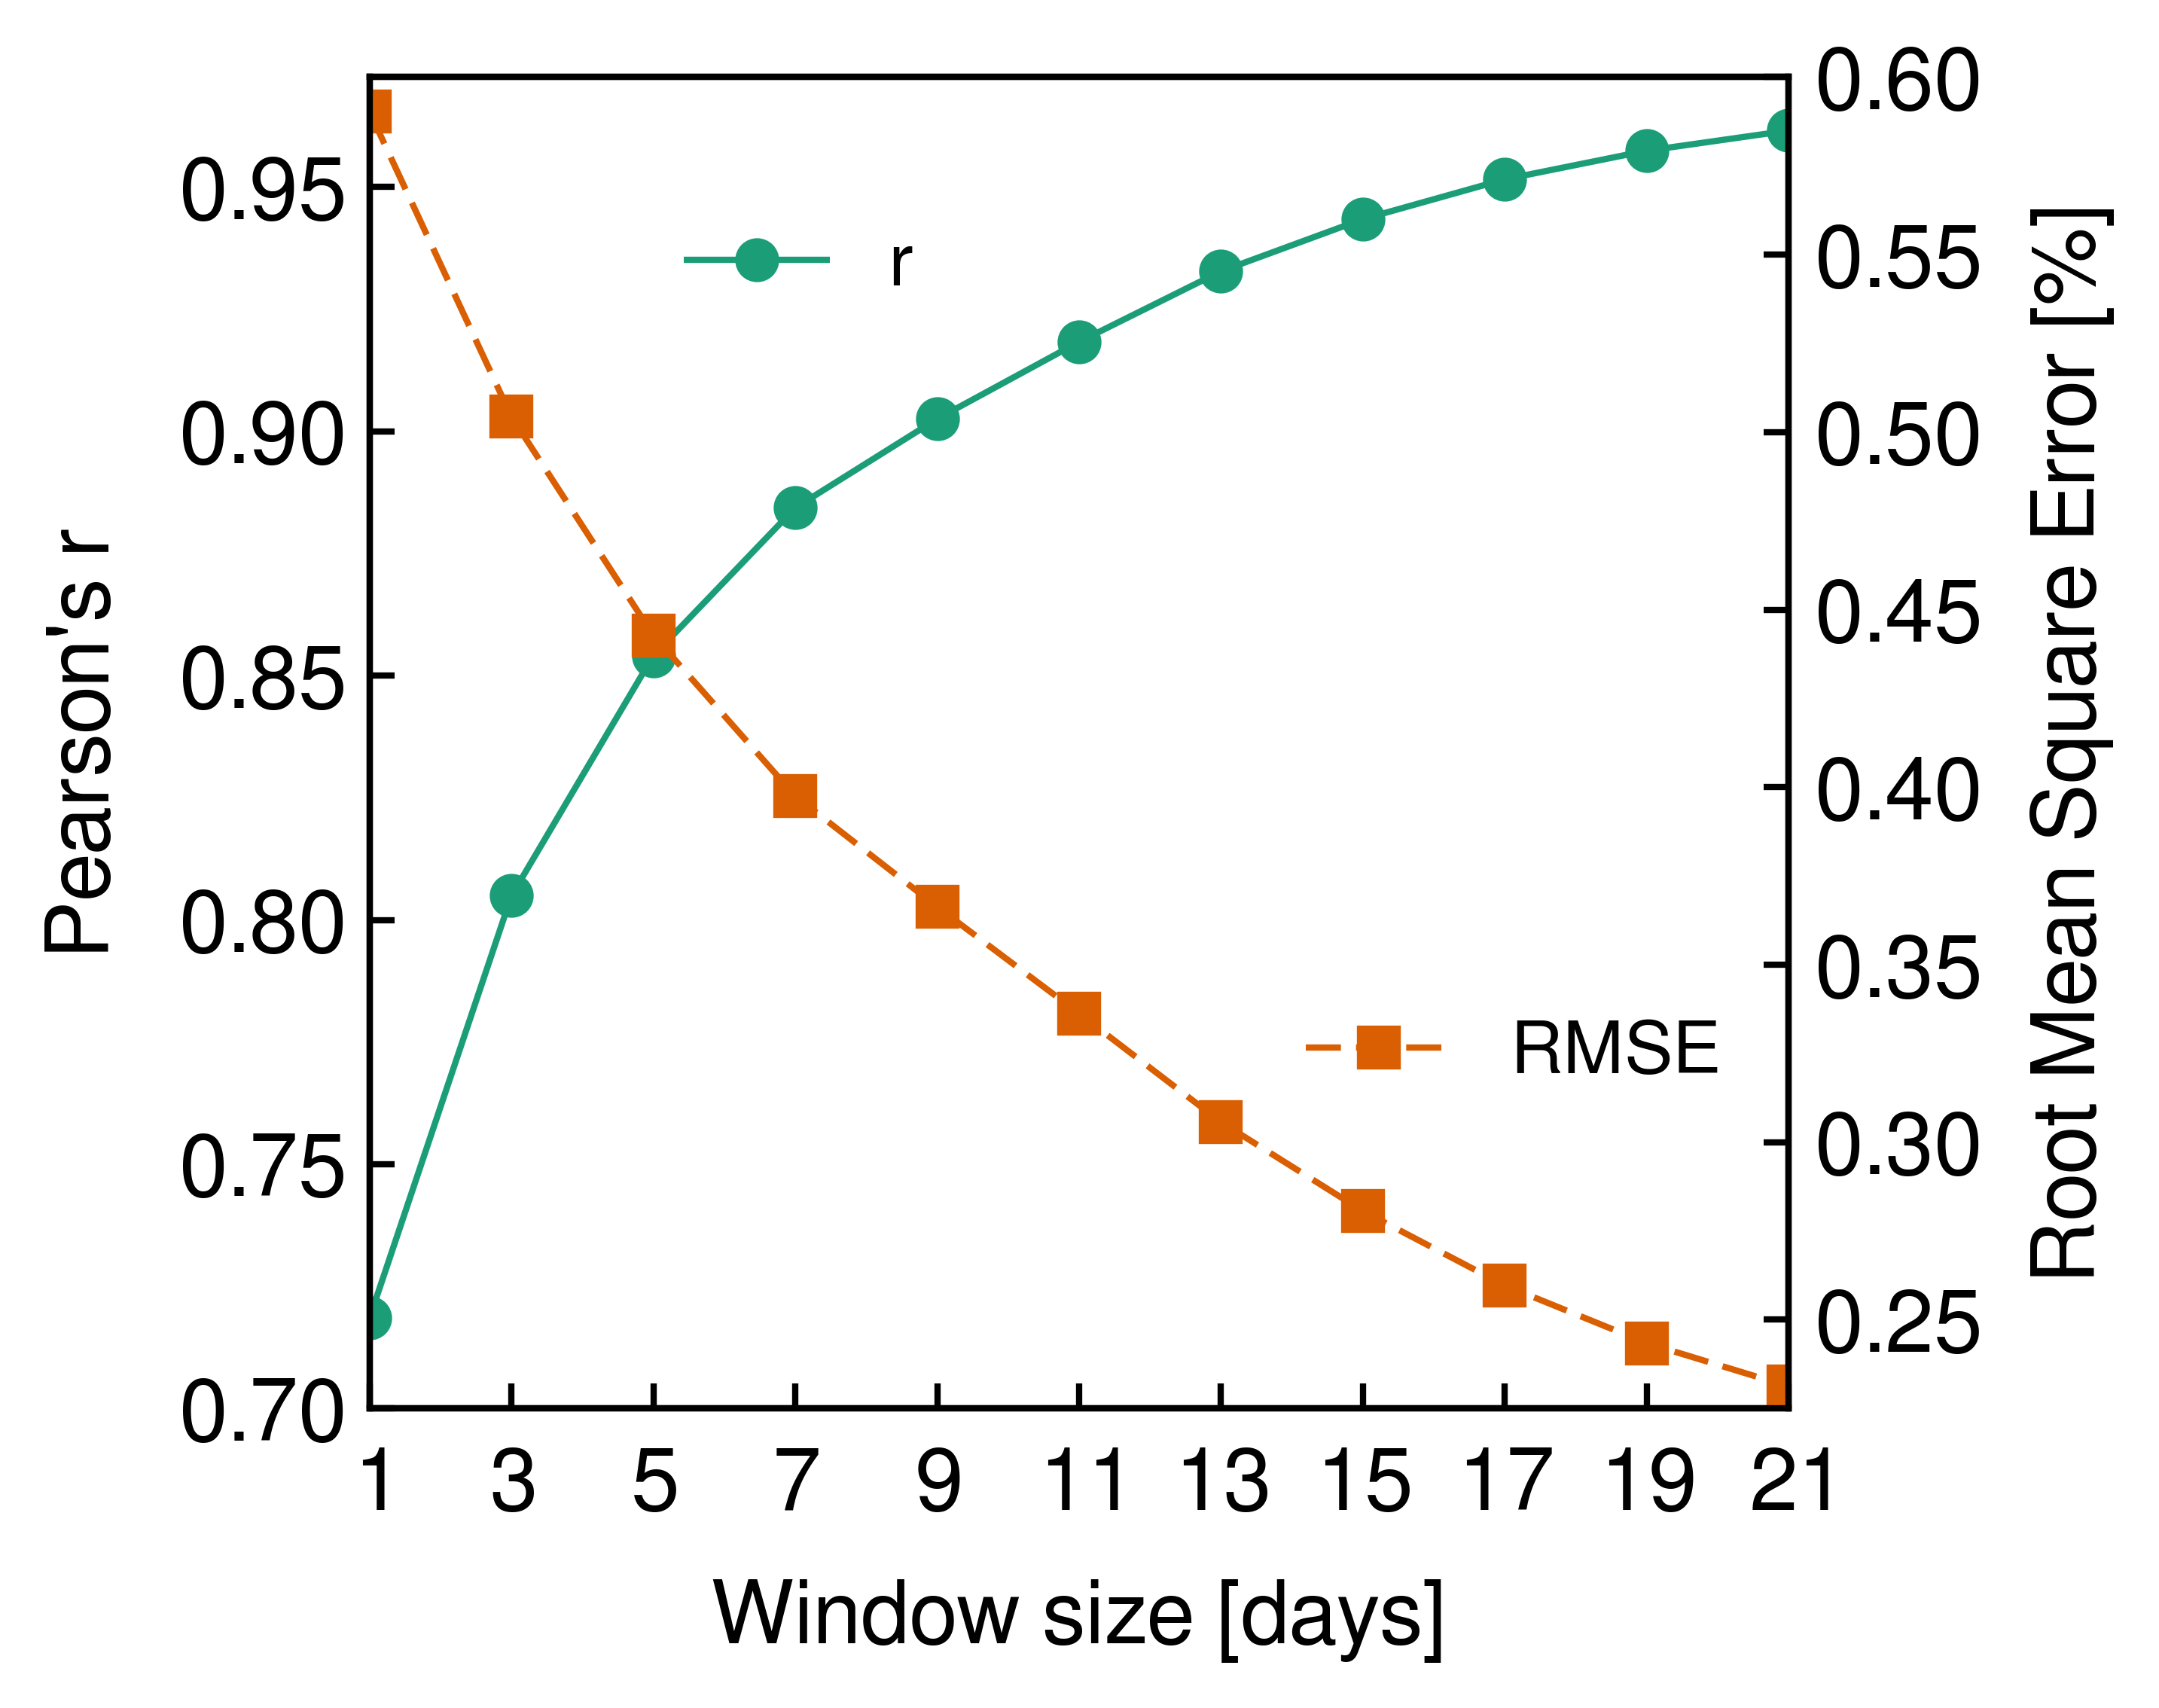
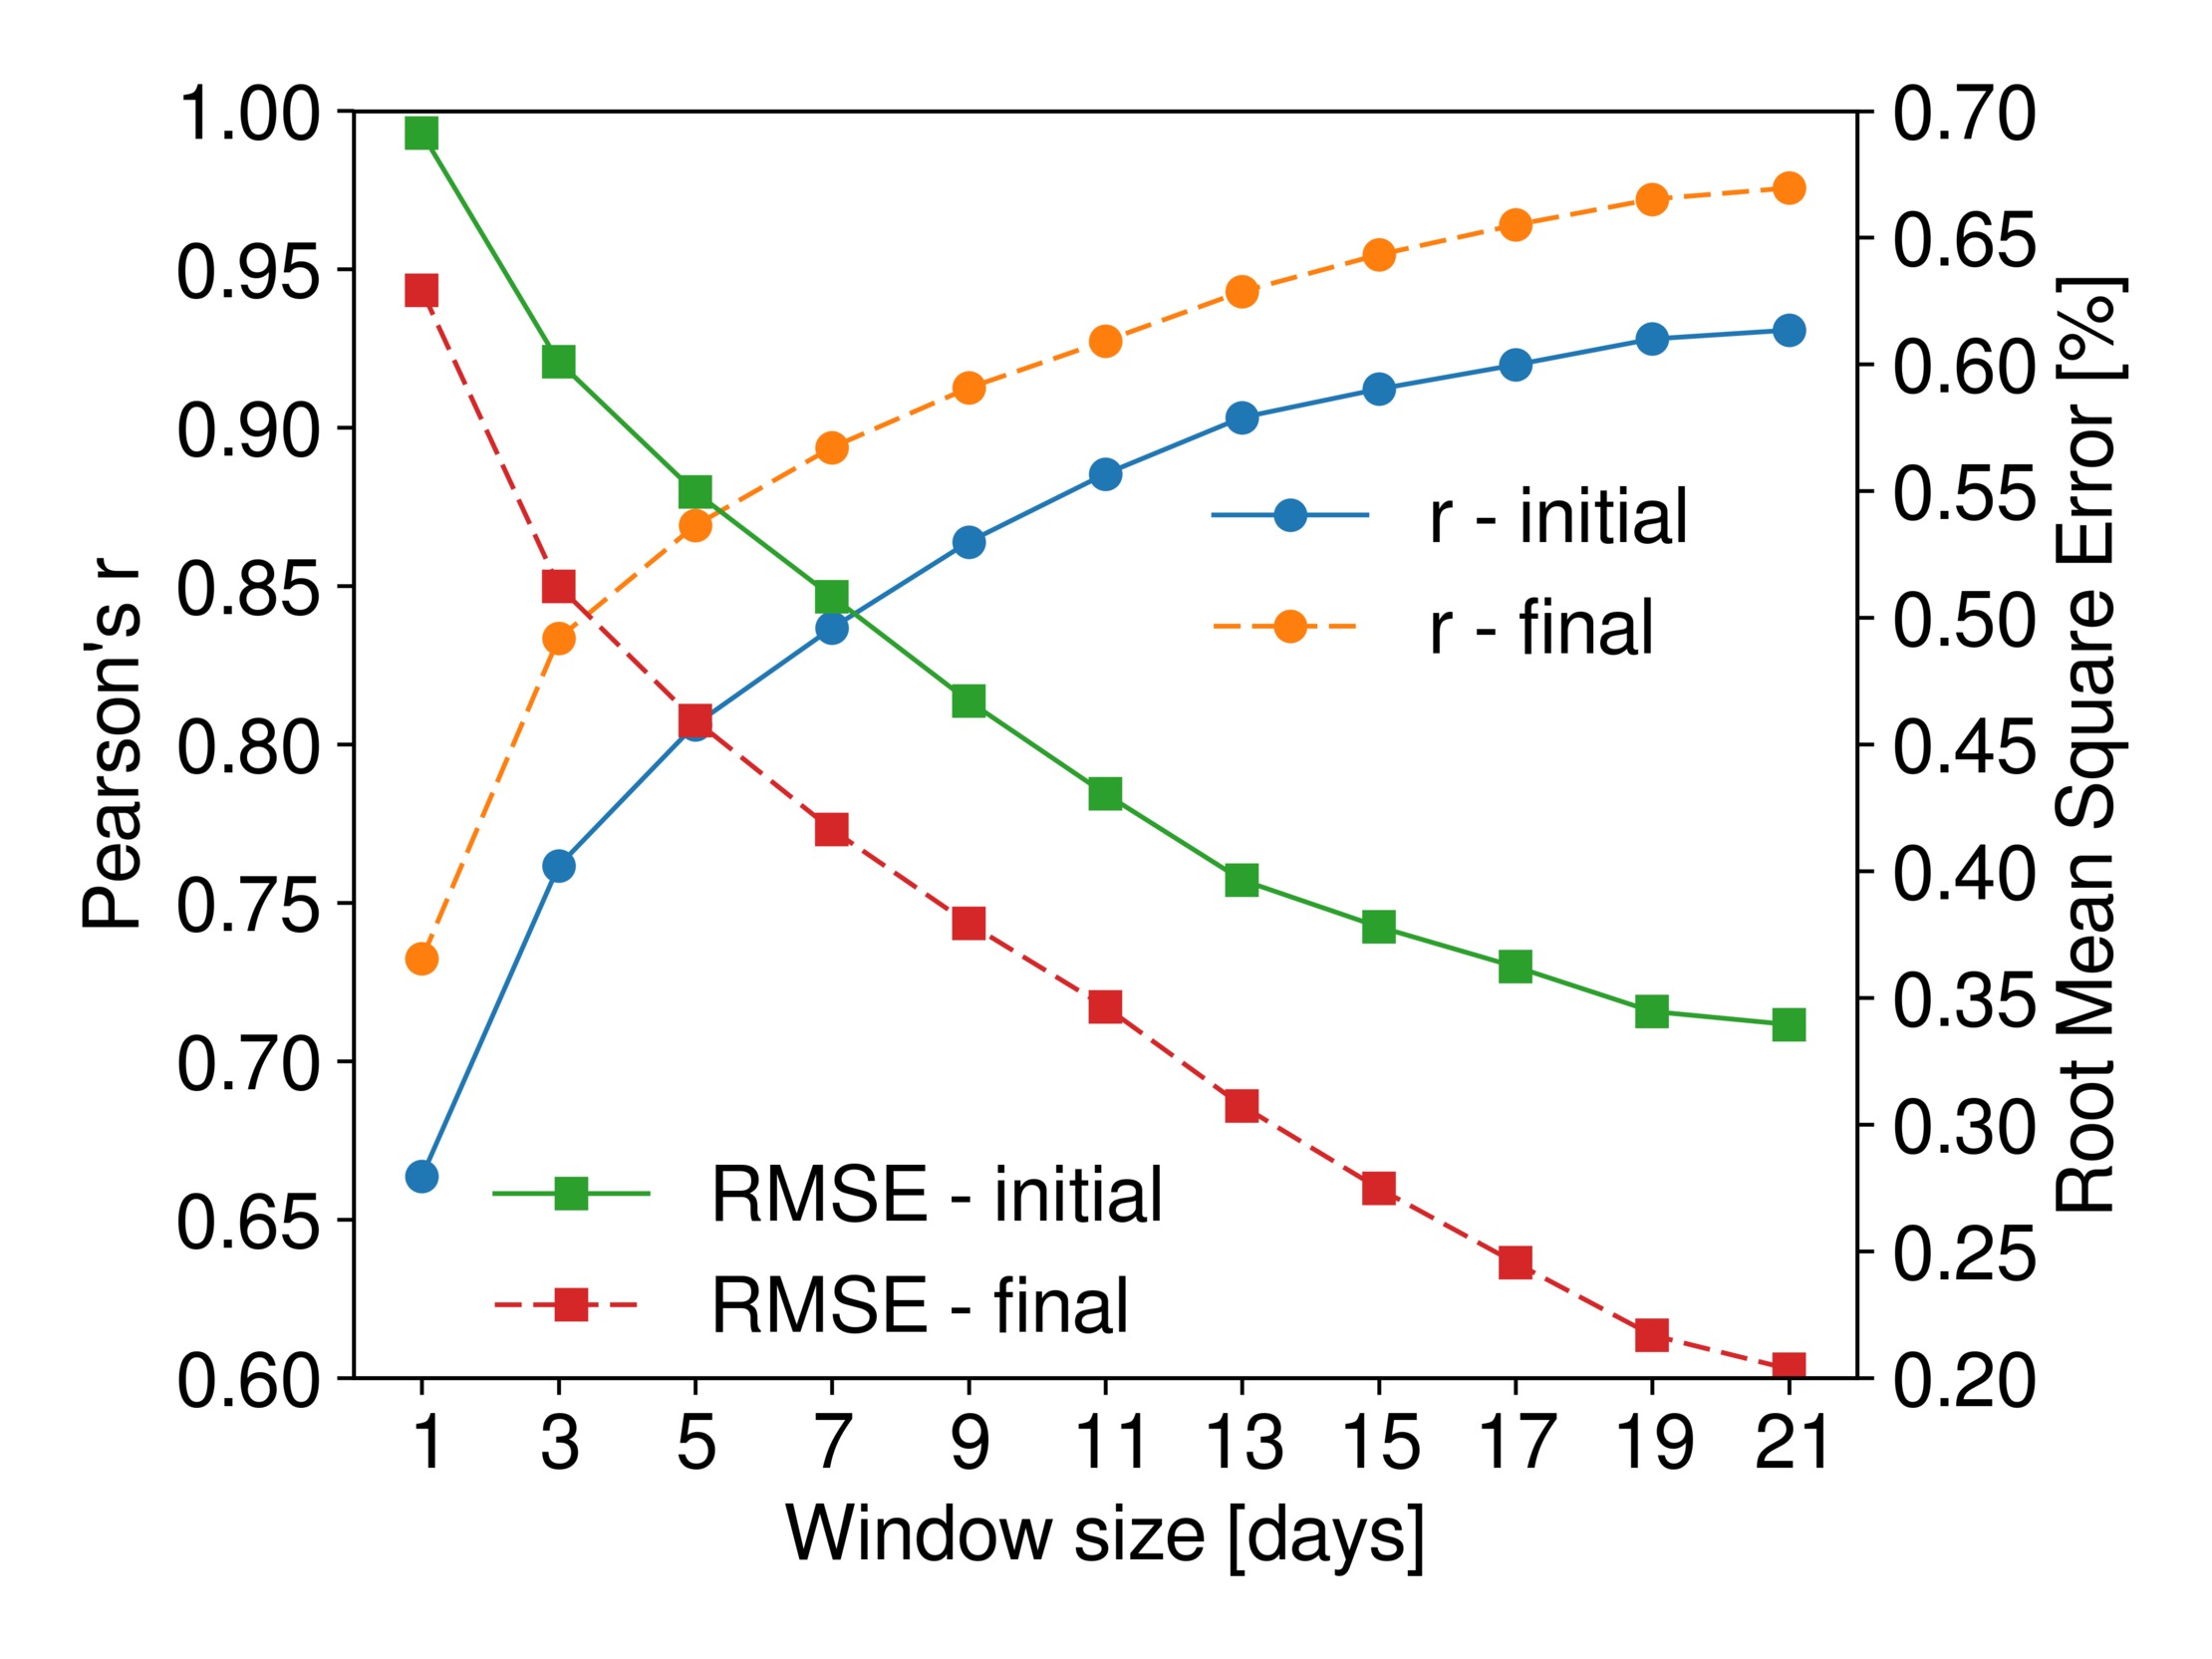
Figure 6 shows the fit using a window averaging of the Twitter data of 13 days. The constant parameters that provide the best fit in this case are , , days. The remarkable agreement of the fit is characterized by a Pearson product-moment correlation coefficient and a root-mean-square error of RMSE = 0.31 %, expressed in percentage points of the NYT polls. Using longer window average length increases the quality of the fit as shown in Fig. 7 displaying the root-mean-square error expressed in percentage points of the NYT polls and the Pearson correlation coefficient of the fit as a function of the moving average window length .
It is important to note that Twitter data cannot predict the exact percentage of supporters to each
candidate in the general population due to the uncertainty about the
number of voters that do not express their opinion on Twitter and
about the number of users that are undecided and are not classified by
our machine learning.
However, it is more important to capture the
trend of both candidates’ popularity in respect to each other,
which is obtained from Twitter. Even if Twitter may not provide the
exact percentage of support for each candidate nationwide, the
relevant relative opinion trend is fully captured by Twitter with
precision. Furthermore, the important parameter is , the time
delay between the anticipated opinion trend in Twitter and the delayed
response captured by the NYT population at large.
We find that this delay time is independent from the actual
value of the popularity of each candidate and from the length of the
window average.
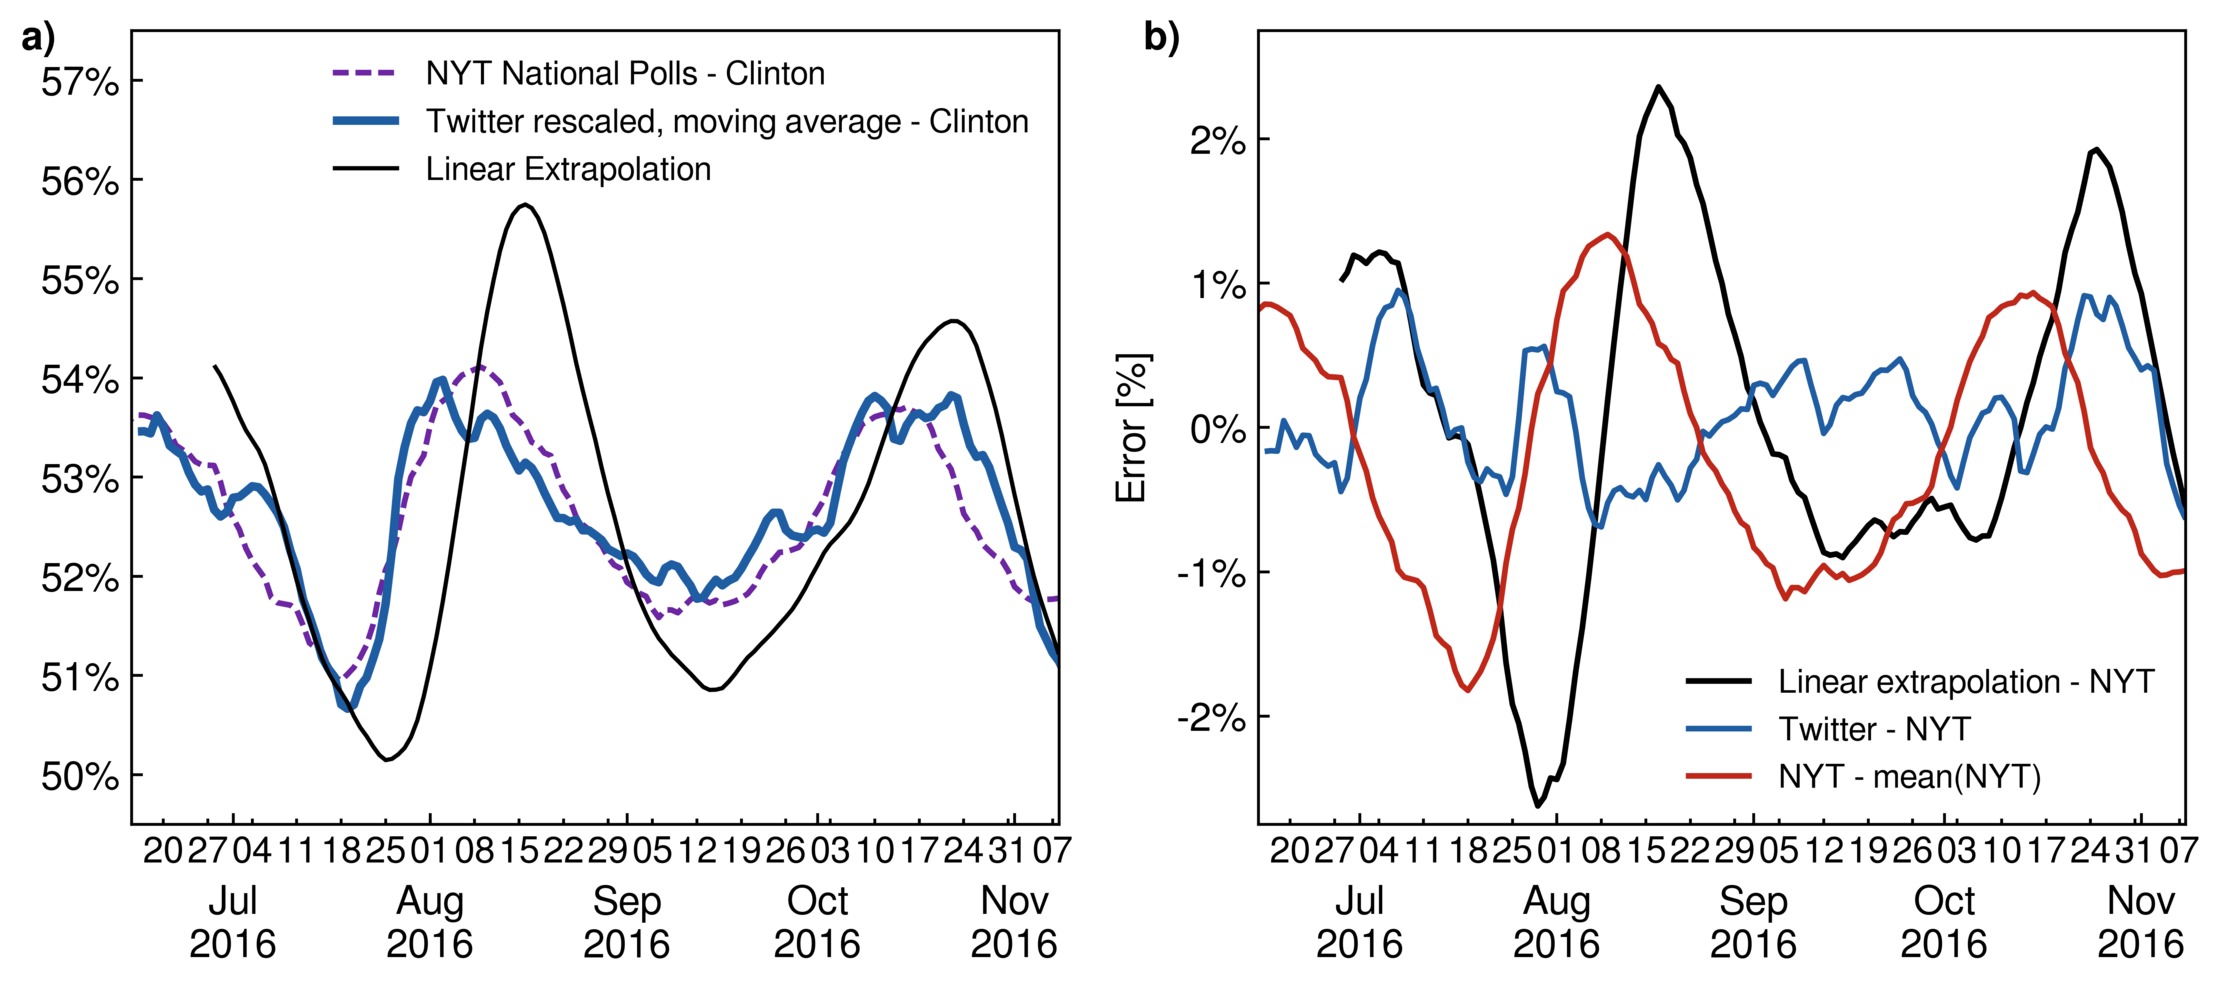
Next, we investigate how well our Twitter opinion trend can predict the NYT National Polling Average. Using the best fitting parameters to predict the NYT Polls from our Twitter opinion in a post hoc manner is a flawed approach since it requires knowing the entire time series. To remedy this issue and correctly test the predictive power of our Twitter analysis, we train our entire model, i.e. we train our classifier using tweets labeled with hashtags found with the hashtag co-occurrence network, compute the daily ratio of users in favor of each candidate and find the parameters , and that best fit the NYT polls, using only the portion of our data ranging from June 1st until September 1st. We then classify with the rest of the tweets the pre-trained classifier and keep the same fitting parameters to compare our Twitter trend with the NYT polls until election day on November 8th. We take advantage of the fact that the Twitter opinion time series precedes the NYT polls by several days to predict future values of the NYT polls using only data from the past. We compare this results with a straightforward extrapolation in time of the NYT polls from a linear regression on the last three weeks of the polls, as in Beauchamp[35], and constant extrapolation using the mean value of the polls during the training period.
Training our model only on the first three months, the time delay giving the best fit is days. We use our Twitter trend smoothed with a 9 days backward moving average to predict the polls 7 days into the future (see Methods). We find that our Twitter opinion predicts the NYT polls with better accuracy, i.e. a smaller root-mean-square error (RMSE), than a straightforward linear extrapolation and a simple constant extrapolation using the mean value of the polls (see Fig 8). Predicting the polls 7 days in advance, we find that the Twitter prediction reduces the RMSE by 52% compared to the constant extrapolation and by 66% compared to the linear extrapolation. The prediction error of the different methods are displayed in Fig. 8b. Even more importantly, our Twitter opinion is particularly better than the linear extrapolation to predict rapid changes in the polls as seen in Fig. 8a which shows the prediction from Twitter along with the result of the linear extrapolation. Although the linear extrapolation unsurprisingly predict relatively well the polls when they undergo small variations, when the polls experience a trend reversal, the Twitter prediction accurately predict it while the linear extrapolation misses it. The ability of our method to predict the polls during more than two months without reusing the polls to retrain our model, serves as a additional validation of the opinion we measure in Twitter.
1.6 Analysis of Twitter supporter behavior
We showed that the variations of opinion measured in Twitter are in very good agreement with the variations of relative opinion in the NYT National Polling average, and, as for the NYT polls, the majority in Twitter is in favor of Hillary Clinton. However, traditional polls generally failed at predicting the outcome of the 2016 presidential election. An interesting question that arises is then: is there any warning signals in the Twitter data that allows us to predict in advance that there could be a surprising result at the election day?
Here, we show that
analyzing the behavior of supporters in Twitter can be used to detect
such problems. This analysis is not accessible to traditional polling
and, given the agreement between Twitter and traditional polls, might
serve as a warning for a possible similar problem in
traditional polls and their subsequent failure to predict the elections.
Firstly, in addition to measuring the daily opinion, we measure the
opinion of the entire population of Twitter users whose tweets we
collected over the period going from June 1st until November 8th,
something not possible for the majority of traditional polls. That
is, using all the tweets in our dataset posted by a users over the
entire observation period, we classify each users according to camp in
which the majority of his/her tweets is classified. This
calculation contrast to the one employed by polls, which can track
only a sample population at a given time. In this cumulative count,
each user is only counted once, while in the daily count, a user is
counted every day she/he expresses her/his opinion in Twitter. Considering
this cumulative count, we find that a large majority of users, 64%,
is in favor of Hillary Clinton while 28% are in favor of Donald Trump
and 8% are unclassified as they have the same number of tweets in
each camp.
The prediction of the cumulative count contrasts with the prediction of the
daily count.
The average of the daily opinion over the same period
(Fig. 5) amount to 55% for Hillary Clinton versus 40%
for Donald Trump (5% unclassified). Such a large difference between
the daily and the cumulative ratios of supporters is our first warning
signal indicating a problem in the representation of both supporters
in Twitter. Indeed, looking at the activity of users in both camps we
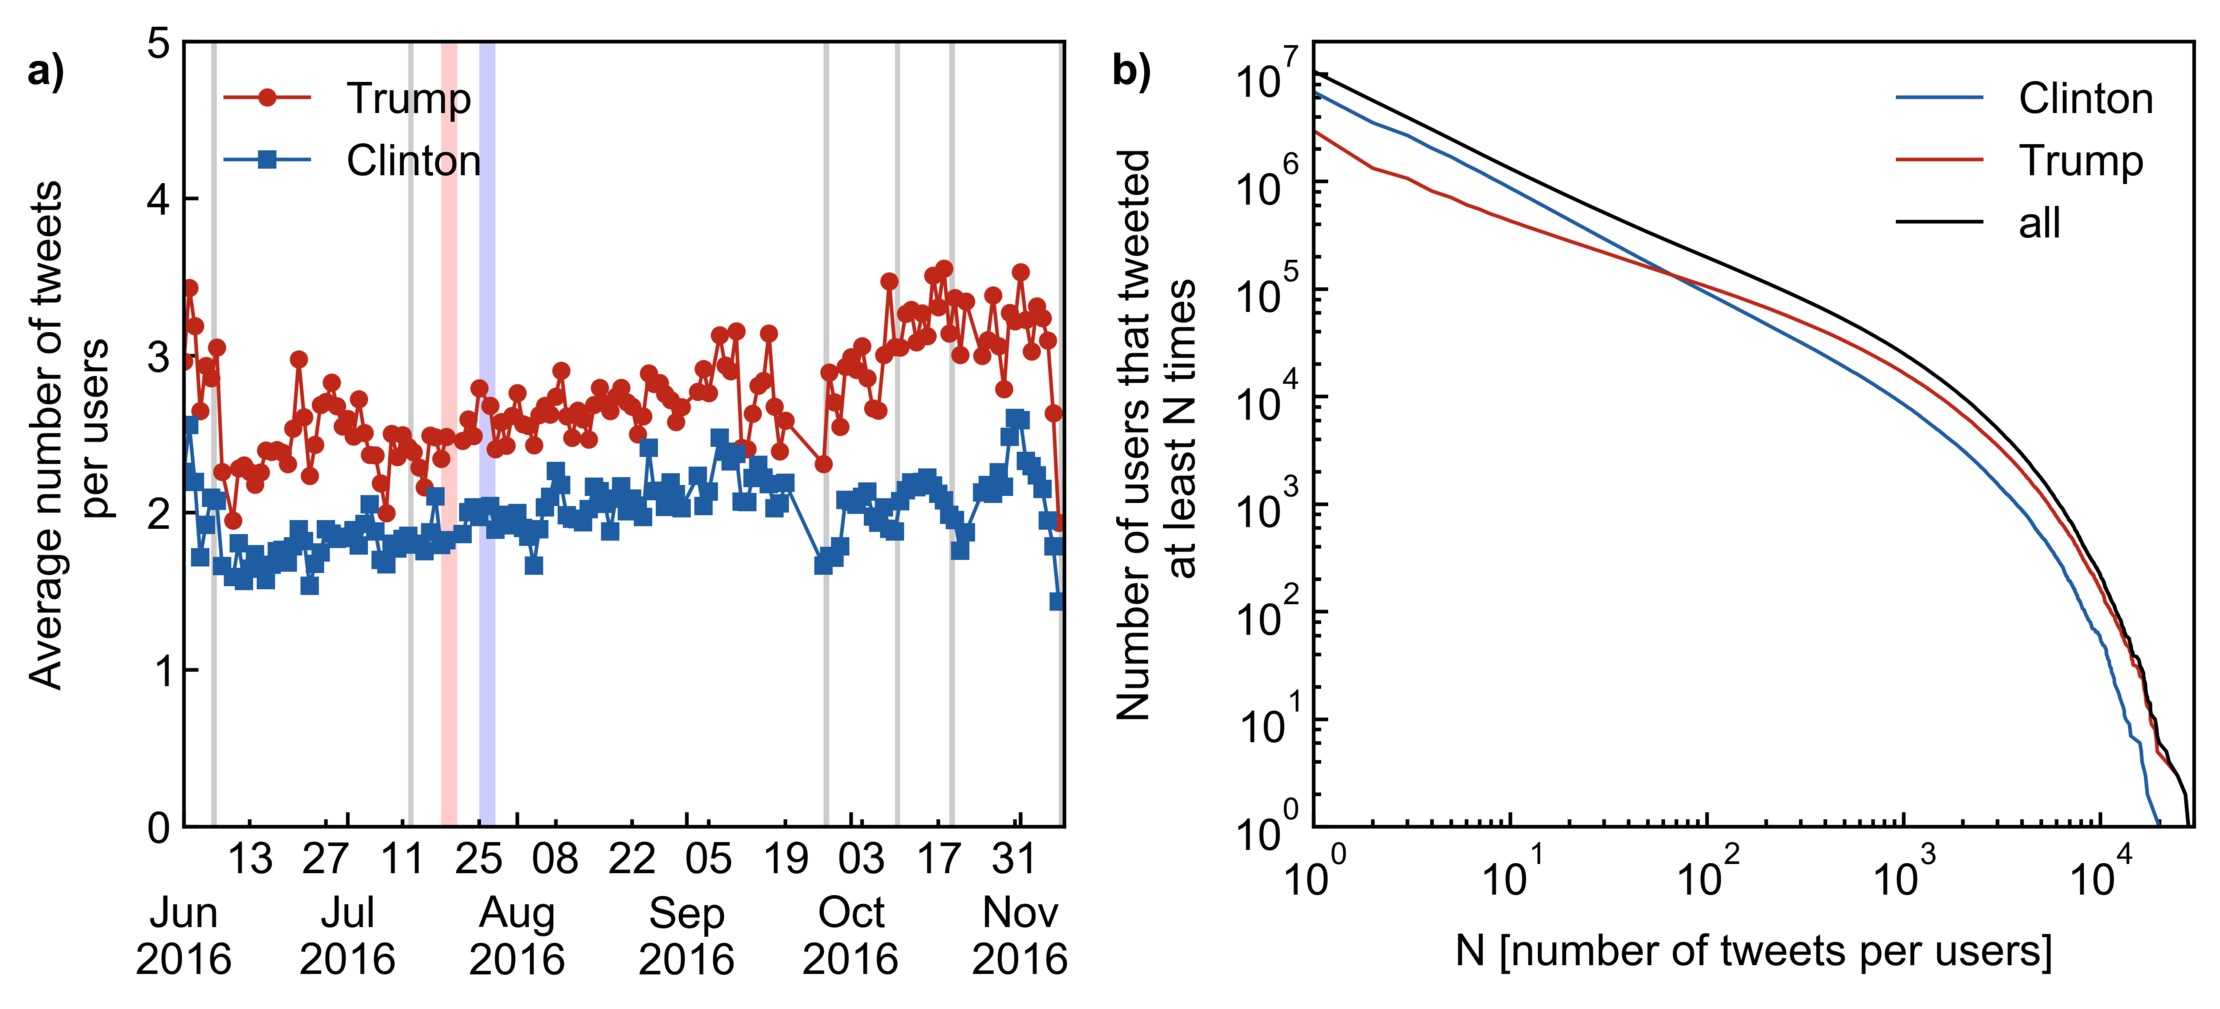
see that Trump supporters are, in average, much more active. Figure
9a shows the daily average of tweets per users in
each camp. Clinton supporters tweet in average 2.6 times per day
while Trump supporters tweet in average 3.9 times per day and their
activity increases to almost 6 tweets per day during the period of the
presidential debates.
The cumulative distribution of the number of times a user tweets for
each camp (Fig. 9a) reveal a clear difference in the
activity profiles of supporters of each camps. While both
distributions follow a power-law form with a soft cut-off starting
around 1000 tweets per users, the distribution of Trump users shows a
less steeper slope than the one for Clinton supporters revealing
that Trump supporters are generally characterized by a larger activity
and that a small number of Trump supporters have a extremely high
activity. Figure 9b shows that by considering only
users for which we collected at least 67 tweets during the entire
observation period, the advantage tilts in favor of Donald Trump.
This discrepancy in activity between supporters is also apparent
in the structure of the social network where the strongly connected
giant component, which show less size fluctuations than the other
components and is mainly comprised of recurring users, is dominated by
Trump supporters (Fig. 4) in clear opposition to the entire dataset
(Fig. 5).
A second observation available from our Twitter analysis that is not available to traditional pollsters is the difference in the dynamics of supporters of each camp. Figure 5a shows that the daily number of Trump supporters fluctuates less than the number of Clinton supporters. We find that where is the standard deviation of the daily number of users in favor of user . Trump supporters show a more constant supports while Clinton supporters show their supports mainly when important events occurs, leading to larger fluctuations in their daily absolute number. To understand the impact of these different behaviors on the value of the ratio of users in favor of each candidate, we evaluate Spearman’s rank correlation coefficients between the daily value of the absolute number of users in favor of a candidate (Fig. 5a) and the ratio of user in favor of the same candidate (Fig. 5b). We find a value of for Clinton supporters and . This results in the important fact that the relative variations of the daily opinion that we measure on Twitter (Fig. 5b), which agrees with the NYT polling average, are mainly explained by the variation of the support of Clinton supporters and almost not by the variation of the support of Trump users. Moreover, the negative value of indicates that a positive fluctuation in the number of Trump supporters is generally correlated with even larger increase in the number of Clinton supporters. This analysis shows how opinion trends measured in Twitter can be understood as the results of the dynamics of the different supporters camp. The opinion trend mainly reflect the daily fluctuations of the Hillary supporters coming in and out of the sampled population and misses the response of Trump supporters. As our Twitter opinion correlates very well with the traditional polls, it can be interpreted as a warning for similar demographic problems in the traditional polls.
1.7 Benchmark with other Twitter-based metrics
Here we compare the performance of our method with the approaches used previously. Similarly to the approach we used to fit our Twitter opinion time series to the normalized NYT national polling average scores of the two main candidates, we build metrics for each approach , where represent the candidate ( for Clinton and for Trump), such that for each day . Since the metrics are complementary in respect to each candidate, we only need to compare the metric for one candidate with the poll scores of the same candidate.
The first approach consists in simply counting the number of users mentioning each candidate per day. This approach used by many authors(e.g. [10, 11, 19, 21, 29, 25]) is generally thought to measure attention toward a candidate rather than opinion[20, 29]. O’Connor et al.[10] reported a correlation of between the number of tweets per day (using a 15 days window average) mentioning Barack Obama and his score in the polls during the 2008 US Presidential elections. However, the authors found that the McCain 15-day mention volume also correlated to higher Obama ratings. Jungherr et al.[29] reported correlations between the number of mentions per day of different parties and their polls scores during the 2013 German federal elections. The largest correlation being for the party “Alternative für Deutschland” (with a time lag of 1 day between the polls and the Twitter metric). We compare the time series given by
| (2) |
where is the number of users mentioning candidate during day , with the normalized poll score of Hillary Clinton. We use the keywords donald, trump, donaldtrump and realdonaldtrump to count mentions of Donald Trump and hillary, clinton and hillaryclinton for mentions of Hillary Clinton.
The second metrics we use consists of adding a sentiment analysis to the mention counts. This approach has also been wildly used (e.g. [10, 12, 13, 17, 34, 29, 25]) by inferring the sentiment of a tweets using lexicons[10, 17, 25] or supervised-learning[13, 34]. O’Connor et al.[10] reported a smaller correlation for Obama taking into account sentiment () compared to just counting mentions and a correlation of for the sentiment of the keyword jobs with the time series of the consumer confidence (using a 15 days window average). For comparing with the polls, we define the metrics
| (3) |
where is the number of users that mentioned candidate in a tweet with sentiment . To infer the sentiment of a tweet we trained a classifier on a training set comprising tweets from our datasets with positive and negative emoticons and emojis. This is similar to the method used in Ref. [13]. We use supervised learning instead of a lexicon based approach due to the poor performance of such approach on the informal text of tweets[33]. We use a tweet-level classification instead of an approach allowing to infer directly the aggregated tweet sentiment values[46, 34, 37] in order to be able to compute the user ratio in each camp, required to compare with our results.
The third metrics we consider is derived from the number of hashtags referring to the candidates. We define the metric as
| (4) |
where , respectively , is the number of users using at least one hashtag in favor of, respectively in opposition to, candidate during day . To represent each category, we use hashtags chosen among the top used hashtags: #MAGA for pro-Trump, #ImWithHer for pro-Clinton, #NeverTrump for anti-Trump and #NeverHillary for anti-Clinton. This set is the same set that we used as a seed in the co-occurrence hashtag network for our hashtag discovery algorithm (see Methods). By counting hashtags and hashtags with positive or negative values a party, Jungherr et al.[29] reported a maximum absolute correlation of for the party “Die Grüne” during the German 2013 federal elections (with a negative lag of 1 day between the polls and the Twitter time series).
Figure 10 shows the results of the three time series obtained with these metrics, along with the result of our Twitter opinion time series, using a moving window average of 13 days in each case.
In all cases, the quality of the agreement that we find using our analytics, as expressed in Fig. 10, between the national polls and Twitter trends is superior to previous approaches.
The other methods benchmarked agree poorly with the National Polls, and, as can be seen in Fig. 10. This evidence shows that the opinion in Twitter is different than the attention, which is what was measured in previous studies[10, 13, 17, 34, 29]. These results confirm the importance of correctly measuring opinion in Twitter by assessing the supports of each user, something we achieve using a new method utilizing supervised machine learning with an in-domain training set of 1 million tweets built from the hashtags carrying an opinion.
2 Discussion
Using Twitter as a sensor for political opinion has attracted enormous attention because there is a general sense that digital data may, at some point by the virtue of reaching much larger populations, outdate more traditional approaches to polls, which is of interest to social science and beyond. Indeed, there has been many contributions in journals[11, 14, 20, 21, 24, 23, 34, 37, 38, 35] and, in social computing conferences[10, 47, 12, 13, 15, 18, 19, 17, 16, 22, 25, 26, 27] dealing with public opinion and political processes in Twitter (see also the Science Issue 6324 (February 03, 2017) on “Prediction” [48, 49]).
The new method111available at kcorelab.com we present uses a combination of statistical physics of complex networks, natural language processing and machine learning to uncover the opinion of Twitter users and to analyze their behavior giving unique insights into the reason for the observed opinion variations. We find a remarkably high correlation between our measured Twitter opinion trends and the New York Times polling national average. The opinion trend in Twitter is instantaneous and anticipates the NYT aggregated surveys by 10 days. We show that using our Twitter opinion trend can be used for nowcasting[38] the results of the NYT national polls 7 days in advance with better accuracy then using a linear extrapolation of the polls, in particular during abrupt trend reversals. This suggests that Twitter can be used as an early warning signal of global opinion trends happening in the general population at the country level.
Our findings demonstrate that measuring the attention
toward candidates does not allow to differentiate the political
support toward each candidate. Indeed, a comparison with previously
proposed methods[10, 13, 17, 29]
based on the ratio of users mentioning each candidate show a worse agreement
with the NYT polling average than our Twitter opinion,
even when sentiment analysis is used to classify
tweets as positive or negative or when hashtags are used to classify users
(see Fig. 10).
However, the general failure of traditional polls and Twitter’s opinion to predict the victory of Donald Trump raises the question of whether Twitter can provide insights into this issue not accessible to traditional polls. In this regards, we showed the necessity of understanding the impact of the difference in activity of each supporters group on the final opinion trend to correctly interpret it. Our results reveal a difference in the behavior of Twitter users supporting Donald Trump and users supporting Hillary Clinton. Peaks in the opinion in favor of Clinton are highly correlated with large positive fluctuations in the daily number of Clinton supporters and coincide with important events such as the conventions or the presidential debates. On the other hand, peaks in favor of Trump correspond to a lack of mobilization of Clinton supporters. Although Clinton supporters are the majority in Twitter, Trump supporters are generally more active and more constant in their support, while Clinton supporters are less active and show their support only occasionally. This dichotomy is also visible in the user network dynamics. The strongly connected giant component (SCGC), dominated by Trump supporters, shows only small size fluctuations and comprises almost only recurring users, as opposed to the rest of the network, dominated by Clinton supporters, which shows large fluctuations and is where new users arrive. These findings confirm previous studies suggesting that right-wing leaning Twitter users exhibit greater levels of activity and more tightly interconnected social structure [50, 18]. We push these observations further by showing how these effects influence opinion measurement in Twitter. Indeed, our analysis show that Twitter’s opinion is mainly measuring the reaction of Clinton supporters and not of Trump supporters, suggesting that an important part of Trump supporters are missing. This indicates an important over-representation in the Twitter population of users expressing their opinion toward supporters of the Democratic party. Crucially, Twitter’s opinion variations agree remarkably well with the average of traditional national polls over a period of more than 5 months and consistently precedes it by 10 days. This suggests that the demographic imbalance responsible for Twitter’s opinion trend might also be present in the traditional polls. In this case, detecting such a difference in Twitter supporters behavior is a warning for traditional pollsters in the sense that it indicates when the polls cannot be trusted as representative of the national elections. This is perhaps the most crucial question that arose after the 2016 elections. While Twitter may not be able to predict the elections, we find that Twitter is able to raise clear warning signals that will allow pollsters, politicians and the general public in general to know in advance that the election day could be a big surprise.
Our results validate the use of our Twitter analytics machinery as a mean of assessing opinions about political elections and show the necessity of accompanying the Twitter opinion with an analysis of user activity in order to correctly interpret its variations. Our analysis comes at a fraction of the cost of traditional NYT polling methods employed by aggregating the whole of the US$ 18 billion-revenue market research and public opinion polling industry (NAICS 54191). In contrast to traditional unaggregated polling campaigns which are unscalable, typically ranging at most in the few thousand respondents, our techniques have the advantage of being highly scalable as they are only limited by the size of the underlying social networks. Moreover, traditional polling suffers from a declining rate of respondents being only 9% according to current estimates (2012) down from 36% in 1997[51], while social media is gaining billions of users worldwide. We note that a bias arises from the Twitter’s API[52, 33]. Although the demographics representation of Twitter is biased [53] and Twitter’s API introduces a supplementary unknown bias in our sample, Twitter allows to study the behavior of its users and to understand the link between their activity and the variations in opinion trend, something not accessible to traditional polls.
Provided a large usage of opinion-hashtags and
a polarization of opinion resulting in well separated
hashtag clusters, our approach can be extended to understand other
kind of trend from social media ranging from the opinion
of users regarding products and brands, to other political movements,
thus, unlocking the power of Twitter to understand trends in the society at large.
3 Methods
3.1 Data collection and social network reconstruction
We continuously collected tweets using the Twitter Search API from June 1st, 2016 to November 8th, 2016. We gather a total of 171 million tweets in the English language, mentioning the two top candidates from the Republican Party (Donald J. Trump) and Democratic Party (Hillary Clinton) by using two different queries with the following keywords: trump OR realdonaldtrump OR donaldtrump and hillary OR clinton OR hillaryclinton. During this period of 161 days, 15 days are missing due to connection errors. A more stringent keyword filtering of the dataset (see Fig. 12 of the Supplementary Information) showed no significant changes in our results and conclusions. To asses the importance of the possible noise in the data induced by the “trump” and “hillary” keywords, we filtered our dataset to keep only tweets with either one of the following keywords : ’realdonaldtrump’, ’hillaryclinton’, ’donaldtrump’ or at least one of the following pairs of keywords ’trump’ and ’donald’ or ’hillary’ and ’clinton’. Although this keyword filtering reduces the dataset from 158 millions tweets to 58 millions tweets (considering only tweets from official clients), our results are not significantly changed, as shown in Fig. 12 in the Supplementary Information, and our conclusions still hold.
For every day in our dataset, we construct the social network where is the set of vertices representing users and is the set of edges representing interactions between the users. In this network, edges are directed and represent influence. When a user , retweets, replies to, mentions or quotes any other user , a directed edge is drawn from to . We remove Donald Trump (@realdonaldtrump) and Hillary Clinton (@hillaryclinton) from the network, as we are interested by the opinion and dynamics of the rest of the network. We divide the network in three compartments: the strongly connected giant component (SCGC), the weakly connected giant component (WCGC) and the corona (Fig. 2). The SCGC is defined as the largest maximal set of nodes where there exists a path in both directions between each pair of nodes. The SCGC is formed by the central, most densely connected region of the network where the influencers are located, and where the interactions between users are numerous. The WCGC is the largest maximal set of nodes where there exists a path in at least one direction between each pair of nodes. The corona is formed by the smaller components of remaining users and the users that were only connected to Hillary Clinton or Donald Trump official accounts, which were removed for consistency. Users that do not interact with anyone else are not counted in the network, although we take them into account when computing the opinion of the entire dataset (see Fig. 5).
3.2 Hashtag classification
We split our dataset in two parts. The first part, from June 1st to September 1st, covers the two conventions and the second part, from September 1st to November 8th, covers the three presidential debates until election day. This allows us to decrease the computational time, verify the consistency of our results and evaluate the predictive quality of our model by training it only on the first part of our dataset and evaluating it on the second part (see Section 1.5).
We build a labeled training set of tweets with explicit opinion about the two presidential candidates by taking advantage of the fact that a large number of Twitter users label their own tweets by using hashtags. The use of a hashtag that explicitly expresses an opinion in a tweet represents a “cost” in terms of self-exposition by Twitter users[34] and therefore allows one to select tweets that clearly state support or opposition to the candidates.
Our first task is therefore to classify the hashtags present in our dataset as expressing support or opposition to one of the candidate. For this purpose, we start by identifying the most important hashtags in term of their total number of occurrences and then use the relations between hashtags co-occurring in tweets to discover new hashtags.
| Hashtag | Number of occurrences |
|---|---|
| trump | 2240499 |
| trump2016 | 1320217 |
| maga | 1139644 |
| hillary | 905065 |
| hillaryclinton | 718159 |
| imwithher | 690519 |
| trumptrain | 654573 |
| neverhillary | 634562 |
| demsinphilly | 627446 |
| nevertrump | 560876 |
| tcot | 531389 |
| rncincle | 498718 |
| trumppence16 | 473924 |
| donaldtrump | 409708 |
| crookedhillary | 396836 |
Among the top occurring hashtags (shown in Tab. 1), we identify four hashtags each representing a different category: #maga for pro-Trump (maga is the abbreviation of the official Trump campaign slogan: Make America Great Again , #imwithher for pro-Hillary (the official Clinton campaign slogan), #nevertrump for anti-Trump and #neverhillary for anti-Clinton.
We then construct the hashtag co-occurrence network , where the set of vertices represents hashtags, and an edge is drawn between and if they appear together in a tweet. For the period going from June 1st until September 1st, the resulting graph has 83,159 vertices and 589,566 edges.
Following reference [54], we test the statistical significance of each edge by computing the probability (-value of the null hypothesis) to observe the corresponding number of co-occurrences by chance knowing the number of occurrences and of the vertices and , and the total number of tweets . We keep only significant edges satisfying , where , effectively filtering out spurious relations between hashtags. Finally, a weight representing the significance of the relation between two hashtags is assigned to each edge. Retaining only significant edges and considering only the largest component of the filtered graph, reduces the graph to 8,299 vertices and 26,429 edges.
Using a method inspired by the method of label propagation [43], we use the resulting co-occurrence network to discover hashtags that are significantly related to the hashtags initially chosen to represents the different classes. We simplify the hashtag classification problem by considering only two classes: for the hashtags pro-Clinton or anti-Trump and for the hashtags pro-Trump or anti-Clinton. Starting from the initial set of hashtags, we infer the class of their neighbors by verifying the following condition: if
| (5) |
is assigned to . Similarly, if
| (6) |
is assigned to .
We then further filter the new hashtags by keeping only hashtags having a number of occurrences where is the number of occurrences of the hashtag associated with vertex , is the class to which belong and is a threshold parameter that we set to . Finally, a human validation among the new hashtags is performed to only add hashtags that are direct reference to the candidate, its party or slogans of the candidate and that express an opinion. Table 2 shows example of this manual selection.
| Associated with | Added to | Associated with | Added to |
|---|---|---|---|
| vote | strongertogether | radicalislam | trumptrain |
| republican | donthecon | ccot | trumppence16 |
| america | voteblue | corruption | votetrump |
| hillaryclinton | dumptrump | ryan | hillno |
| real | hillary2016 | fbi | handcuffhillary |
| racist | uniteblue | hillary | imnotwithher |
| p2 | clintonkaine2016 | tcot | votetrump2016 |
| veep | hillyes | jobs | crookedhillary |
| trumpuniversity | nevertrumppence | tcot | hillaryforprison |
| kkk | chickentrump | scotus | maga |
This entire process is then repeated adding the newly selected hashtags to each class and propagating the selection to their neighbors. After each iteration we also verify the consistency of the classes by removing hashtags that do no longer satisfy Eqs. (5) and (6).
After three iterations of this process, we find a stable set of hashtags represented in Fig. 3. Applying a community detection algorithm[43, 44] to the final network found with our method results in four different clusters corresponding to the Pro-Clinton, Anti-Clinton, Pro-Trump and Anti-Trump hashtags as shown in Fig. 3. This shows that our resulting classes are well separated and correspond to the partition of the network maximizing Newman’s modularity. The full set of hashtags is given in the Supplementary Information (Tables 4 and 5).
As a robustness check, we study how the predictions using the full set of tweets compares with that using the initial seed set of hashtags to train the supervised model. Using the final set of hashtags instead of the initial set increases the agreement between the Twitter opinion trend and the NYT national polling average (see Fig. 14 of the Supplementary Information). The improvement of the classification is also revealed by the larger classification scores obtained with the final set of hashtags (see Tab. 3). For example, when using a window length of 13 days, the Pearson correlation coefficient increases from to and the root-mean-square error decreases from RMSE = 0.40% to RMSE = 0.31%. The classification improvement in -score increases from to .
To asses the robustness of the manual selection of hashtags, we perform our daily classification of users using as a basis for our training set of hashtags three sets, each with a different random sample containing only 90% of our final sets of hashtags. We find that it slightly affect the final daily classification of users with a root-mean-square deviation of 2.7% between the ratio of users in each camp using the reduced sets of hashtags and the full set of hashtags (see Fig. 13 of the Supplementary Information). This indicates that our method is robust against significant (10%) variation in the manual selection of hashtags.
3.3 Opinion mining
We build a training set of labeled tweets with two classes: 1) pro-Clinton or anti-Trump and, 2) pro-Trump or anti-Clinton. We discard tweets belonging to the both classes simultaneously to avoid ambiguous tweets. We also remove retweets to avoid duplicates in our training set. We select only tweets that were posted using an official Twitter client in order to discard tweets that might originate from bots and to limit the number of tweets posted from professional accounts. We use a balanced set, with the same number of tweets in each class, totaling 835,808 tweets for the first part of our dataset and 682,508 tweets for the second part. The tweet contents is tokenized to extract a list of words, hashtags, usernames, emoticons and urls. The hashtags used for labeling are striped off from the tweets and the other hashtags are kept as they may contain significant information about the opinion of the tweet. We also keep the urls as features since they usually point to resources determining the opinion of the tweet. Moreover, replacing all urls by the token “URL” (creating an equivalent class) resulted in smaller classification score. We use the presence of unigrams and bigrams as features. We find 3.5 million features for the first part of our dataset and 3.1 million for the second part. The performance of different classifiers is tested (Support Vector Machine, Logistic Regression and modified Huber) with different regularization methods (Ridge Regression, Lasso and Elastic net)[55]. Hyperparameter optimization is performed with a 10-fold cross validation optimizing score[56]. The best score is obtained with a Logistic Regression classifier with penalty (Ridge Regression). Classification scores are summarized in Table 3. We then classify users according to the class in which the majority of their tweets are classified.
In the statistical literature, see for example [46, 37], it has been shown that, in particular when analyzing social media, individual classification error through any machine learning approach (as the ones used here) remains high and does not vanish due to aggregation because of the large variance in estimates. In contrast, it can propagate up to the extent that, in many applications with thousands or millions of texts, one could see the error increasing to 15%-20%. This could be problematic if one is interested in estimating some type of aggregate measure through the analysis of social media. In this respect, instead of performing an individual classification of each single post and then aggregate the predicted values as done in our method, algorithms that directly estimates the aggregated distribution of opinions such as those of [46, 37] can be more robust. Although these methods that directly estimate the aggregated repartition of opinions are usually more robust and have a higher accuracy [46, 37], they do it at the cost of losing the individual classification, which is needed for our analysis of user behavior and supporter partition in the social network. Moreover, these methods estimate the proportion of documents at the aggregated level (in our case tweets) in favor of each candidate and not the proportion of users. As our analysis requires the absolute number and the proportion of users in favor of each candidate, the proportion of the aggregated tweets will not suffice, since, typically, users from different parties tweet, in average, at different rates, see Fig. 9. Therefore, we use our machine learning methods to directly extract the sentiment of each individual tweet towards a candidate from where we directly extract the opinion of each user, which, in turn, can be used to obtain the percentage of users favoring each candidate.
Using the final set of hashtags instead of the initial set increases the agreement between the Twitter opinion trend and the NYT national polling average (see Fig. 14 of the Supplementary Information). The improvement of the classification is also revealed by the larger classification scores obtained with the final set of hashtags (see Tab.3).
| AUROC | Accuracy | Precision | Recall | ||
|---|---|---|---|---|---|
| Initial set | 0.73 | 0.81 | 0.71 | 0.72 | 0.73 |
| Final set | 0.81 | 0.89 | 0.81 | 0.81 | 0.81 |
3.4 Fit of the Twitter opinion with the National Polling Average
Since where stand for Clinton and for Trump in equation 1, we only fit with its NYT counterpart . We have the following relations between the optimal parameters between the Clinton fit and the Trump fit: = and , since . We omit the superscript in the following.
The backward window average at day of length days of the support ratio is defined as
| (7) |
where is the ratio of user in favor of a candidate at day . The moving window average converts fluctuating daily data into a smooth trend that can be compared with the NYT smooth time series aggregated over many polls performed over several days. We fit the values of , and for increasing values of by minimizing the mean squared error.
Since a backward moving average induces a backward time shift, the total forward time shift between the Twitter time series and the NYT polling average is given by , where we limit to odd positive integer values to have only integer values.
4 Acknowledgments
Research was sponsored by Army Research Laboratory under Cooperative Agreement W911NF-09-2-0053 (ARL Network Science CTA), NSF and NIH. A. Bovet thanks the Swiss National Science Foundation (SNSF) for the financial support provided. The authors thank George Furbish for helping with the data collection.
5 Author contributions
H. M., F. M. and A. B. conceived the project. A. B. performed the analysis and prepared figures. A. B. and H. M. wrote the manuscript.
References
- [1] Mislove, A., Lehmann, S., Ahn, Y.-Y., Onnela, J.-P. & Rosenquist, J. N. Pulse of the nation: US mood throughout the day inferred from Twitter (2010). URL http://www.ccs.neu.edu/home/amislove/twittermood/.
- [2] Hannak, A. et al. Tweetin’ in the Rain: Exploring societal-scale effects of weather on mood. In Proc. 6th Int. AAAI Conf. Weblogs Soc. Media, 479–482 (Dublin, Ireland, 2012).
- [3] Pak, A. & Paroubek, P. Twitter as a Corpus for Sentiment Analysis and Opinion Mining. In Proc. Seventh Int. Conf. Lang. Resour. Eval., pp. 19–21 (European Language Resources Association (ELRA), Valletta, Malta, 2010).
- [4] Quattrociocchi, W., Caldarelli, G. & Scala, A. Opinion dynamics on interacting networks: media competition and social influence. Sci. Rep. 4, 4938 (2014).
- [5] Liu, Y., Huang, X., An, A. & Yu, X. ARSA: A Sentiment-Aware Model for Predicting Sales Performance Using Blogs. In Proc. 30th Annu. Int. ACM SIGIR Conf. Res. Dev. Inf. Retr., 607 (ACM Press, New York, New York, USA, 2007).
- [6] Bollen, J., Mao, H. & Zeng, X. Twitter mood predicts the stock market. J. Comput. Sci. 2, 1–8 (2011).
- [7] Zheludev, I., Smith, R. & Aste, T. When Can Social Media Lead Financial Markets? Sci. Rep. 4, 4213 (2014).
- [8] Ranco, G., Aleksovski, D., Caldarelli, G., Grčar, M. & Mozetič, I. The Effects of Twitter Sentiment on Stock Price Returns. PLoS One 10, e0138441 (2015).
- [9] Curme, C., Stanley, H. E. & Vodenska, I. Coupled network approach to predictability of financial market returns and news sentiments. Int. J. Theor. Appl. Financ. 18, 1550043 (2015).
- [10] O’Connor, B., Balasubramanyan, R., Routledge, B. R. & Smith, N. a. From tweets to polls: Linking text sentiment to public opinion time series. 122–129 (2010).
- [11] Tumasjan, A., Sprenger, T. O., Sandner, P. G. & Welpe, I. M. Election Forecasts With Twitter: How 140 Characters Reflect the Political Landscape. Soc. Sci. Comput. Rev. 29, 402–418 (2011).
- [12] Shi, L., Agarwal, N., Agrawal, A., Garg, R. & Spoelstra, J. Predicting US Primary Elections with Twitter. In Proc. Work. Soc. Netw. Soc. Media Anal., 1–8 (Lake Tahoe, Nevada, 2012).
- [13] Marchetti-Bowick, M. & Chambers, N. Learning for Microblogs with Distant Supervision : Political Forecasting with Twitter. In Proc. 13th Conf. Eur. Chapter Assosciation Comput. Linguist., 603–612 (2012).
- [14] Borondo, J., Morales, A. J., Losada, J. C. & Benito, R. M. Characterizing and modeling an electoral campaign in the context of Twitter: 2011 Spanish Presidential election as a case study. Chaos 22, 023138 (2012).
- [15] Park, S., Ko, M., Lee, J. & Song, J. Agenda Diversity in Social Media Discourse : A Study of the 2012 Korean General Election. In Proc. 7th Int. Conf. Web Soc. Media, 486–495 (2012).
- [16] Contractor, D. & Faruquie, T. A. Understanding election candidate approval ratings using social media data. In Proc. 22nd Int. Conf. World Wide Web - WWW ’13 Companion, 189–190 (ACM Press, New York, New York, USA, 2013).
- [17] Thapen, N. A. & Ghanem, M. M. Towards passive political opinion polling using twitter. In CEUR Workshop Proc., vol. 1110, 19–34 (2013).
- [18] Hoang, T.-A., Cohen, W. W., Lim, E.-P., Pierce, D. & Redlawsk, D. P. Politics, sharing and emotion in microblogs. In Proc. 2013 IEEE/ACM Int. Conf. Adv. Soc. Networks Anal. Min., 282–289 (ACM Press, New York, New York, USA, 2013).
- [19] Fink, C., Bos, N., Perrone, A., Liu, E. & Kopecky, J. Twitter, Public Opinion, and the 2011 Nigerian Presidential Election. In 2013 Int. Conf. Soc. Comput., 311–320 (IEEE, 2013).
- [20] Gayo-Avello, D. A Meta-Analysis of State-of-the-Art Electoral Prediction From Twitter Data. Soc. Sci. Comput. Rev. 31, 649–679 (2013).
- [21] Caldarelli, G. et al. A Multi-Level Geographical Study of Italian Political Elections from Twitter Data. PLoS One 9, e95809 (2014).
- [22] Borge-Holthoefer, J., Magdy, W., Darwish, K. & Weber, I. Content and Network Dynamics Behind Egyptian Political Polarization on Twitter. In Proc. 18th ACM Conf. Comput. Support. Coop. Work Soc. Comput. - CSCW ’15, 700–711 (ACM Press, New York, New York, USA, 2015).
- [23] Tsakalidis, A., Papadopoulos, S., Cristea, A. I. & Kompatsiaris, Y. Predicting Elections for Multiple Countries Using Twitter and Polls. IEEE Intell. Syst. 30, 10–17 (2015).
- [24] Kagan, V., Stevens, A. & Subrahmanian, V. Using Twitter Sentiment to Forecast the 2013 Pakistani Election and the 2014 Indian Election. IEEE Intell. Syst. 30, 2–5 (2015).
- [25] Saifuddin, A., Kokil, J. & Marko, M. S. Tweets & Votes - A 4 Country Comparison of Volumetric and Sentiment Analysis Approcahes. In Proc. 10th Int. Conf. Web Soc. Media, 507–510 (2016).
- [26] Wang, Y., Li, Y. & Luo, J. Deciphering the 2016 U.S. Presidential Campaign in the Twitter Sphere: A Comparison of the Trumpists and Clintonists. In Proc. 10th Int. Conf. Web Soc. Media, 4 (2016).
- [27] Llewellyn, C. & Cram, L. Brexit? Analyzing Opinion on the UK-EU Referendum within Twitter. In Proc. 10th Int. Conf. Web Soc. Media, 760–761 (2016).
- [28] Jungherr, A., Jurgens, P. & Schoen, H. Why the Pirate Party Won the German Election of 2009 or The Trouble With Predictions: A Response to Tumasjan, A., Sprenger, T. O., Sander, P. G., & Welpe, I. M. ”Predicting Elections With Twitter: What 140 Characters Reveal About Political Sentiment”. Soc. Sci. Comput. Rev. 30, 229–234 (2012).
- [29] Jungherr, A., Schoen, H., Posegga, O. & Jurgens, P. Digital Trace Data in the Study of Public Opinion: An Indicator of Attention Toward Politics Rather Than Political Support. Soc. Sci. Comput. Rev. 0894439316631043 (2016).
- [30] Subrahmanian, V. & Reforgiato, D. AVA: Adjective-Verb-Adverb Combinations for Sentiment Analysis. IEEE Intell. Syst. 23, 43–50 (2008).
- [31] Montejo-Ráez, A., Martínez-Cámara, E., Martín-Valdivia, M. T. & Ureña-López, L. A. Ranked WordNet graph for Sentiment Polarity Classification in Twitter. Comput. Speech Lang. 28, 93–107 (2014).
- [32] Tausczik, Y. R. & Pennebaker, J. W. The Psychological Meaning of Words: LIWC and Computerized Text Analysis Methods. J. Lang. Soc. Psychol. 29, 24–54 (2010).
- [33] Gonzalez-Bailon, S. & Paltoglou, G. Signals of Public Opinion in Online Communication: A Comparison of Methods and Data Sources. Ann. Am. Acad. Pol. Soc. Sci. 659, 95–107 (2015).
- [34] Ceron, A., Curini, L. & Iacus, S. M. Using Sentiment Analysis to Monitor Electoral Campaigns: Method Matters–Evidence From the United States and Italy. Soc. Sci. Comput. Rev. 33, 3–20 (2015).
- [35] Beauchamp, N. Predicting and Interpolating State-Level Polls Using Twitter Textual Data. Am. J. Pol. Sci. 00, 1–14 (2016).
- [36] Sylwester, K. & Purver, M. Twitter language use reflects psychological differences between Democrats and Republicans. PLoS One 10, 1–18 (2015).
- [37] Ceron, A., Curini, L. & Iacus, S. M. ISA: A fast, scalable and accurate algorithm for sentiment analysis of social media content. Inf. Sci. (Ny). 367-368, 105–124 (2016).
- [38] Ceron, A., Curini, L. & Iacus, S. Politics and Big Data: Nowcasting and Forecasting Elections with Social Media (Taylor & Francis, 2017).
- [39] New York Times. New York Times National Polling Average (2016). URL http://www.nytimes.com/interactive/2016/us/elections/polls.html. [Online; accessed 24-April-2017].
- [40] Pei, S., Muchnik, L., Andrade, Jr., J. S., Zheng, Z. & Makse, H. a. Searching for superspreaders of information in real-world social media. Sci. Rep. 4, 5547 (2014).
- [41] Bunde, A. & Havlin, S. Fractals and Disordered Systems (Springer Berlin Heidelberg, 2012).
- [42] Bollobás, B. Random Graphs. Cambridge Studies in Advanced Mathematics (Cambridge University Press, 2001).
- [43] Raghavan, U. N., Albert, R. & Kumara, S. Near linear time algorithm to detect community structures in large-scale networks. Phys. Rev. E - Stat. Nonlinear, Soft Matter Phys. 76, 1–11 (2007).
- [44] Blondel, V. D., Guillaume, J.-L., Lambiotte, R. & Lefebvre, E. Fast unfolding of communities in large networks. J. Stat. Mech. Theory Exp. 2008, P10008 (2008).
- [45] Barberá, P., Jost, J. T., Nagler, J., Tucker, J. A. & Bonneau, R. Tweeting From Left to Right. Psychol. Sci. 26, 1531–1542 (2015).
- [46] Hopkins, D. J. & King, G. A Method of Automated Nonparametric Content Analysis for Social Science. Am. J. Pol. Sci. 54, 229–247 (2010).
- [47] Wang, X., Wei, F., Liu, X., Zhou, M. & Zhang, M. Topic sentiment analysis in twitter. In Proc. 20th ACM Int. Conf. Inf. Knowl. Manag., 1031 (ACM Press, New York, New York, USA, 2011).
- [48] Bohannon, J. The pulse of the people. Science 355, 470–472 (2017).
- [49] Jasny, B. R. & Stone, R. Prediction and its limits. Science 355, 468–469 (2017).
- [50] Conover, M. D., Gonçalves, B., Flammini, A. & Menczer, F. Partisan asymmetries in online political activity. EPJ Data Sci. 1, 6 (2012).
- [51] Pew Research Center. Assessing the representativeness of public opinion surveys (2013). URL http://www.people-press.org/2012/05/15/assessing-the-representativeness-of-public-opinion-surveys. [Online; accessed 5-October-2016].
- [52] Morstatter, F., Pfeffer, J., Liu, H. & Carley, K. Is the sample good enough? Comparing data from Twitter’s streaming API with Twitter’s firehose. In Proc. Seventh Int. AAAI Conf. Weblogs Soc. Media, 400–408 (2013).
- [53] Pew Research Center. Social media update 2016 (2016). URL http://www.pewinternet.org/2016/11/11/social-media-update-2016/. [Online; accessed 7-March-2017].
- [54] Martinez-Romo, J. et al. Disentangling categorical relationships through a graph of co-occurrences. Phys. Rev. E 84, 1–8 (2011).
- [55] Hastie, T., Tibshirani, R. & Friedman, J. The Elements of Statistical Learning, vol. 1 of Springer Series in Statistics (Springer New York, New York, NY, 2009).
- [56] Pedregosa, F. et al. Scikit-learn: Machine learning in Python. J. Mach. Learn. Res. 12, 2825–2830 (2011).
Validation of Twitter opinion trends with national polling aggregates: Hillary Clinton vs Donald Trump - Supplementary Information
Alexandre Bovet, Flaviano Morone, Hernán A. Makse
Levich Institute and Physics Department, City College of New York, New York, New York 10031, USA
| pro-Clinton | anti-Trump | pro-Trump | anti-Clinton |
|---|---|---|---|
| bernwithher | antitrump | alwaystrump | clintoncorruption |
| bluewave2016 | anyonebuttrump | babesfortrump | clintoncrime |
| clintonkaine2016 | boycotttrump | bikers4trump | clintoncrimefamily |
| estoyconella | chickentrump | bikersfortrump | clintoncrimefoundation |
| herstory | clowntrain | blacks4trump | corrupthillary |
| heswithher | crookeddonald | buildthatwall | criminalhillary |
| hillafornia | crookeddrumpf | buildthewall | crookedclinton |
| hillary2016 | crookedtrump | cafortrump | crookedclintons |
| hillaryforamerica | crybabytrump | democrats4trump | crookedhilary |
| hillaryforpr | defeattrump | donaldtrumpforpresident | crookedhiliary |
| hillaryforpresident | dirtydonald | feelthetrump | crookedhillary |
| hillarysopresidential | donthecon | feminineamerica4trump | crookedhillaryclinton |
| hillarysoqualified | drumpf | gays4trump | deletehillary |
| hillarystrong | dumbdonald | gaysfortrump | dropouthillary |
| hillstorm2016 | dumpthetrump | gotrump | fbimwithher |
| hillyes | dumptrump | heswithus | handcuffhillary |
| hrc2016 | freethedelegates | imwithhim | heartlesshillary |
| hrcisournominee | lgbthatestrumpparty | imwithyou | hillary2jail |
| iamwithher | loserdonald | latinos4trump | hillary4jail |
| imwither | losertrump | latinosfortrump | hillary4prison |
| imwithher | lovetrumpshate | maga | hillary4prison2016 |
| imwithher2016 | lovetrumpshates | makeamericagreat | hillaryforprison |
| imwithhillary | lyindonald | makeamericagreatagain | hillaryforprison2016 |
| imwiththem | lyingdonald | makeamericasafeagain | hillaryliedpeopledied |
| itrusther | lyingtrump | makeamericaworkagain | hillarylies |
| itrusthillary | lyintrump | onlytrump | hillaryliesmatter |
| madamepresident | makedonalddrumpfagain | presidenttrump | hillarylostme |
| madampresident | nevergop | rednationrising | hillaryrottenclinton |
| momsdemandhillary | nevertrump | trump16 | hillarysolympics |
| ohhillyes | nevertrumppence | trump2016 | hillno |
| readyforhillary | nodonaldtrump | trumpcares | hypocritehillary |
| republicans4hillary | notrump | trumpforpresident | imnotwithher |
| republicansforhillary | notrumpanytime | trumpiswithyou | indicthillary |
| sheswithus | poordonald | trumppence16 | iwillneverstandwithher |
| standwithmadampotus | racisttrump | trumppence2016 | killary |
| strongertogether | releasethereturns | trumpstrong | lockherup |
| uniteblue | releaseyourtaxes | trumptrain | lyingcrookedhillary |
| vote4hillary | ripgop | veteransfortrump | lyinghillary |
| voteblue | showusyourtaxes | vets4trump | lyinhillary |
| voteblue2016 | sleazydonald | votegop | moretrustedthanhillary |
| votehillary | stoptrump | votetrump | neverclinton |
| welovehillary | stupidtrump | votetrump2016 | nevereverhillary |
| yeswekaine | traitortrump | votetrumppence2016 | neverhillary |
| treasonoustrump | woman4trump | neverhilllary | |
| trump20never | women4trump | nohillary2016 | |
| trumplies | womenfortrump | nomoreclintons | |
| trumpliesmatter | notwithher | ||
| trumpsopoor | ohhillno | ||
| trumpthefraud | releasethetranscripts | ||
| trumptrainwreck | riskyhillary | ||
| trumptreason | shelies | ||
| unfittrump | sickhillary | ||
| weakdonald | stophillary | ||
| wherertrumpstaxes | stophillary2016 | ||
| wheresyourtaxes | theclintoncontamination | ||
| whinylittlebitch | wehatehillary | ||
| womentrumpdonald | whatmakeshillaryshortcircuit |
| pro-Clinton | anti-Trump | pro-Trump | anti-Clinton |
|---|---|---|---|
| bluewave | chickentrump | alwaystrump | billclintonisrapist |
| bluewave2016 | clowntrain | america1st | clintoncollapse |
| clintonkaine2016 | crookeddonald | americafirst | clintoncorruption |
| connecttheleft | crookedtrump | blacks4trump | clintoncrimefamily |
| estoyconella | defeattrump | blacksfortrump | clintoncrimefoundation |
| hereiamwithher | dirtydonald | buildthewall | corruptclintons |
| herstory | donthecon | deplorablesfortrump | corrupthillary |
| heswithher | dumbdonald | draintheswamp | criminalhillary |
| hillary2016 | dumpthetrump | gaysfortrump | crookedclinton |
| hillaryaprovenleader | loserdonald | imwithhim | crookedhilary |
| hillaryforamerica | losertrump | imwithyou | crookedhillary |
| hillaryforpresident | lovetrumpshate | latinosfortrump | democratliesmatter |
| hillyes | lyingtrump | latinoswithtrump | dropouthillary |
| iamwithher | lyintrump | maga | hillary2jail |
| imwithher | nastywoman | maga3x | hillary4prison |
| imwithher2016 | nastywomen | magax3 | hillaryforprison |
| madamepresident | nastywomenvote | makeamericagreatagain | hillaryforprison2016 |
| madampresident | nevergop | makeamericasafeagain | hillarylies |
| ohhillyes | nevertrump | onlytrump | hillaryliesmatter |
| republicansforhillary | orangehitler | rednationrising | imnotwithher |
| sheswithus | racisttrump | securetheborder | indicthillary |
| strongertogether | ripgop | trump2016 | killary |
| turnncblue | stoptrump | trumpforpresident | lockherup |
| uniteblue | trump20never | trumppence16 | lyingcrookedhillary |
| unitedagainsthate | trumpleaks | trumppence2016 | lyinghillary |
| voteblue | trumplies | trumpstrong | neverhilary |
| voteblue2016 | whinylittlebitch | trumptrain | neverhillary |
| votehillary | trumpwins | ohhillno | |
| wearewithher | trumpwon | queenofcorruption | |
| werewithher | veteransfortrump | queenofcorrupton | |
| whyimwithher | votegop | sickhillary | |
| votetrump | |||
| votetrump2016 | |||
| votetrumppence | |||
| votetrumppence16 | |||
| votetrumpusa | |||
| women4trump | |||
| womenfortrump |