Herschel Observations and Updated Spectral Energy Distributions of Five Sunlike Stars with Debris Disks
Abstract
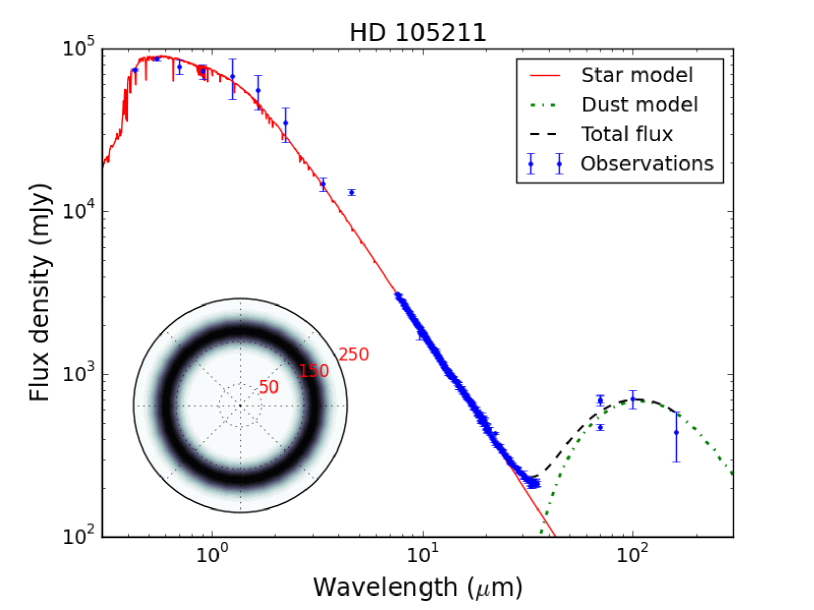
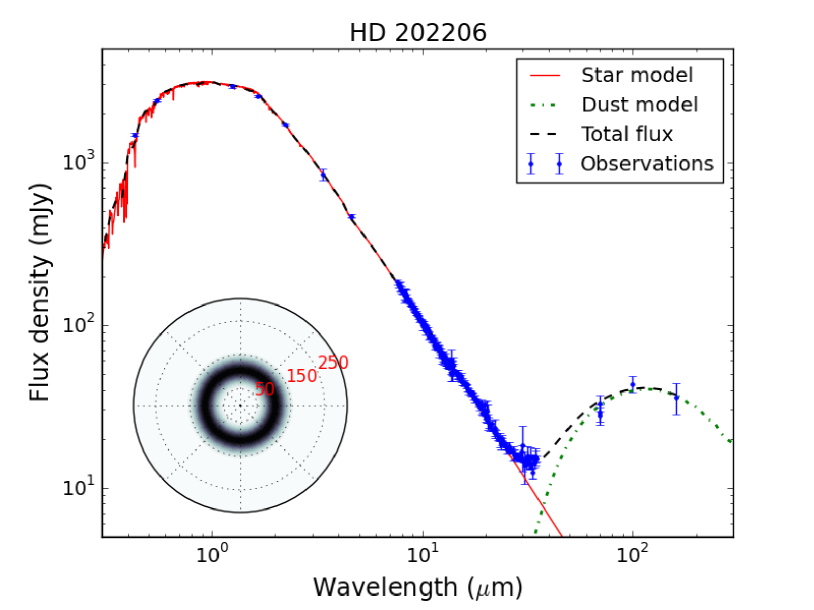
Observations from the Herschel Space Observatory have more than doubled the number of wide debris disks orbiting Sunlike stars to include over 30 systems with AU. Here we present new Herschel PACS and re-analyzed Spitzer MIPS photometry of five Sunlike stars with wide debris disks, from Kuiper belt size to AU. The disk surrounding HD 105211 is well resolved, with an angular extent of along the major axis, and the disks of HD 33636, HD 50554, and HD 52265 are extended beyond the PACS PSF size (50% of energy enclosed within radius ). HD 105211 also has a infrared excess that was previously overlooked because of a poorly constrained photospheric model. Archival Spitzer IRS observations indicate that the disks have small grains of minimum radius , though is larger than the radiation pressure blowout size in all systems. If modeled as single-temperature blackbodies, the disk temperatures would all be K. Our radiative transfer models predict actual disk radii approximately twice the radius of a model blackbody disk. We find that the Herschel photometry traces dust near the source population of planetesimals. The disk luminosities are in the range , consistent with collisions in icy planetesimal belts stirred by Pluto-size dwarf planets.
I. Introduction
Observations from the Herschel Space Observatory have revealed a population of extrasolar debris disks with blackbody temperatures K and peak flux densities at wavelengths near . Photodetector Array Camera and Spectrograph (PACS; Pilbratt et al., 2010) and observations of the DUst around NEarby Stars (DUNES) Sunlike targets reveal a debris disk incidence of 20%, up from 12% at the shorter Spitzer MIPS wavelengths (Eiroa et al., 2013). Far-IR observations are therefore opening up a new discovery space of disks more than 100 times more luminous than the Edgeworth-Kuiper belt, but too cold to detect at .
We now know of over 30 disks with radii AU (Eiroa et al., 2010; Morales et al., 2013; Duchêne et al., 2014; Pawellek et al., 2014). Since even wide disks require active collisional cascades to replenish grains (Burns et al., 1979), planetesimal formation must be a robust process even at very large distances from the star. Planet formation at 125-250 AU may even have proceeded as far as super-Earth mass (Kenyon & Bromley, 2015). The wide dust disks revealed by Herschel and earlier (sub)millimeter/scattered light observations (e.g. Greaves et al., 1998; Ardila et al., 2004; Krist et al., 2005; Wyatt et al., 2005; Hines et al., 2007; Kalas et al., 2007a, b; Liseau et al., 2008; Krist et al., 2010; Golimowski et al., 2011) may be remnants of planetary systems that orbit Sunlike stars but are nevertheless very different than our own: dynamical evidence indicates that the solar nebula was likely truncated between 80 and 100 AU due to photoevaporation or tidal interactions with nearby young stars (Kretke et al., 2012; Anderson et al., 2013). Here we present Herschel observations of five Sunlike stars with debris disks that transition from Kuiper Belt size to AU. We use the Debris Disk Simulator (Wolf & Hillenbrand, 2005) to construct model SEDs and compare our disk radii, grain sizes, and luminosities with other debris disks orbiting Sunlike stars.
We begin with a discussion of target selection, observations, and data reduction (section II). Next, we discuss the extended structure observed in our images: our targets include one well-resolved disk and three moderately extended sources (section III). We then present the new Herschel and Spitzer photometry in section IV. Radiative transfer models of the disk spectral energy distributions (SEDs) follow in section V, with conclusions and possible future work in section VI.
II. Observations and Data Reduction
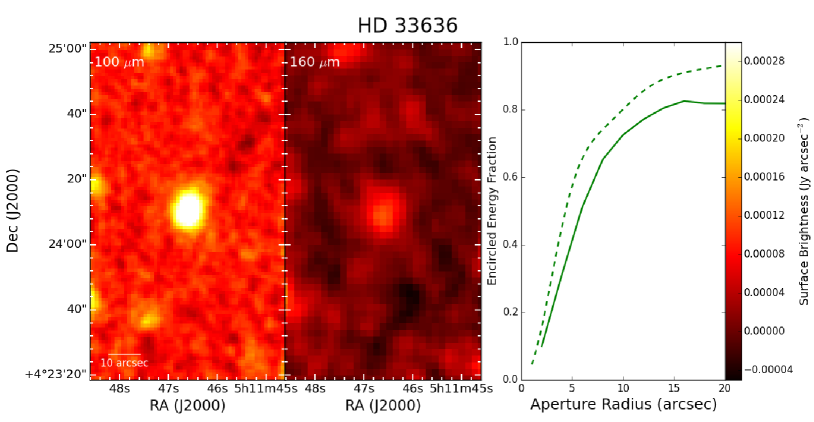
We selected five Sunlike stars with debris disks discovered in Spitzer observations for Herschel follow-up. All targets have infrared excess emission seen in both Spitzer IRS observations at (Dodson-Robinson et al., 2011; Chen et al., 2014) and in Spitzer MIPS observations at (Beichman et al., 2006; Bryden et al., 2009). (HD 105211 also has a MIPS excess, which was not realized at the time of publication (Beichman et al., 2006); see section V.1 for more detail.) The observing strategy was designed to ensure detection in all Herschel PACS bandpasses. Based on the two detections at different wavelengths, Dodson-Robinson et al. (2011) fit single-temperature blackbody models to the Spitzer excess emission, which we extended to the Herschel PACS bandpasses. Exposure times were selected such that each target would be detected at the level, where was the quadrature sum of the instrument noise and the predicted confusion noise reported in the Herschel Observers’ Manual111Document HERSCHEL-HSC-DOC-0876. (In reality, some of the sources have brighter backgrounds than predicted, leading to detections with low significance or non-detections.)
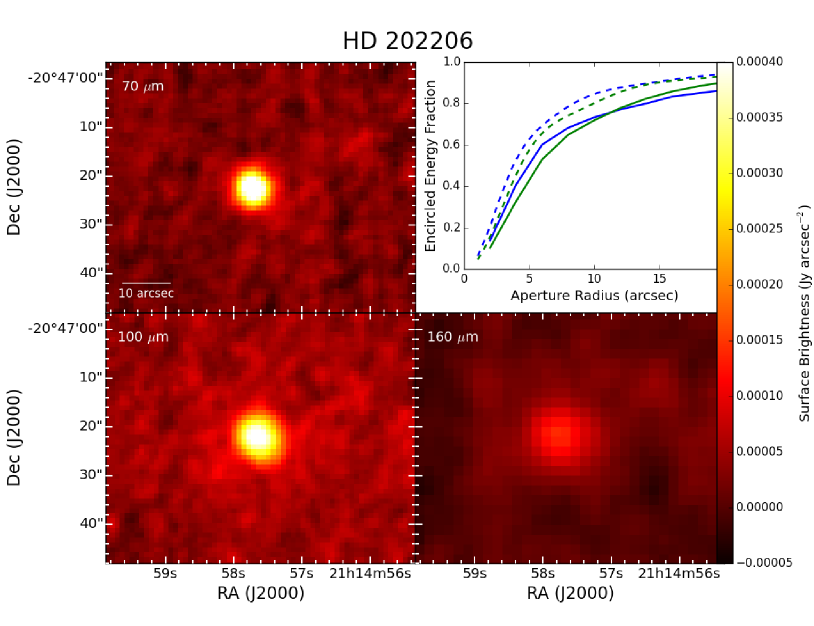
Each observation consists of PACS medium-speed cross-scans separated in position angle by . Program OT1_sdodsonr_1 includes simultaneous / observations of all targets as well as simultaneous / observations of HD 50554 and HD 105211. Observations are scan maps with eight scan legs of length and cross-scan step . We also obtained / observations of HD 50554, HD 52265, and HD 202206 from the Herschel Science Archive (program OT1_amoromar_1, PI A. Moro-Martín). Data reduction beginning with the Level 1 data cubes was performed using the Herschel Interactive Processing Environment version 12.1.0 (HIPE; Ott, 2010). We used the HIPE implementation of the JScanam map-making algorithm (Graciá-Carpio et al., 2015) to combine scans and cross-scans into oversampled mosaics of per pixel at 70 and and per pixel at . The JScanam map-maker removes the noise that results in signal drifts without subtracting extended emission, which was an important consideration because some of our sources are not pointlike (see Section III). However, JScanam also leaves point sources intact, so can be used for any type of target. Table 3 (located on the last page of this document) lists the targets in our sample and their Herschel Science Archive observation IDs. The table also includes luminosity and age estimates from the literature (McDonald et al., 2012; Chen et al., 2014; Bonfanti et al., 2015) and luminosity estimates from this work222We calculate luminosities based on -band magnitudes using , where the variables and represent absolute magnitude and luminosity. We find better than 10% agreement between our luminosity calculations and the literature values and base all further analysis on our own luminosity calculations.. Figures 1, 2, 3, 4, and 5 show the final mosaics in each band for all targets.
III. Extended Structure
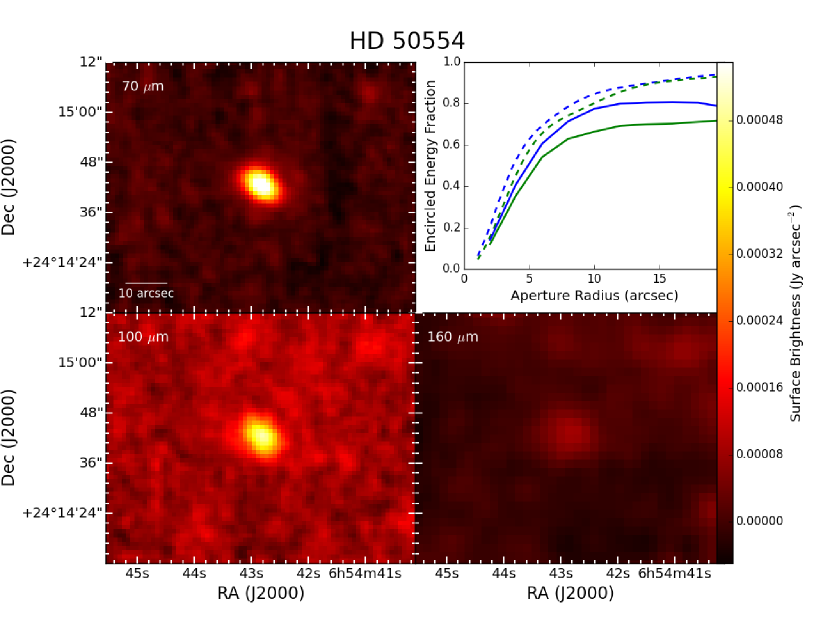
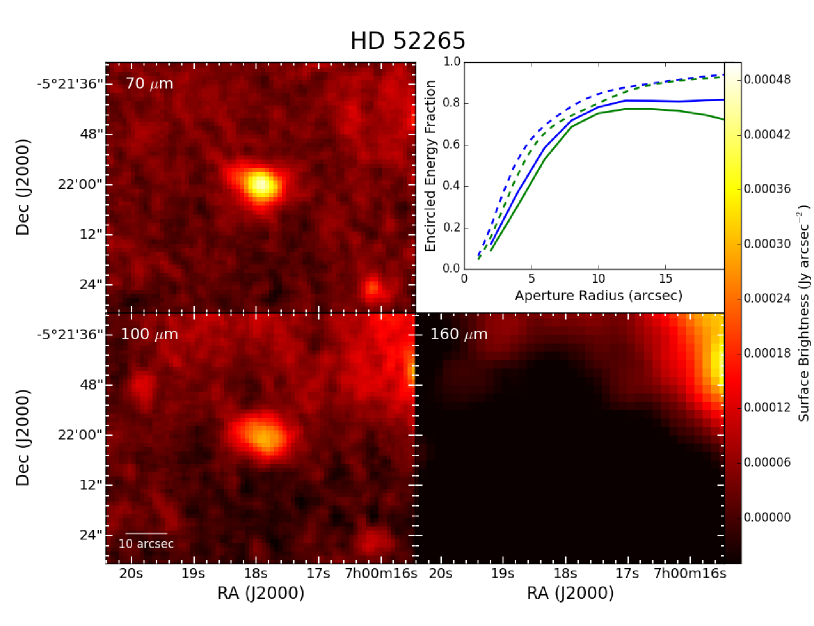
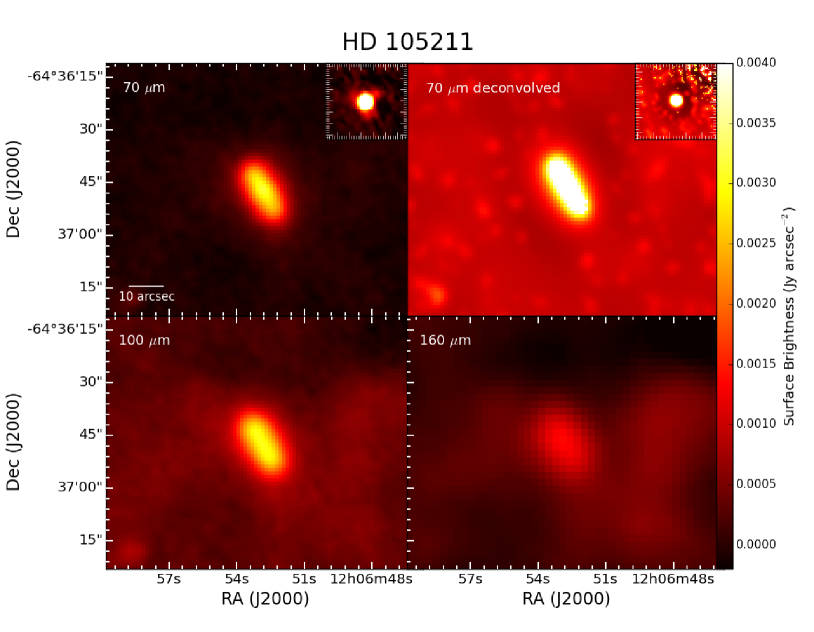
Determining the spatial extent of the disks is important for selecting the correct aperture sizes for photometry. Examining the and mosaics in Figures 1, 2, 3, 4 and 5 suggests that the disks are not point sources, but instead have some extended structure. Figures 1, 2, 3, and 5 contain curves of growth for HD 33636, HD 50554, HD 52265, and HD 202206 showing encircled energy fraction as a function of circular aperture radius for the (green) and, where available, (blue) mosaics. For comparison, the dashed lines show curves of growth from the point source Vesta (Lutz, 2010). For HD 33636, HD 50554, and HD 52265, the curves of growth are well below those of the Vesta PSF, indicating that the sources have extended structure. HD 50554 is elongated at both and , but has a small apparent position angle shift between the two bands. Fitting an elliptical Gaussian function to the source, we find a position angle (East of North) of at and at . The difference is too small to conclusively indicate morphology changes between dust emitting at different wavelengths, but should be kept in mind as a possible source of uncertainty in the photometry and SED fitting. HD 202206 is less well resolved than the other sources, but is still more extended than a point source. For some targets some cases the curves of growth turn downward instead of monotonically increasing with aperture size, indicating that the aperture has expanded to include pixels with negative flux densities. The photometric aperture must be kept smaller than the curve-of-growth turnover radius. HD 105211 (Figure 4) is clearly resolved in all PACS bands. The extended nature of our targets leads us use larger photometric apertures than the faint-source sizes used by the DUNES team (Eiroa et al., 2013). We use as our nominal aperture size at 70 and (see Section IV), which captures the extended emission yet avoids negative-valued pixels.
The upper-right panel of Figure 4 shows the deconvolved image of HD 105211. Examination of a point source located in the 70∘ cross-scan, shown in the inset plots of the original image (upper left) and the deconvolved image, reveals the extent to which deconvolution has suppressed the trefoil PSF structure. Although our deconvolution procedure does not perfectly conserve flux, one can still see that most of the emission in the deconvolved image is concentrated in a narrow band indicating a nearly edge-on disk. We performed an elliptical Gaussian source fit on the original (not deconvolved) image and found and , where the x-direction is East-West and the y-direction is North-South. The position angle is East of North. Assuming a circular debris ring, the radius of the -emitting ring is approximately , or 154 AU, in rough agreement with the SED fitting results (see section V). The inner edge of the ring is not resolved, possibly due to the high inclination of the disk.
IV. Photometry
For all targets except for HD 105211, our aperture photometry is based
on the PACS ipipe script
L3_pointSourceAperturePhotometry.py333Author: Markus
Nielbock; available in HIPE through the ‘Scripts PACS Useful
Scripts’ menu,
which uses the HIPE tasks
annularSkyAperturePhotometry and
photApertureCorrectionPointSource. For HD 33636, HD 50554, and
HD 202206, aperture sizes are at and , with background subtraction based on sky annuli of . For HD 52265 we use an aperture and an sky annulus at both and to exclude a
bright source west of the target. At , where confusion
noise is most severe, we use a aperture and decrease the
sky annulus to for HD 33636 and HD 202206. For HD 50554
at we use an aperture of and a sky annulus of
in order to avoid a nearby source. HD 52265 is
undetected at due to confusion. For the extended source
HD 105211, we use the Aperture Photometry Tool (APT; Laher et al., 2012).
We choose an elliptical aperture of semimajor axis and
semiminor axis at an angle of East of North.
The sky annulus has major axis and minor axis at 70 and , and major axis and
minor axis at . The elliptical aperture
corrections are based on Table 2 of Balog et al. (2014), which reports
encircled energy fraction (EEF) as a function of circular aperture
radius for each PACS filter. For an aperture with semimajor axis and
semiminor axis , the multiplicative aperture correction is
| (1) |
For and , we find aperture corrections of 1.201 at , 1.241 at , and 1.384 at .
Uncertainties have several components: Poisson noise from the source, sky background, PACS absolute flux calibration, and residual noise that may elude the map-making algorithm. Since the pixels in each final mosaic are not native, but instead are reconstructed from multiple scans of the source, they are not independent and the method of estimating random noise as (where is the standard deviation of the sky flux and is the number of pixels in the aperture) does not work. Instead, the usual procedure for calculating the random component of the PACS-image error budget is to place apertures of the same size and shape used for the science target on the sky background and calculate the standard deviation of the aperture-corrected flux from each. Following Balog et al. (2014), we use six apertures placed evenly around the outer edge of the background sky annulus for all targets except HD 105211. The HD 105211 sky background is structured, with an extended bright source directly to the west of the disk (Figure 4; see especially the image at the lower right). To estimate photometric error for HD 105211, we use 12 elliptical apertures placed randomly on the image, excluding the bright source. Finally, we include conservative estimates of the systematic errors—both from absolute flux calibration and repeatability—of 7% of the source flux (Balog et al., 2014). Quoted uncertainties are the quadrature sum of the random and systematic errors. Table 1 lists the measured PACS flux densities.
As a consistency check, we compare our PACS flux densities with Spitzer MIPS observations. Published values come from the catalog of Chen et al. (2014), which includes photometry from a variety of literature sources. We also present new photometry of both the and images based on the MIPS team in-house pipeline (Gordon et al., 2005; Su et al., 2010)444New photometry presented in Table 1 is labeled “Su et al. (2010)” under Analysis Method.. MIPS did not observe HD 202206 at . We use PSF extraction to find flux densities for the remaining targets. All targets have MIPS data. We use PSF extraction to measure flux densities for all targets except HD 105211, for which we use an aperture with radius and a sky annulus of .
Table 1 lists the MIPS flux densities for each target. The two MIPS analysis pipelines yield flux densities that are consistent at the 1–2 level, though there is a clear discrepancy in how the error bars are computed for HD 105211. The MIPS flux densities from the two pipelines are fully consistent for each source except HD 105211. The low HD 105211 flux density of 474 mJy reported by Beichman et al. (2006) is probably due to their choice to use a uniform aperture radius of 1.5 camera pixels () for the entire survey. Since the spatial extent of the HD 105211 disk in our PACS images is on the major axis, Beichman et al. (2006) may have underestimated the flux density. The remaining PACS and MIPS fluxes are consistent at the level, indicating good agreement between the Spitzer and Herschel fluxes.
As a final test of our photometry pipeline, we measure fluxes from the PACS calibrator star Ceti (HD 18884). We use scan/cross-scan AOR pairs 1342212853/1342212854 (; observing day 614) and 1342203030/1342203031 (; observing day 457). The scan/cross-scan pairs were processed with the same JScanam map-making script as the science observations. We then performed photometry with the nominal aperture and sky annuli used for HD 33636, HD 52265, and HD 202206 (our compact, uncrowded targets). Our results match those of the instrument team (Table 12 Balog et al., 2014) to within 1% at all wavelengths, demonstrating the high accuracy of our data pipeline for pointlike sources with clean backgrounds (see Section V for caveats about the HD 105211 observations).
In the next section we combine Spitzer and Herschel observations to extend SED coverage to the peak wavelengths of dust emission, using a radiative transfer model to derive dust properties.
V. Spectral Energy Distributions
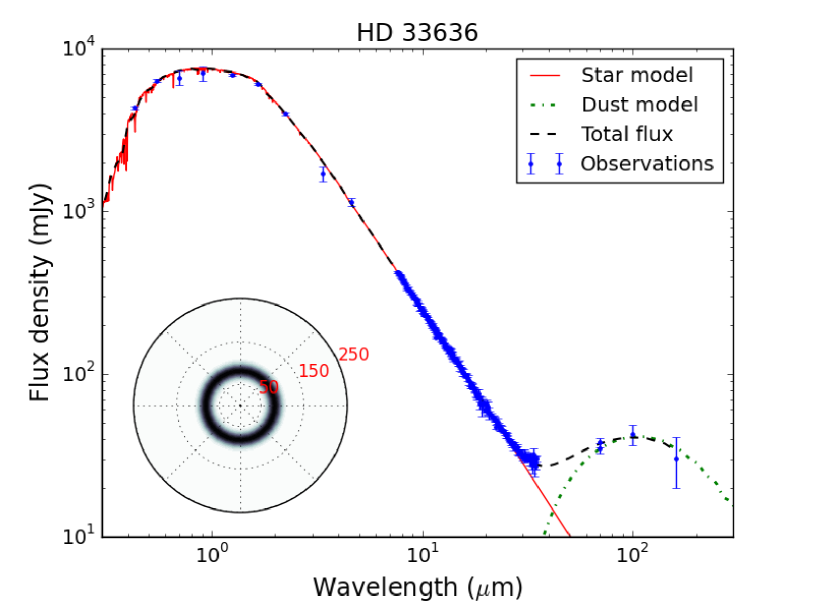
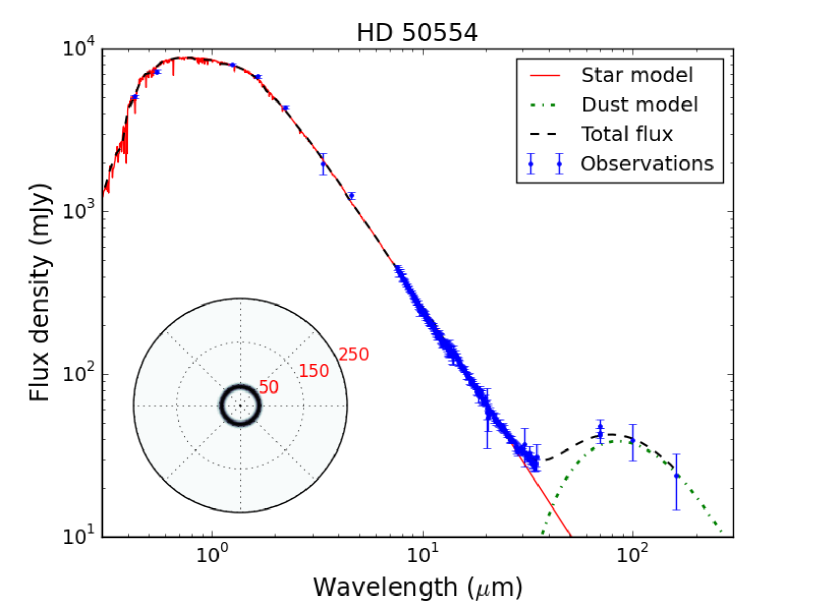
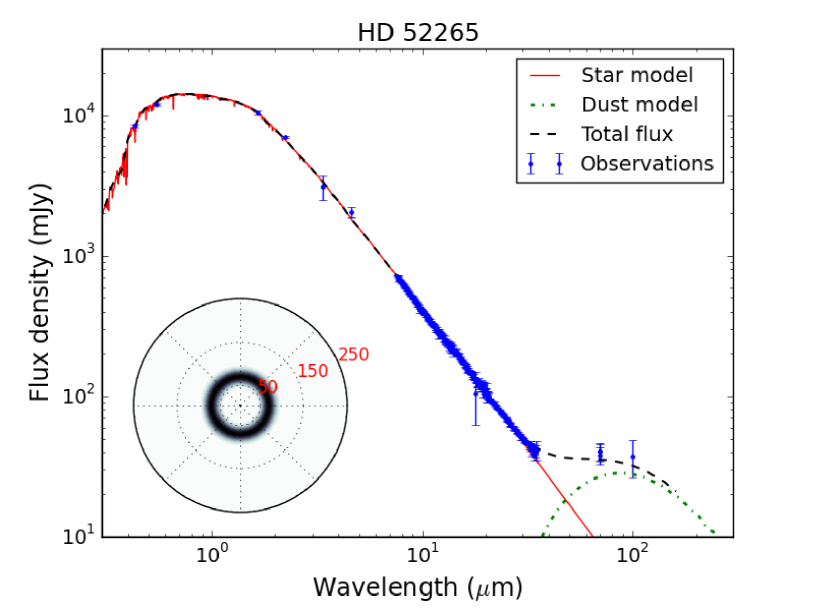
The disks in this study are cold enough that observations at and shorter wavelengths probe only the increasing side of the curve. The Herschel photometry extends coverage to the peak and the decreasing side of . We use the Debris Disk Simulator (DDS)555www1.astrophysik.uni-kiel.de/dds/ (Wolf, 2003; Wolf & Hillenbrand, 2005) to fit SED models to the Spitzer IRS/MIPS and Herschel PACS photometry. The DDS takes as input a stellar spectrum, an inner and outer radius for the dust ring, a dust mass, an analytical or numerical description of the dust number density (where is the distance from the star), and a grain size distribution of the form ( is the grain radius and we set ). The assumption of a power-law grain size distribution is reasonable for the larger grains, but dynamical models that include loss processes such as Poynting-Robertson drag predict that for grains with , the size distribution turns over so that the grain abundance increases with radius (Wyatt et al., 2011; Kenyon & Bromley, 2016). Since the far infrared-emitting dust grains are most likely part of a collisional cascade that includes large grains, we set mm for all models. Larger particles would be present, but the grain size distribution is so steep that the larger grains would contribute only of the total thermal emission. The DDS also allows the user to set the chemical composition of the grains; here we assume 100% astronomical silicate (Laor & Draine, 1993). Since we do not explore the composition options, our model SEDs are plausible but not unique. In particular, the grains could have organic components or ice mantles, though ice would eventually succumb to photodesorption. However, the small number of spectral data points that cover the bulk of the disks’ emission do not warrant extremely flexible fits.
The parameters we explore are minimum grain size , the debris ring’s distance from the star , the width of the debris ring (assuming a Gaussian number-density profile centered at ), and the mass of grains smaller than mm. Input star spectra are Atlas9 model photospheres (Kurucz, 1992) originally fitted by Dodson-Robinson et al. (2011), based on Hipparcos/Tycho and magnitudes (Perryman et al., 1997; Høg et al., 2000) and 2MASS magnitudes (Cutri et al., 2003). Where available, we added photometry from Bessell (1990). We also checked for consistency between the Dodson-Robinson et al. (2011) model photospheres and the allWISE photometry (Wright et al., 2010; Cutri et al., 2013) and found good agreement. The allWISE photometry was particularly important for HD 105211, which has conflicting photosphere models in the literature due to poor-quality 2MASS photometry; and for HD 52265, which has a poor-quality 2MASS magnitude. Table 2 lists the fitted parameters for each SED, and Figures 6-10 show the model SEDs. We begin our discussion of SEDs with a detailed look at the photosphere model and mid-IR photometry of HD 105211, which requires extra care because of the imprecise 2MASS data, then move on to the ensemble properties of our disks.
V.1. HD 105211 Mid-IR Photometry and Photosphere
HD 105211 is bright enough to have saturated the 2MASS detectors, so the flux densities have % errors. The near-infrared data is important for constraining the Rayleigh-Jeans side of the spectrum, as the turnover to an power law happens in the band for HD 105211. A further issue is that the SIMBAD database identifies HD 105211 as a spectroscopic binary, though Eggleton & Tokovinin (2008) find that a single star is the most probable configuration. If HD 105211 is a binary, a single photosphere model might not accurately reproduce the emission from both components. Beichman et al. (2006) presented the first Spitzer observations of HD 105211, reporting an infrared excess at but not at . Their measured excess was based on a model photosphere with K, which was fit to photometry and predicted a photospheric flux density of 363.4 mJy at . Saffe et al. (2008) then measured K from spectroscopy, which agrees with the optical spectral type F2 V of Gray et al. (2006). Dodson-Robinson et al. (2011) added photometry from Bessell (1990) to the photospheric fit constraints, which yielded a best-fit photosphere model with K. Moving to the new, hotter photosphere model yields a higher near-IR/mid-IR flux ratio and a lower predicted photospheric flux density of 321.9 mJy. Based on the Dodson-Robinson et al. (2011) model photosphere and our re-reduction of the MIPS data, HD 105211 has a excess at (see Table 1). Chen et al. (2014) computed a third model photosphere with a predicted flux of 347.1 mJy, which combined with the new MIPS re-reduction yields a excess at . The allWISE W1 photometry best corresponds to the Dodson-Robinson et al. (2011) photosphere model, with a monochromatic flux density only higher than the model. As the star is saturated in W2 (see Figure 9), we do not re-fit the model photosphere with the allWISE data added. We adopt the Dodson-Robinson et al. (2011) photosphere model for this work, but note that the accuracy of the spectral type and effective temperature would benefit from additional data. James (2013) find an intrinsic scatter of about two spectral subtypes in a cross-correlation analysis of their spectral library—for example, the spectrum of a star typed F8 V might best match the F6 V template spectrum—a level of uncertainty consistent with the differences between the analyses of Dodson-Robinson et al. (2011), Chen et al. (2014), Saffe et al. (2008), and Gray et al. (2006).
There is still concern about the IRS data, however. Since slit loss led to 5-10% flux density underestimates in IRS, Dodson-Robinson et al. (2011) calculated absolute flux densities by assuming that the shortest-wavelength data points of the SL1 module (beginning at ) traced the photosphere. The LL2 and LL1 data were then spliced to the SL1 data so as to make a continuous function. However, the data at the long-wavelength end of LL2 () have large error bars, and there appears to be a drop in fractional excess flux at the short-wavelength end of LL1 (; see Figure 2 of Dodson-Robinson et al. (2011)). It is possible that HD 105211 has multiple debris belts, which would account for the rise and fall of fractional excess at , but the IRS data are not conclusive. What is concerning is that the IRS data differ from the allWISE W4 data (after conversion to monochromatic flux at ) by . (Beichman et al. (2006) and our MIPS re-reduction disagree on the errors in the MIPS flux, but adopting mJy from Beichman et al. (2006), our IRS flux density is consistent with the MIPS data.) The disagreement between W4 and IRS may be due to the W4 color correction; the bandpass is broad and the SED is no longer photospheric. The IRS, allWISE, and MIPS data all indicate an infrared excess at , but the level of excess is still open to debate.
We also have some concerns about the photometry at due to the bright source east of the target, which may have led to over-subtraction of the sky background. We find it difficult to reproduce the “peakiness” of the SED at ; dust models that fit the flux ratio tend to over-predict the flux density and models that reproduce the flux ratio tend to under-predict the flux density. A low abundance of grains near the minimum size, as suggested by collisional cascade models that predict non power-law size distributions (Wyatt et al., 2011; Kenyon & Bromley, 2016), might improve the SED fit by decreasing the flux ratio. The SED model shown in Figure 9 is a compromise between the opposing constraints at 32 and . Reducing the maximum grain size that contributes to the emission from the 1 mm assumed for all disks could reduce the predicted flux density, but we doubt the physical realism of any model that includes small grains without a continuous size distribution extending to macroscopic grains. The uncertainties in the PACS and MIPS photometry (section IV) and the underlying photosphere model must be kept in mind when discussing the dust properties. Based on the infrared excess at both and , we strongly suggest follow-up observations of HD 105211 with both JWST and ALMA.
V.2. Dust Properties
We now turn our attention to the properties of the dust in our systems, including the disk radius, minimum grain size, location of dust relative to the parent planetesimal population, and possibility of planet sculpting. First, we find that all of the dust SEDs peak between and , which is typical of debris disks from the DUNES program (Krivov et al., 2013). We do not find any sources that are brighter at than , a feature which could indicate either a background galaxy in the beam (Gáspár & Rieke, 2014) or a disk of unstirred, primordial grains (Krivov et al., 2013). We diagnose the presence of superheated small grains by computing the parameter , the ratio of the disk radius from our SED models (in which dust temperature depends on grain size) to the disk radius if only blackbody grains were present:
| (2) | |||
| (3) |
In equation 3, is the temperature of blackbody grains, is the wavelength of maximum emission, and is the radius of the ring of blackbody dust. The disks in our sample have (Table 2). Although four out of five of our disks are not well enough resolved to measure disk sizes directly from the images, our SED-based values of agree well with studies of resolved debris disks (e.g. Rodriguez & Zuckerman, 2012; Booth et al., 2013). Each disk must contain a population of small grains that do not emit efficiently at wavelengths and so heat above the local blackbody temperature. Given the presence of small grains, our sources are most likely self-stirred or planet-stirred planetesimal belts with grain-producing collisional cascades, which is consistent with our assumption of (Pan & Schlichting, 2012; Matthews et al., 2014).
Dodson-Robinson et al. (2011) estimated blackbody temperatures for our target stars based on Spitzer IRS and MIPS (spectro)photometry at and . For the warmer debris systems HD 50554, HD 52265, and 105211, their estimates agree well with ours. For HD 33636 and HD 202206, the peak flux density is much redder than and the Herschel observations indicate colder blackbody temperatures than the Spitzer-based photometry. We emphasize that the SEDs modeled here are not based on blackbody grains—our comparison between single-temperature blackbody models simply highlights the importance of far-IR photometry in characterizing the debris rings.
The Spitzer IRS spectra provide the best constraint on minimum grain size. In the Rayleigh regime, where , the grain opacity declines with wavelength as , where for simple conductors and insulators (Draine, 2006). At , the center of the spectral window used by Dodson-Robinson et al. (2011) to detect infrared excesses, for . We find that the lack of Spitzer IRS fractional excesses at (with the exception of HD 105211) and the small, though detectable, excesses at exclude grains smaller than , as such grains would emit efficiently from . The minimum grain sizes predicted by our best-fit model SEDs are in good agreement with the Pawellek & Krivov (2015) SED-based measurements from 32 objects (see their Figure 4): all of their target stars with have .
There is, of course a degeneracy between and . As an example, one model of the HD 50554 debris disk has and , while another has AU and ; the difference between their reduced statistics is only 0.2. Yet the value of from the SED of the resolved source HD 105211 is in rough agreement with the measured size from the image (175 AU vs. 154 AU), suggesting that we have broken the degeneracy for at least one source. Indeed, we find it difficult to reproduce the measured flux ratios without setting a minimum grain size larger than the radiation-pressure blowout size of (Burns et al., 1979)
| (4) |
where and are the star luminosity and mass, is the radiation pressure coupling coefficient averaged over all frequencies in the stellar spectrum, and is the particle density (2.2 g cm-3 for astronomical silicate). In the geometric optics limit where for all values of , we find blowout size limits of for the range of star luminosities and spectral types in our sample. Intriguingly, Pawellek et al. (2014) and Pawellek & Krivov (2015) show that , the ratio of the true minimum grain size to the minimum predicted value from equation 4 (now with calculated self-consistently from grain optical properties), is a decreasing function of stellar luminosity, approaching unity for A-type stars but with larger values for Solar-type stars. Our results agree well with theirs: the most luminous star in our sample, HD 105211 with , has , while our least luminous star, HD 33636 with , has .
We suggest that our Herschel observations most likely trace dust near the “birth ring” (Strubbe & Chiang, 2006), where the source planetesimals reside. The largest grains that can emit like blackbodies at have radii set by , such that . The lifetime of a grain against Poynting-Robertson drag is
| (5) |
where is the speed of light. For grains, we find for all of the disks in our sample. The quantity for grains is between 0.7 and 6.5 for all systems except one; HD 50554 has age estimates that differ by a factor of 10 (3.3 Gyr from Bonfanti et al. (2015) vs. 0.33 Gyr from Chen et al. (2014)), so is either 1.6 or 16. Since the grains that can contribute significantly to the emission have lifetimes against radiative drag of at least 1/4 the star age, they are likely to be destroyed by collisions before migrating significantly. Similarly, all systems have (where ; is the radiation pressure force given and is the gravitational force) for grains, so their orbits are not substantially modified by radiation pressure. The dust ring widths from our SED fits are likely close to the true widths of the source planetesimal belts, with two caveats: (a) mutual grain collisions will increase the eccentricity dispersion and therefore the ring width (Thebault, 2009), and (b) our models do not account for the possibility that the small grains have a wider spatial distribution than the large grains—we assume all grain sizes are well mixed throughout the dust annulus. In reality, radiation pressure might push the smallest grains to wide or eccentric orbits (Burns et al., 1979; Gáspár et al., 2012) and create structures similar to the Pictoris, HR 8799, and HD 95086 “halos” seen in scattered light (Augereau et al., 2001; Su et al., 2009, 2015; Ballering et al., 2016). Pushing the small grains in the HD 105211 system to wider orbits might help resolve the conflict between the flux ratio and the flux density discussed in section V.1. The HD 105211 disk also has the smallest size ratio of any disk in the sample, so is most likely to be affected by radiation pressure. Follow-up with ground-based adaptive optics or the Hubble Space Telescope could detect scattered light from blowout-size grains. If our Herschel photometry traces the birth rings, our systems can be added to the list of debris disks with radii larger than the probable solar nebula radius of 80 AU (Kretke et al., 2012). Planetesimal formation seems to be a robust process even out to extremely large distances (Kenyon & Bromley, 2012).
Finally, many lines of evidence suggest that at least some planetesimal belts are sculpted by planets (e.g. Quillen & Thorndike, 2002; Chiang et al., 2009; Boley et al., 2012; Su & Rieke, 2014; Sai et al., 2015). Interestingly, the disk surrounding HD 50554 is a true Kuiper Belt analog in its spatial distribution, with a best-fit radius of 45 AU and ring half-width of 4 AU. Since HD 50554 is slightly younger than the sun (3.3 Gyr; Bonfanti et al., 2015), its disk may be similar to the Kuiper Belt at an earlier stage of evolution and may have a Neptune-like planet at its inner edge. In N-body simulations of planetesimal belts with giant planets orbiting just inside their inner edges, Rodigas et al. (2014) find that the width of the planetesimal belt increases with both planet mass and planet/disk semimajor axes. Here we find that the width of the best-fit dust ring roughly increases with distance from the star, from AU at AU for HD 50554 to AU for both HD 202206 ( AU) and HD 105211 ( AU), though the width of the ring becomes less observationally constrained as increases. However, we have no direct constraints on the presence or absence of planets on wide orbits, and we measure fractional dust luminosities of (Table 2), which are consistent with dust production from icy planetesimals stirred by Pluto-size dwarf planets Kenyon & Bromley (2010).
VI. Conclusions and Future Work
Here we have presented new Herschel and updated Spitzer photometry of five sunlike stars with debris disks of Kuiper Belt size and larger. Both extended structure in the images and SED fits from the Debris Disk Simulator (Wolf & Hillenbrand, 2005) indicate that the disks are not composed of blackbody grains; instead, small grains are present and disks are wider than their blackbody radii. As seen by Booth et al. (2013), the minimum grain sizes in the best-fit SEDs are in the size range, larger than the radiation pressure blowout size. All targets are younger than the sun (though still on the main sequence), so we may be seeing Kuiper Belt analogs at earlier phases of evolution. The disks have luminosities consistent with dust production from icy planetesimals stirred by Pluto-size bodies (Kenyon & Bromley, 2010). We also find that the Herschel emission likely emanates from the birth ring of planetesimals, so we add our targets to the growing list of Sunlike stars with planetesimals beyond the radius of the solar nebula. One caveat is that our SED models may not be unique: we assumed 100% astronomical silicate grains and did not consider mixtures of silicate, ice, and/or organic grains (though icy grain mantles will likely photoevaporate). Another unexplored possibility is that different grain sizes have different radial distributions.
Although three of the stars host planets discovered by Doppler searches (HD 50554, HD 52265, and HD 202206), the planets are on short-period orbits that should be dynamically decoupled from the debris disks. Any planets that sculpt the debris disks in this sample have not yet been detected. HD 33636 has an M6 companion in a AU orbit (Bean et al., 2007), indicating that the debris disk at 85 AU is circumbinary. HD 105211 may also be a spectroscopic binary, though Eggleton & Tokovinin (2008) find a single star more probable. HD 33636 and (possibly) HD 105211 complement previous detections of circumbinary debris disks, though there is some indication that the frequency of cold debris disks may be higher among single stars (Rodriguez et al., 2015). There is no conclusive evidence that any of our targets host “holey” debris disks which have planets in the gaps (Kennedy & Wyatt, 2014; Meshkat et al., 2015), though the IRS spectrum of HD 105211 may have a peak at (see section V.1).
Based on target declination, ALMA follow-up would be possible for HD 33636, HD 52265, HD 105211, and HD 202206. The most compelling target is HD 105211 due to both its brightness—0.7 Jy at —and its spatial extent of , wider than the disk surrounding the T Tauri star TW Hydrae. HD 33636 and HD 52265 are also good ALMA targets based on their extended structure in the Herschel PACS images. We also suggest JWST follow-up of HD 105211 using the (a) the MIRI coronagraph with the filter and (b) the MIRI low resolution spectrometer (LRS). Based on the allWISE W1 photometry, we find that the the Dodson-Robinson et al. (2011) photosphere model is likely accurate, which indicates that HD 105211 has a strong infrared excess at . Observations with JWST would allow us to precisely locate the inner edge of the cold debris ring and possibly detect a hot inner debris belt, if it exists.
Funding for this work was provided by NASA research support agreement 1524391. We thank Roberta Paladini of the HASA Herschel Science Center for guidance on data reduction and Sebastian Wolf for developing the publicly available Debris Disk Simulator tool. John Gizis and Neal Evans provided helpful input on data analysis methods. This research has made use of the following resources: (1) Herschel Interactive Processing Environment (HIPE) and the ipipe scripts for data reduction. (2) VizieR catalogue access tool, CDS, Strasbourg, France. The original description of the VizieR service was published in A&AS 143, 23. (3) NASA/IPAC Infrared Science Archive, which is operated by the Jet Propulsion Laboratory, California Institute of Technology, under contract with the National Aeronautics and Space Administration. (4) SIMBAD database, operated at CDS, Strasbourg, France; Wenger et al. (2000). (5) Herschel Science Archive, www.cosmos.esa.int/web/herschel/science-archive. (6) astropy python library for astronomy, www.astropy.org. (7) APLpy (Astronomical Plotting Library in Python), aplpy.github.io.
References
- Anderson et al. (2013) Anderson, K. R., Adams, F. C., & Calvet, N. 2013, ApJ, 774, 9
- Ardila et al. (2004) Ardila, D. R., Golimowski, D. A., Krist, J. E., et al. 2004, ApJ, 617, 147
- Augereau et al. (2001) Augereau, J. C., Nelson, R. P., Lagrange, A. M., Papaloizou, J. C. B., & Mouillet, D. 2001, A&A, 370, 447
- Ballering et al. (2016) Ballering, N. P., Su, K. Y. L., Rieke, G. H., & Gáspár, A. 2016, ApJ, 823, 108
- Balog et al. (2014) Balog, Z., Müller, T., Nielbock, M., et al. 2014, Experimental Astronomy, 37, 129
- Bean et al. (2007) Bean, J. L., McArthur, B. E., Benedict, G. F., et al. 2007, AJ, 134, 749
- Beichman et al. (2006) Beichman, C. A., Bryden, G., Stapelfeldt, K. R., et al. 2006, ApJ, 652, 1674
- Bessell (1990) Bessell, M. S. 1990, A&AS, 83, 357
- Bonfanti et al. (2015) Bonfanti, A., Ortolani, S., Piotto, G., & Nascimbeni, V. 2015, A&A, 575, 18
- Boley et al. (2012) Boley, A. C., Payne, M. J., Corder, S., et al. 2012, ApJ, 750, 21
- Booth et al. (2013) Booth, M., Kennedy, G., Sibthorpe, B., et al. 2013, MNRAS, 428, 1263
- Bryden et al. (2009) Bryden, G., Beichman, C. A., Carpenter, J. M., et al. 2009, ApJ, 705, 1226
- Burns et al. (1979) Burns, J. A., Lamy, P. L., & Soter, S. 1979, Icarus, 40, 1
- Chen et al. (2014) Chen, C. H., Mittal, T., Kuchner, M., et al. 2014, ApJS, 211, 25
- Chiang et al. (2009) Chiang, E., Kite, E., Kalas, P., Graham, J. R., & Clampin, M. 2009, ApJ, 693, 734
- Cutri et al. (2003) Cutri, R. M., et al. 2003, The IRSA 2MASS All-Sky Point Source Catalog, NASA/IPAC Infrared Science Archive, http://irsa.ipac.caltech.edu/applications/Gator
- Cutri et al. (2013) Cutri, R. M., et al. 2013, VizieR Online Data Catalog: AllWISE Data Release (Cutri+ 2013). VizieR Data Catalog 2328
- Dodson-Robinson et al. (2011) Dodson-Robinson, S. E., Beichman, C. A., Carpenter, J. M., & Bryden, G. 2011, AJ, 141, 11
- Draine (2006) Draine, B. T. 2006, ApJ, 636, 1114
- Duchêne et al. (2014) Duchêne, G., Arriaga, P., Wyatt, M., et al. 2014, ApJ, 784, 148
- Eggleton & Tokovinin (2008) Eggleton, P. P., & Tokovinin, A. A. 2008, MNRAS, 389, 869
- Eiroa et al. (2010) Eiroa, C., Fedele, D., Maldonado, J., et al. 2010, A&A, 518, L131
- Eiroa et al. (2013) Eiroa, C., Marshall, J. P., Mora, A., et al. 2013, A&A, 555, A11
- Gáspár et al. (2012) Gáspár, A., Psaltis, D., Özel, F., Rieke, G. H., & Cooney, A. 2012, ApJ, 749, 14
- Gáspár & Rieke (2014) Gáspár, A., & Rieke, G. H. 2014, ApJ, 784, 33
- Golimowski et al. (2011) Golimowski, D. A., Krist, J. E., Stapelfeldt, K. R., et al. 2011, AJ, 142, 30
- Gordon et al. (2005) Gordon, K. D., Rieke, G. H., Engelbracht, C. W. 2005, PASP, 117, 503
- Graciá-Carpio et al. (2015) Gracía-Carpio, J., Wetzstein, M., Roussel, H., & the PACS Instrument Control Centre Team. 2015, arXiv:1512.03252
- Gray et al. (2006) Gray, R. O., Corbally, C. J., Garrison, R. F., et al. 2006, AJ, 132, 161
- Greaves et al. (1998) Greaves, J. S., Holland, W. S., Moriarty-Schieven, G., et al. 1998, ApJ, 506, L133
- Hines et al. (2007) Hines, D. C., Schneider, G., Hollenbach, D., et al. 2007, ApJ, 671, L165
- Høg et al. (2000) Høg, E., Fabricius, C., Makarov, V. V., et al. 2000, A&A, 355, L27
- James (2013) James, D. J. 2013, PASP, 125, 1087
- Kalas et al. (2007a) Kalas, P., Duchêne, G., Fitzgerald, M. P., & Graham, J. R. 2007, ApJ, 671, L161
- Kalas et al. (2007b) Kalas, P., Fitzgerald, M. P., & Graham, J. R. 2007, ApJ, 661, L85
- Kennedy & Wyatt (2014) Kennedy, G. M., & Wyatt, M. C. 2014, MNRAS, 444, 3164
- Kenyon & Bromley (2010) Kenyon, S. J., & Bromley, B. C. 2010, ApJS, 188, 242
- Kenyon & Bromley (2012) Kenyon, S. J., & Bromley, B. C. 2013, ApJ, 143, 63
- Kenyon & Bromley (2015) Kenyon, S. J., & Bromley, B. C. 2015, ApJ, 806, 42
- Kenyon & Bromley (2016) Kenyon, S. J., & Bromley, B. C. 2016, ApJ, 817, 51
- Kretke et al. (2012) Kretke, K. A., Levison, H. F., Buie, M. W., & Morbidelli, A. 2012, AJ, 143, 91
- Krist et al. (2005) Krist, J. E., Ardila, D. R., Golimowski, D. A., et al. 2005, AJ, 129, 1008
- Krist et al. (2010) Krist, J. E., Stapelfeldt, K. R., Bryden, G., et al. 2010, AJ, 140, 1051
- Krivov et al. (2013) Krivov, A. V., Eiroa, C., Löhne, T., et al. 2013, ApJ, 772, 32
- Kurucz (1992) Kurucz, R. L. 1992, in IAU Symp. 149, The Stellar Populations of Galaxies, ed. B. Barbuy & A. Renzini (Dordrecht: Kluwer), 225
- Laher et al. (2012) Laher, R. R., Gorjian, V., Rebull, L. M., et al. 2012, PASP, 124, 737
- Laor & Draine (1993) Laor, A., & Draine, B. T. 1993, ApJ, 402, 441
- Liseau et al. (2008) Liseau, R., Risacher, C., Brandeker, A., et al. 2008, A&A, 480, L47
- Lutz (2010) Lutz, D. 2010. PACS photometer point spread function. Herschel Science Center, PICC-ME-TN-033, version 1.01
- Matthews et al. (2014) Matthews, B. C., Krivov, A. V., Wyatt, M. C., Bryden, G., & Eiroa, C. 2014, Protostars and Planets VI, 521
- McDonald et al. (2012) McDonald, I., Zijlstra, A. A., & Boyer, M. L. 2012, MNRAS, 427, 343
- Meshkat et al. (2015) Meshkat, T., Bailey, V. P., Su, K. Y. L., et al. 2015, ApJ, 800, 5
- Morales et al. (2013) Morales, F. Y., Bryden, G., Werner, M. W., & Stapelfeldt, K. R. 2013, ApJ, 776, 111
- Ott (2010) Ott, S. 2010, in ASP Conf. Ser. 434, Astronomical Data Analysis Software and Systems XIX, ed. Y. Mizumoto, K.-I. Morita, & M. Ohishi (San Francisco, CA: ASP), 139
- Pan & Schlichting (2012) Pan, M., & Schlichting, H. E. 2012, ApJ, 747, 113
- Pawellek & Krivov (2015) Pawellek, N., & Krivov, A. V. 2015, MNRAS, 454, 3207
- Pawellek et al. (2014) Pawellek, N., Krivov, A. V., Marshall, J. P., et al. 2014, ApJ, 792, 65
- Perryman et al. (1997) Perryman, M. A. C., et al. 1997, A&A, 323, L49
- Pilbratt et al. (2010) Pilbratt, N. M., Riedinger, J. R., Passvogel, T., et al. 2010, A&A, 518, L1
- Popesso et al. (2012) Popesso, P., Magnelli, B., Buttiglione, S., et al. 2012, arXiv:1211.4257
- Quillen & Thorndike (2002) Quillen, A. C., & Thorndike, S. 2002, ApJ, 578, L149
- Rodigas et al. (2014) Rodigas, T. J., Malhotra, R., & Hinz, P. M. 2014, ApJ, 780, 65
- Rodriguez et al. (2015) Rodriguez, D. R., Duchêne, G., Henry, T., et al. 2015, MNRAS, 449, 3160
- Rodriguez & Zuckerman (2012) Rodriguez, D. R., & Zuckerman, B. 2012, ApJ, 745, 147
- Saffe et al. (2008) Saffe, C., Gómez, M., Pintado, O., & González, E. 2008, A&A, 490, 297
- Sai et al. (2015) Sai, S., Itoh, Y., Fukugawa, M., Shibai, H., & Sumi, T. 2015, PASJ, 67, 20
- Strubbe & Chiang (2006) 2006, ApJ, 648, 652
- Su et al. (2015) Su, K. Y. L., Morrison, S., Malhotra, R., et al. 2015, ApJ, 799, 146
- Su & Rieke (2014) Su, K. Y. L., & Rieke, G. 2014, Exploring the Formation and Evolution of Planetary Systems, 299, 318
- Su et al. (2009) Su, K. Y. L., Rieke, G. H., Stapelfeldt, K. R., et al. 2009, ApJ, 705, 314
- Su et al. (2010) Su, K. Y. L., Rieke, G., Stapelfeldt, K., et al. 2010, BAAS, 42, 349
- Thebault (2009) Thébault, P. 2009, A&A, 505, 1269
- Trilling et al. (2008) Trilling, D. E., Bryden, G., Beichman, C. A., et al. 2008, ApJ, 674, 1086
- van Leeuwen (2007a) van Leeuwen, F. 2007, Astrophysics and Space Science Library, vol. 350
- van Leeuwen (2007b) van Leeuwen, F. 2007, A&A, 474, 653
- Wenger et al. (2000) Wenger, M., Ochsenbein, F., Egret, D., et al. 2000, A&AS, 143, 9
- Wolf (2003) Wolf, S. 2003, Computer Physics Communications, 150, 99
- Wolf & Hillenbrand (2005) Wolf, S., & Hillenbrand, L. A. 2005, Computer Physics Communications, 171, 208
- Wright et al. (2010) Wright, E. L., Eisenhardt, P. R. M., Mainzer, A. K., et al. 2010, AJ, 140, 1868
- Wyatt et al. (2011) Wyatt, M. C., Clarke, C. J., & Booth, M. 2012, Celestial Mechanics and Dynamical Astronomy, 111, 1
- Wyatt et al. (2005) Wyatt, M. C., Greaves, J. S., Dent, W. R. F., & Coulson, I. M. 2005, ApJ, 620, 492
| Instrument | Wavelength | Analysis Method | HD 33636 | HD 50554 | HD 52265 | HD 105211 | HD 202206 |
|---|---|---|---|---|---|---|---|
| MIPS | Chen et al. (2014) | a,ba,bfootnotemark: | bbOriginal source: IPAC IRSA Spitzer Enhanced Imaging Products Catalog, irsa.ipac.caltech.edu/data/SPITZER/Enhanced/Imaging | bbOriginal source: IPAC IRSA Spitzer Enhanced Imaging Products Catalog, irsa.ipac.caltech.edu/data/SPITZER/Enhanced/Imaging | ccOriginal source: Beichman et al. (2006) | ||
| MIPS | Su et al. (2010) | ||||||
| MIPS | Chen et al. (2014) | ddOriginal source: Trilling et al. (2008) | ddOriginal source: Trilling et al. (2008) | ddOriginal source: Trilling et al. (2008) | ccOriginal source: Beichman et al. (2006) | eeOriginal source: Bryden et al. (2009) | |
| MIPS | Su et al. (2010) | ||||||
| PACS | this work | ||||||
| PACS | this work | ||||||
| PACS | this work | ffDetection significance is between and . | undetected |
| Star | (AU)aaFlux density units are mJy. Photometry has not been color-corrected. | (AU)bbHalf-width of debris ring, assuming Gaussian number density profile for dust | ()ccMinimum grain size | ddDust mass | (K)eeTemperature of dust grains, assuming blackbody emission | (AU)ffRadius of disk of blackbody grains | gg | hhRatio of dust luminosity to star luminosity |
|---|---|---|---|---|---|---|---|---|
| HD 33636 | 85 | 12 | 3.0 | 46 | 37 | 2.3 | ||
| HD 50554 | 45 | 4 | 4.5 | 59 | 27 | 1.7 | ||
| HD 52265 | 70 | 10 | 3.0 | 58 | 32 | 2.2 | ||
| HD 105211 | 175 | 20 | 4.1 | 49 | 86 | 2.0 | ||
| HD 202206 | 105 | 20 | 3.0 | 45 | 40 | 2.7 |
| HD | Name | Spectral Type | (mag)aaDistance of the center of the dust ring from the star, computed from SED | (pc)bb Distances come from the Hipparcos reduction of van Leeuwen (2007a, b). | (this work) | (literature)cc Luminosities and ages from Bonfanti et al. (2015) unless otherwise indicated. | Age (Gyr)cc Luminosities and ages from Bonfanti et al. (2015) unless otherwise indicated. | Observation IDsdd Observation IDs recorded in Herschel Science Archive v7.1.1. Notation: 134226927[2/3] = cross-scan pair of 1342269272 and 1342269273. |
|---|---|---|---|---|---|---|---|---|
| 33636 | G0VH-03 | 7.06 | 28.7 | 1.05 | 1.08 | 2.5 | 134226927[2/3] | |
| 50554 | F8V | 6.84 | 31.0 | 1.51 | 1.37 | 3.3 | 134223115[2/3], 134226899[6/7], 134226899[8/9] | |
| 52265 | G0V | 6.30 | 28.1 | 2.04 | 2.08 | 2.6 | 134223156[4/5], 134226925[8/9] | |
| 105211 | Cru | F2V | 4.15 | 19.7 | 7.31 | 7.06ee Luminosity from McDonald et al. (2012). | 1.4ff Age from Chen et al. (2014). | 134226237[1/2], 134226237[3/4] |
| 202206 | G6V | 8.08 | 46.3 | 1.07 | 1.02 | 1.1 | 134221939[7/8], 134223168[6/7] |