Planck’s Dusty GEMS. II. Extended [CII] emission and absorption in the Garnet at z3.4 seen with ALMA††thanks: Based on data obtained with ALMA in program 2013.1.01230.S, and with EMIR on the IRAM 30 m telescope in program 223-13.
We present spatially resolved ALMA [CII] observations of the bright (flux density 400 mJy at 350 m), gravitationally lensed, starburst galaxy PLCK G045.161.1 at , the “Garnet”. This source is part of our set of “Planck’s Dusty GEMS”, discovered with the Planck’s all-sky survey. Two emission-line clouds with a relative velocity offset of km s-1 extend towards north-east and south-west, respectively, of a small, intensely star-forming clump with a star-formation intensity of M⊙ yr-1 kpc-2, akin to maximal starbursts. [CII] is also seen in absorption, with a redshift of km s-1 relative to the brightest CO component. [CII] absorption has previously only been found in the Milky Way along sightlines toward bright high-mass star-forming regions, and this is the first detection in another galaxy. Similar to Galactic environments, the [CII] absorption feature is associated with [CI] emission, implying that this is diffuse gas shielded from the UV radiation of the clump, and likely at large distances from the clump. Since absorption can only be seen in front of a continuum source, the gas in this structure can definitely be attributed to gas flowing towards the clump. The absorber could be part of a cosmic filament or merger debris being accreted onto the galaxy. We discuss our results also in light of the on-going debate of the origin of the [CII] deficit in dusty star-forming galaxies.
Key Words.:
galaxies: high-redshift1 Introduction
The bright 158 m line of singly ionized carbon, [CII]158, is one of the most versatile tracers of the interstellar gas in star-forming galaxies. With a low ionization potential, C+ is a probe of the cold neutral gas in galaxies, and can be associated with intensely star-forming environments (e.g., Stacey et al., 2010; Rigopoulou et al., 2014) and diffuse gas (e.g. Langer et al., 2010; Gerin et al., 2015). It is the main coolant of the cold neutral medium (Bennett et al., 1994), and the most luminous line of gas heated by UV photons from star formation over wide ranges of density and UV intensity (e.g., Goldsmith et al., 2012; Le Petit et al., 2006; Kaufman et al., 1999), but can also be bright in shocked gas (Appleton et al., 2013). The diversity of environments and gas conditions probed by [CII] (Rawle et al., 2013; Boone et al., 2014; Schaerer et al., 2015; Knudsen et al., 2016) entail that many empirical properties of [CII] are not yet very well understood, especially at high redshift.
Here we present spatially resolved ALMA cycle 2 observations of [CII] in a strongly gravitationally lensed dusty starburst galaxy at z, G045.161.1 (“the Garnet”), which was discovered using th Planck all-sky survey, and was subsequently confirmed with SPIRE imaging (Planck Collaboration XXVII, 2015), and through ground-based observations (Cañameras et al., 2015, C15 hereafter). The Garnet consists of four counter-images seen behind a small group of galaxies at a spectroscopic redshift of z0.56 ( C15, ), which together reach a peak flux density of 400 mJy at 350 m as seen with SPIRE. The spectral energy distribution (SED) of the dust is consistent with star formation, without obvious signs of AGN contamination ( C15, ). Here we focus on the brightest of the four counter-images, which contributes 46 % of the total flux at 850 m seen with the SMA ( C15, ). The SMA recovers over 90 % of the total flux measured with SCUBA-2 at the same wavelength. Our ALMA data resolve the [CII] emission into two clouds at different velocities, around an intensely star-forming clump, against which [CII] is seen in absorption. To our knowledge, no such absorption line has previously been found outside the Milky Way, where it is seen against massive star-forming clouds and is a tracer of the diffuse interstellar medium (ISM, Gerin et al., 2015). Throughout the paper we adopt a flat H70 km s-1 Mpc-1 concordance cosmology with and =0.7.
2 Observations and data reduction
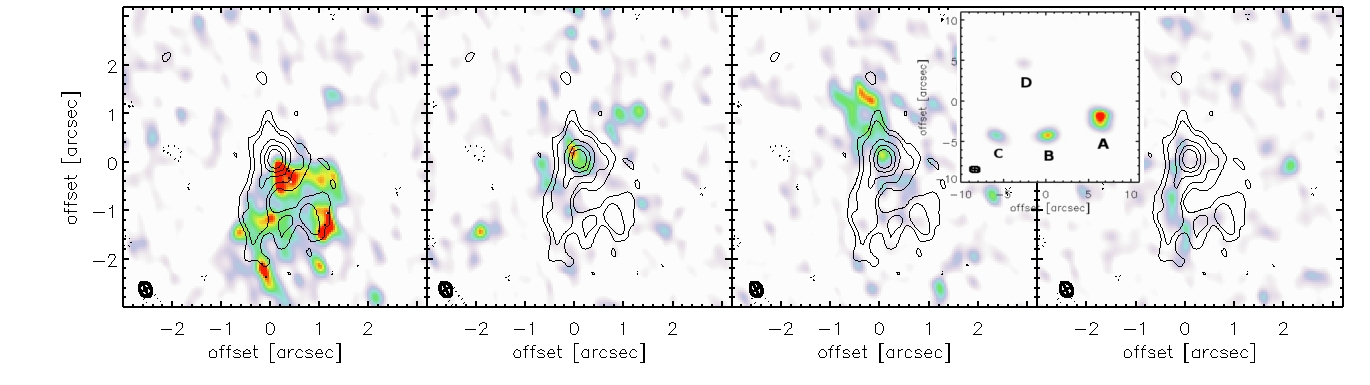
. Contours show the continuum in the line-free spectral windows and are given for 3, 5, 10, 15, and 20. Negative contours are . The inset shows the SMA 850 m image with all counter images; the gray circle is the primary beam of ALMA. The other panels show image A. The ALMA beam size in the lower left corner of each map corresponds to 150 pc at z=3.4 (for ).
ALMA observed our Cycle 2 project with 37 antennae on 6 June, 2015 and obtained 27 min of band 8 data in the C34-3 configuration, tuned to the [CII] line (428.775 GHz sky frequency) in one spectral window. Three more windows were placed on the line-free continuum. The intrinsic channel width was 15.6 MHz in all spectral windows, yielding a total bandwidth of 1.856 GHz per window after flagging the edge channels. This corresponds to about 1300 km s-1 at z=3.4, sufficient to cover all [CII] emission, assuming a line profile similar to CO(4-3), which we used as reference. One spectral window had four times higher noise levels on average, which is due to the nearby telluric oxygen line at 424.8 GHz and was ultimately not used in the analysis.
We used the standard manual scripts for ALMA reduction with the Common Astronomy Software Application CASA, and CLEAN to construct the synthesized beam-deconvolved images of the frequency data cubes. The spectral channels were rebinned to a width of 50 km s-1. The major and minor axis size of the beam is 0.41″0.27″ along PA13.5∘, The largest angular scale is 3.9″, and the primary beam size 12″. The rms is 1.3 mJy in each 50 km s-1 channel, and 0.46 Jy in the averaged continuum image extracted from spectral windows 1 and 2.
In addition, we also used the CO(4-3) line from C15 and the [CI] line corresponding to the transition of atomic carbon at 492.16 GHz in the rest frame, which we observed during the same campaign with EMIR on the IRAM 30 m telescope with a 20″ beam. Our [CI] detection also confirmed the redshift of the Garnet. At , the line falls at (111.1830.015) GHz. Observations were carried out on 2 March, 2014, under good and stable conditions, for a total observing time of 81 min. Observations and the data reduction are described in C15. The integrated apparent line flux of [CI](1-0) is (8.61.6) Jy km s-1, with a peak brightness temperature of 3.3 mK, and FWHM120) km s-1. The integrated [CI] luminosity is K km s-1 pc2, and we estimate a gas mass of M⊙, a factor of 2 higher than previously estimated in C15 from CO(4-3), and broadly confirming our previous choice of a low CO-to-H2 conversion factor in C15. All values are uncorrected for the gravitatonal magnification factor . The 3PP1 [CI](2-1) line at 809 GHz is inaccessible from the ground at z=3.43. We made this estimate using the relation reported in Papadopoulos et al. (2004) and Wagg et al. (2006), , where is the luminosity distance at redshift z, the abundance of atomic carbon in the ISM in units of , and the Einstein coefficient in units of s-1. captures the population of the upper and lower level of the transition (Papadopoulos et al., 2004)
3 Observed morphologies and spectrum
We used the line-free continuum image from spectral windows 1 and 2 to estimate the continuum flux density in each spaxel of the [CII] cube and subtracted this value from every spectral bin. We also corrected for the (insignificant) brightening of the dust continuum by 2% between the line and continuum windows expected for an apparent dust temperature, K (C15).
Fig. 1 shows the channel maps of the two extended emission line regions (EELRs) as seen in the image plane, which are offset by 564 km s-1 from each other (redshifted and blueshifted channels, respectively), and centered on a small continuum clump with high surface brightness. The integrated spectral properties of each region are listed in Table 1. Each EELR extends about ″ radially from the continuum source, but the southwestern region is much wider in tangential direction, 2.2″ instead of 0.9″ measured for the northeastern region (all sizes are 3 isophotal sizes).This might either represent differences in the intrinsic gas properties or in the gravitational magnification. In either case, the strong sudden velocity offset, which is larger than the FWHM of the individual clouds, shows that the [CII] lines do not probe large-scale rotational motion, but are two kinematically separated clouds.
| Component | Velocity | FWHM | ||||
|---|---|---|---|---|---|---|
| [Jy km s-1] | [km s-1] | [km s-1] | [ K km s-1 pc2] | [] | ||
| Blue EELR | 52.40.6 | -46715 | 20220 | 9.50.7 | 210.2 | 21 |
| Red EELR | 8.30.6 | 9736 | 21350 | 1.50.2 | 3.30.2 | 22 |
| Clump | 4.80.6 | -41847 | 19066 | 0.870.1 | 1.90.2 | 10 |
| 8.730.8 | 035 | 27449 | 1.50.1 | 3.50.3 | 10 | |
| Absorber | -0.600.15 | 34334 | 12425 | 10 |
We used Lenstool (Kneib et al., 1996; Jullo et al., 2007) to construct a gravitational lens model from the positions of the four images seen in Fig. 2 of C15, and calculated the magnification of each image, assuming that all four are multiple images of the same region. The average magnification at the position of the bright star-forming clump is , while and for the blueshifted and redshifted gas, respectively. We will present a more detailed analysis of the lensing configuration when our scheduled Hubble Space Telescope imaging has been taken (GO-14223/PI Frye). The present analysis does not strongly depend on the details of the lens modeling, because the most important physical parameters (surface brightnesses, velocities) are not directly affected by the lensing.
The continuum clump is marginally resolved, with a FWHM size of 0.660.01″0.510.01″ along the major and minor axis, respectively, compared to a beam size of FWHM0.410.27″. The continuum flux density of the clump within 2 the FWHM beam size is 42.9 mJy, corresponding to that expected for a modified blackbody with and ( C15, ). The clump alone contributes 28% of the total FIR luminosity of G045.161.1. Another 18% comes from faint, diffuse emission associated with the two emission-line regions (Fig. 1), the remaining flux comes from the other lensed images shown in the inset of Fig. 1. Adopting a conversion from , integrated between 8 m and 1000 m, and star formation rate, SFR, of SFR [M⊙ yr-1] W (Kennicutt, 1989), and the apparent size of the clump of 0.66″0.51″, this implies an average star-formation intensity of 220 M⊙ yr-1 kpc-2, which is in the range of maximal starbursts (Elmegreen, 1999).
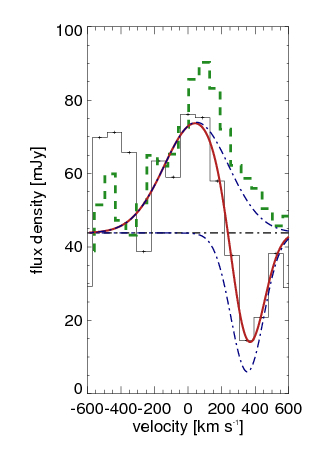
In Fig. 1 we also show the spectrum extracted from an aperture with 1.2″ diameter centered on the bright continuum source. As expected from the strong velocity jump in this region (also visible in the channel maps), we see both velocity components, one at km s-1 from the systemic redshift of measured at the [CI] peak and one at km s-1. Line emission is faint near the bright star-forming clump; most flux comes from the extended blueshifted and redshifted EELRs (Fig. 1 and Table 1). In addition, we also see an absorption feature around velocities of 350 km s-1. The depth of the absorption trough was measured from the normalized spectrum to be , and other fit parameters are listed in Table 1.
We examined whether this feature might be an observational artifact. The line is resolved into at least five spectral channels and does not depend on the specific choice of aperture size or CLEAN parameters used in the reduction. It is also apparent in the dirty maps. We do not detect any strongly negative regions in the maps, and our field does not contain bright sources that could cause strong negative signals. The spectra in the continuum spectral windows are flat, and neither the check source nor the phase calibrator show a corresponding amplitude drop. We therefore conclude that there is no evidence that the absorption-line feature in G045.161.1 is spurious.
4 Astrophysical nature of [CII] in the Garnet
Our ALMA data show a rich environment with two kinematically offset emission-line clouds around a bright star-forming clump, and another component is seen in absorption. For a magnification factor of , the FIR luminosity of the clump implies 400 M⊙ yr-1 of star formation, an order of magnitude greater than in massive star clusters in the Milky Way and nearby galaxies ( M⊙ yr-1, Larsen & Richtler, 2000).
We used the PDR models of Kaufman et al. (1999) to derive the average gas properties from the [CII] luminosities obtained with ALMA, the CO(4-3) luminosity of C15, and the [CI] 1-0 luminosity (Sect. 2). From the ratios 13 and 1, we estimate that the gas in the Garnet is on average exposed to a radiation field times greater than in the solar neighborhood, and has a density of about cm-3. To derive these line ratios, we corrected the [CI] 1-0 and CO(4-3) luminosities by a factor of 0.46 to take into account that the fainter images are also in the beam, and we assumed that the gas probed by the CO line emission is optically thick.
[CII] emission extends over at least 1200 km s-1 in the Garnet, over a small area of kpc in the source plane (assuming as suggested by our preliminary lensing analysis, see Sect. 3). It is therefore interesting that the Garnet has only redshifted, and no blueshifted [CII] absorption. Unlike EELRs, where blue- and redshifts may either indicate outflows or inflows from the host galaxy (because the gas may be in front of the galaxy or behind it), redshifted absorption is always found in front of the emitter, and therefore a unique signature of an inflow, not an outflow. The [CI] emission line shows a distinct wing at the same velocity as the [CII] absorption. This is also characteristic of [CII] absorption in the Milky Way. Gerin et al. (2015) have shown that both lines can simultaneously arise from gas with similar conditions. By analogy with the Milky Way, we also assume that the line we see consists of multiple deep narrower absorption components that sample a velocity range of 120 km s-1. This might be the intrinsic velocity range of multiple clouds in a filament or merger debris. Even in the Milky Way, where average velocity dispersions in the ISM are about 10 km s-1, the total width over which absorption is found is known to be up to km s-1.
We followed Gerin et al. (2015) to estimate a column density of the absorbing gas. With their Eq. (1) originally taken from Goldsmith et al. (2012) to derive a C+ column density, , we find cm-2, corresponding to cm-2 when adopting the Galactic carbon abundance of . This choice is reasonable for massive dusty starburst galaxies at high redshift, which have gas-phase metallicities comparable to those in the Milky Way (Takata et al., 2006; Nesvadba et al., 2007), but might be too high for infall of more pristine gas. For solar metallicity, this column density is about a factor of 2 higher than the most extreme values found in the Milky Way, and is accordingly more suitable for lower metallicity gas. The implied total column density of neutral gas is comparable to those estimated for H2 from the CO emission-line surface brightness (Swinbank et al., 2011, Canameras et al., 2016, in prep.) and also plausible here, given our gas mass estimate from [CI].
It is impossible to estimate a total mass from an absorption line, therefore we constrained the total mass within this region from the flux in the red wing of [CI], that coincides in velocity with the [CII] absorption (Fig. 1). The wing contains 26% of the [CI] 1-0 flux, and M⊙ in mass (for ), comparable to the total molecular gas content of high-z starbursts (e.g., Tacconi et al., 2008). Carbon is easily ionized (e.g., Goldsmith et al., 2012), and the absorber must therefore be effectively shielded from the intense UV radiation of the clump, and cannot be associated with intense star formation. The absorber is most likely located at a large distance from the clump, potentially several kpc. A velocity offset of 350 km s-1 is also too large for the gas to be associated with the clump itself, and is comparable to velocity dispersions of massive low-redshift galaxies (Bernardi et al., 2005), suggesting the gas is bound to the host galaxy. The Garnet provides a rare opportunity to study gas in a high-redshift galaxy outside of intense star-forming regions, and possibly even infalling gas from a cosmic filament, merger debris or satellite accretion.
The blue- and redshifted EELRs extend from a massive star-forming clump, which could be probing a wind. We used the recent empirical analysis of Heckman et al. (2015) of momentum-driven winds in intensely star-forming low-redshift galaxies to show that this scenario is unlikely, and alternative explanations, such as overlapping gas clouds in a star-forming region or merger, are more realistic. Heckman et al. (2015) argued that winds will escape if the momentum input from star formation is a critical value that depends on the column density, , and circular velocity, , of the galaxy. We used the 400 km s-1 velocity of the absorbing gas to approximate the circular velocity of the Garnet at large distances.
Using Eq. (3) of Heckman et al. (2015), we found dyn, for a fiducial cloud distance of 100 pc from the starburst. The critical momentum increases linearly with increasing distance. We also adopted cm-2, 400 km s-1, and used the mass per molecule, that is g. is set by the gas mass surface density estimates of 0.4 and M⊙ kpc-2 implied by the [CI] line profile, assuming that [CI] and [CII] have the same morphology. Assuming (again following Heckman et al., 2015) that the combined momentum flux from ram and radiation pressure in the star-forming clump is SFR dyn, we find a total momentum input from star formation of dyn for SFR400 M⊙ yr-1. Following Heckman et al. (2015), this may be enough to balance gravity, but not to form a wind that escapes, the main difference to low-redshift galaxies being the high column densities. Of course, this does not rule out the presence of fainter more energetic wind components, as reported for unlensed galaxies (Maiolino et al., 2012; Cicone et al., 2015).
5 Implications for high-z galaxies and conclusions
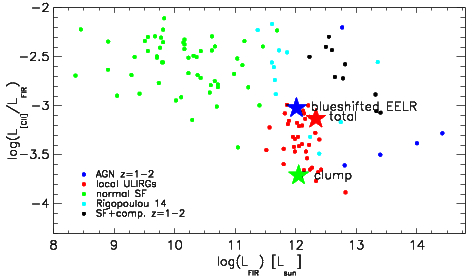
It is also interesting to investigate how our sources relate to dusty star-forming galaxies at high redshifts in the field, where we have more comprehensive knowledge of the global properties, but lack the detailed spatially resolved information that only strong lensing can provide. Infrared-selected, intensely star-forming galaxies at low redshift show a marked deficit in [CII] luminosity relative to the total FIR luminosity, compared to galaxies with lower star formation rates and less extinction; this is a trend that is rarely found at high redshift (Rigopoulou et al., 2014, Malhotra et al. 2016). We show in Fig. 3 where the Garnet lies relative to other populations of low- and high-redshift galaxies. The absorption does not lower the continuum luminosity, which is derived from the integrated flux between 8 and 1000m in the rest-frame. The blue EELR falls into the region of the diagram, in which distant and nearby star-forming galaxies, and local ULIRGs overlap, whereas the aperture centered on the clump lies near the extreme end of the local ULIRG sample. This highlights the fact that unresolved observations of high-redshift galaxies sample wide ranges of intrinsic line ratios. The integrated spectrum of the Garnet lies very close to the blue EELR, suggesting that the global [CII]/FIR ratios are dominated by the global spatial distribution and sizes of gas clouds within star-forming regions, and do not reflect the properties of individual star clusters.
These ALMA data of G045.161.1 at , the first of Planck’s Dusty GEMS, shows that [CII] at high redshift probes a wide range of environments, from the dense gas irradiated by UV photons from maximally star-forming clumps to the diffuse interstellar gas at large distances seen in absorption. Although we found signatures of [CII] spanning at least 1200 km s-1, we did not detect strong evidence for a wind that would regulate star formation by removing the gas reservoirs, as is often suggested in starburst-driven wind scenarios. This might indicate that broad wings of [CII] and other lines in high-redshift galaxies probe a much richer phenomenology than previously thought. Deeper higher-resolution observations spanning a wider spectral range will open an interesting new window to study the cold neutral gas in intense high-redshift starburst galaxies, including the ambient gas outside of the intense star-forming regions.
Acknowledgments
We thank the ALMA staff for carrying out the observations, and the team at the ARC in Grenoble for their help with preparing the data taking. We also thank the referee for suggestions that helped improve the paper. NPHN wishes to acknowledge funding through the JAO within their visiting scientists program, and is grateful for their hospitality during her stay as a science visitor in Vitacura.
References
- Appleton et al. (2013) Appleton, P. N., Guillard, P., Boulanger, F., et al. 2013, ApJ, 777, 66
- Bennett et al. (1994) Bennett, C. L., Fixsen, D. J., Hinshaw, G., et al. 1994, ApJ, 434, 587
- Bernardi et al. (2005) Bernardi, M., Sheth, R. K., Nichol, R. C., et al. 2005, AJ, 129, 61
- Boone et al. (2014) Boone, F., Combes, F., Krips, M., et al. 2014, in SF2A-2014: Proceedings of the Annual meeting of the French Society of Astronomy and Astrophysics, ed. J. Ballet, F. Martins, F. Bournaud, R. Monier, & C. Reylé, 381–385
- Cañameras et al. (2015) Cañameras, R., Nesvadba, N. P. H., Guery, D., et al. 2015, A&A, 581, A105
- Cicone et al. (2015) Cicone, C., Maiolino, R., Gallerani, S., et al. 2015, A&A, 574, A14
- Elmegreen (1999) Elmegreen, B. G. 1999, ApJ, 517, 103
- Gerin et al. (2015) Gerin, M., Ruaud, M., Goicoechea, J. R., et al. 2015, A&A, 573, A30
- Goldsmith et al. (2012) Goldsmith, P. F., Langer, W. D., Pineda, J. L., et al. 2012, ApJS, 203, 13
- Heckman et al. (2015) Heckman, T. M., Alexandroff, R. M., Borthakur, S., et al. 2015, ApJ, 809, 147
- Jullo et al. (2007) Jullo, E., Kneib, J.-P., Limousin, M., et al. 2007, New Journal of Physics, 9, 447
- Kaufman et al. (1999) Kaufman, M. J., Wolfire, M. G., Hollenbach, D. J., et al. 1999, ApJ, 527, 795
- Kennicutt (1989) Kennicutt, Jr., R. C. 1989, ApJ, 344, 685
- Kneib et al. (1996) Kneib, J.-P., Ellis, R. S., Smail, I., et al. 1996, ApJ, 471, 643
- Knudsen et al. (2016) Knudsen, K. K., Richard, J., Kneib, J.-P., et al. 2016, ArXiv e-prints
- Langer et al. (2010) Langer, W. D., Velusamy, T., Pineda, J. L., et al. 2010, A&A, 521, L17
- Larsen & Richtler (2000) Larsen, S. S. & Richtler, T. 2000, A&A, 354, 836
- Le Petit et al. (2006) Le Petit, F., Nehmé, C., Le Bourlot, J., et al. 2006, ApJS, 164, 506
- Maiolino et al. (2012) Maiolino, R., Gallerani, S., Neri, R., et al. 2012, MNRAS, 425, L66
- Nesvadba et al. (2007) Nesvadba, N. P. H., Lehnert, M. D., Genzel, R., et al. 2007, ApJ, 657, 725
- Papadopoulos et al. (2004) Papadopoulos, P. P., Thi, W.-F., & Viti, S. 2004, MNRAS, 351, 147
- Planck Collaboration XXVII (2015) Planck Collaboration XXVII. 2015, A&A, 582, A30
- Rawle et al. (2013) Rawle, T. D., Egami, E., Bussmann, R. S., et al. 2013, ArXiv e-prints
- Rigopoulou et al. (2014) Rigopoulou, D., Hopwood, R., Magdis, G. E., et al. 2014, ApJ, 781, L15
- Schaerer et al. (2015) Schaerer, D., Boone, F., Jones, T., et al. 2015, A&A, 576, L2
- Stacey et al. (2010) Stacey, G. J., Hailey-Dunsheath, S., Ferkinhoff, C., et al. 2010, ApJ, 724, 957
- Swinbank et al. (2011) Swinbank, A. M., Papadopoulos, P. P., Cox, P., et al. 2011, ApJ, 742, 11
- Tacconi et al. (2008) Tacconi, L. J., Genzel, R., Smail, I., et al. 2008, ApJ, 680, 246
- Takata et al. (2006) Takata, T., Sekiguchi, K., Smail, I., et al. 2006, ApJ, 651, 713
- Wagg et al. (2006) Wagg, J., Wilner, D. J., Neri, R., et al. 2006, ApJ, 651, 46