![[Uncaptioned image]](/html/1610.01031/assets/x1.png)
Progress towards a universal family of UV-IR extinction laws
Jesús Maíz Apellániz1,
Emilio Trigueros Páez2,
Azalee K. Bostroem3,
Rodolfo H. Barbá4,
and
Christopher J. Evans5
1
Centro de Astrobiología, CSIC-INTA, Madrid, Spain
2 Universidad Complutense, Madrid, Spain
3 University of California Davis, California, U.S.A.
4 Universidad de La Serena, La Serena, Chile
5 U.K. Astronomy Technology Centre, ROE, Edinburgh, U.K.
Abstract
We present our progress on the study of extinction laws along three diferent lines. [a] We compare how well different families of extinction laws fit existing photometric data for Galactic sightlines and we find that the Maíz Apellániz et al. (2014) family provides better results than those of Cardelli et al. (1989) or Fitzpatrick (1999). [b] We describe the HST/STIS spectrophotometry in the 1700-10 200 Å range that we are obtaining for several tens of sightlines in 30 Doradus with the purpose of deriving an improved wavelength-detailed family of extinction laws. [c] We present the study we are conducting on the behavior of the extinction law in the infrared by combining 2MASS and WISE photometry with Spitzer and ISO spectrophotometry.
1 Don’t we know everything about extinction laws already?
The answer to that question is no, not really. Here are some of the pending issues regarding extinction laws:
-
•
In the mid-infrared (MIR): how do the water, aliphates, and silicates features vary among sightlines?
-
•
In the near-infrared (NIR): what is the slope of the power law that is commonly used to characterize the extinction law? Is it universal?
-
•
In the optical range: what is the functional form of the extinction law? How do you include the diffuse interstellar bands (DIBs)? Can we find sightlines to measure the extinction law from 3000 Å to 30 m continuously?
-
•
Are the IR/optical and the ultraviolet (UV) extinction laws correlated or not?
Some of the problems above are related to the lack of data e.g. very few UV sightlines have been measured at low metallicity. Others are due to the existence of published works with calibration issues or with outdated methods. Once we solve those questions we can attack with confidence more profound ones such as how the extinction law varies as a function of the type of environment. Considering that extinction affects a large number of astronomical measurements, it is important we undersatnd how to correct for it.
2 What are we doing about it?
Here we describe our work on the field of extinction. We have already published the following:
-
•
A new family of optical/NIR extinction laws (Maíz Apellániz et al. 2014a) based on modern 30 Doradus data.
-
•
New UV sightlines in the SMC that are different from previous ones (Maíz Apellániz & Rubio 2012).
-
•
A preliminary analysis of the IR extinction (Maíz Apellániz 2015a).
-
•
The relationship between the optical DIBs and extinction (Maíz Apellániz et al. 2014b, Maíz Apellániz 2015b).
-
•
Studies of specific sightlines (Arias et al. 2006, Maíz Apellániz et al. 2015a, 2015b, 2015c).
- •
We currently have three different open lines and in this contribution we discuss their status. They are:
-
•
Comparing different families of extinction laws in the Galaxy.
-
•
STIS 1700-10 200 Å spectrophotometry of 30 Doradus OB stars.
-
•
A study of the IR extinction with photometry and spectrophotometry.

3 Comparing extinction-law families
Data. We have collected optical-NIR photometry for the GOSSS I+II+III sample (Sota et al. 2011, 2014, Maíz Apellániz et al. 2016). All targets have Johnson and 2MASS , some have Tycho-2 and/or Strömgren .
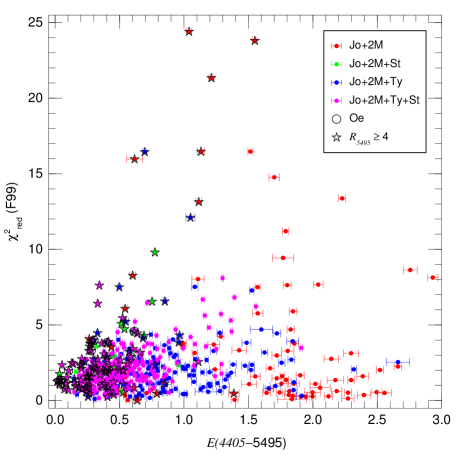
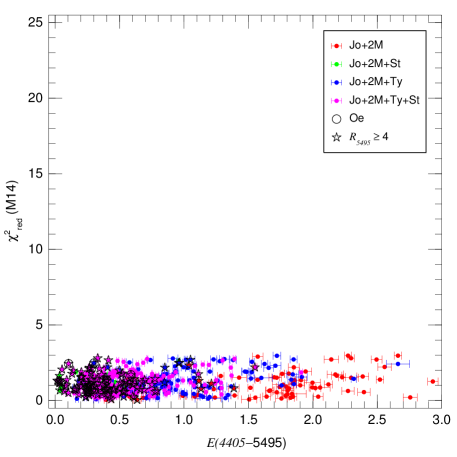
What have we done? We fit the amount [] and type [] of extinction for each star using CHORIZOS (Maíz Apellániz 2004, 2013b) and three families of extinction laws: F99 (Fitzpatrick 1999), CCM (Cardelli et al. 1989) and M14 (Maíz Apellániz et al. 2014a). See Fig 1.
Results. We first study which family provides better fits to the data.
-
•
F99: poorest fits of all three families, especially for large values of .
-
•
CCM: overall better than F99 except for targets with Strömgren photometry due to its use of a seventh-degree polynomial in for interpolation in the optical.
-
•
M14: best fits of all, with a reduced always under 3.0.
We point out that even though the M14 family was derived using 30 Doradus data, it provides a better description of Galactic optical-NIR extinction than either the F99 or CCM families.
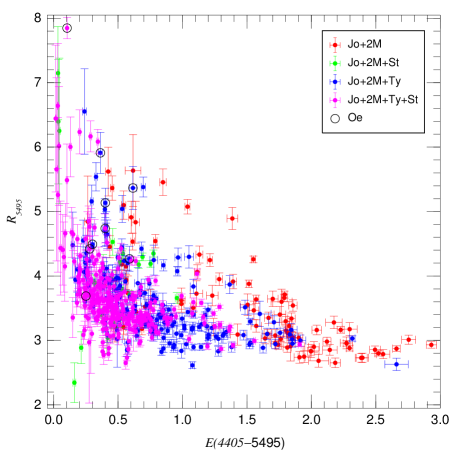
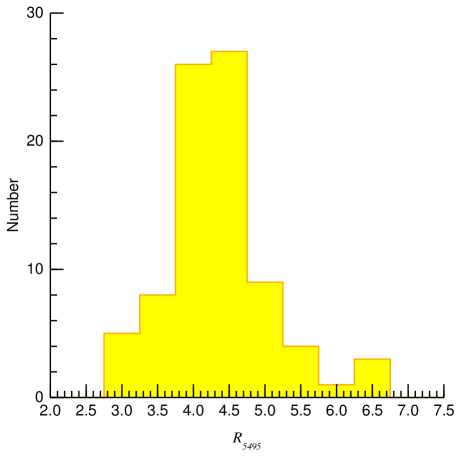
Once we have determined that the M14 family provides the best results of the three, we show in Fig. 2 some of the results found for and .
-
•
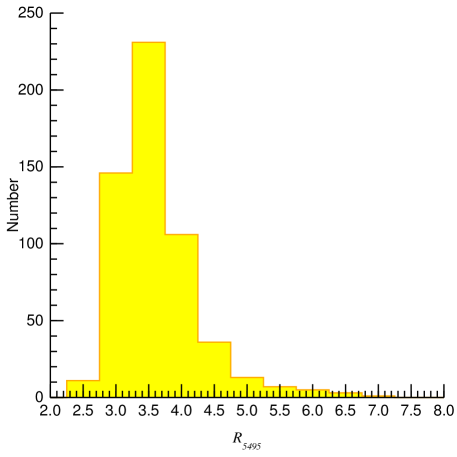
As previously known, the majority of Galactic sightlines have between 3.0 and 3.5.
-
•
At very low extinctions [] the error bars on are too large to yield significant results.
-
•
There are few stars with (sightlines with many small dust grains) but they are dominant among objects with large extinction.
-
•
In the range there is a significant fraction of stars with large values of . Those sightlines are depleted in small grains and are associated with H ii regions.
-
•
The histograms for the Galaxy and 30 Doradus are markedly different, with the latter showing a larger fraction of high- sightlines. The differences can be explained by [a] the lower values of and [b] the larger fraction of H ii region sightlines in 30 Doradus.
4 30 Doradus with STIS
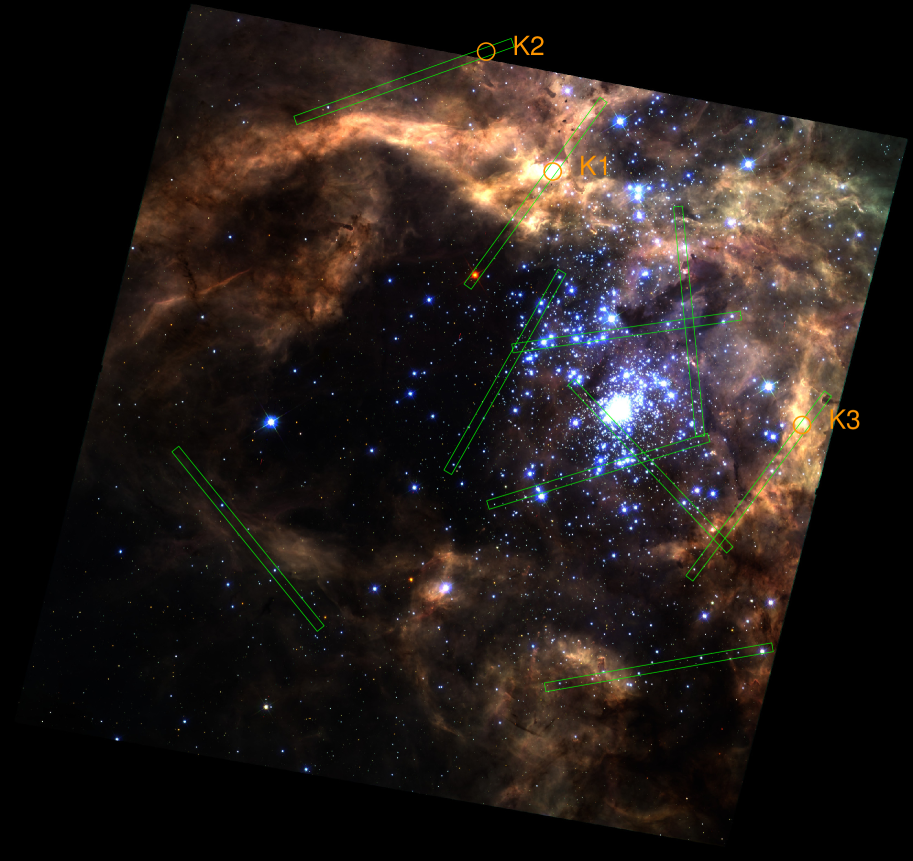
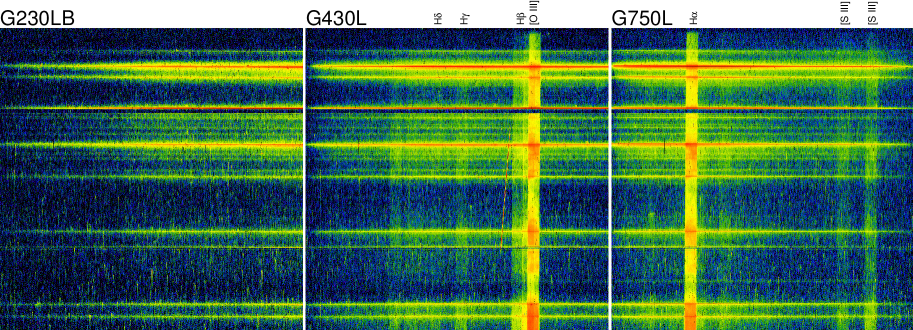
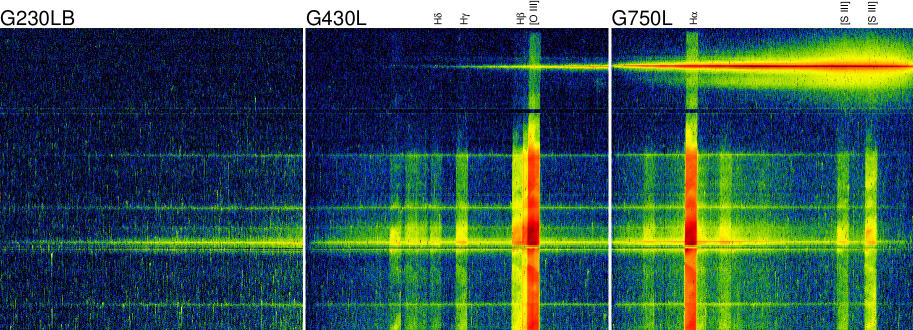
We are obtaining 10 visits of HST/STIS spectrophotometry under GO program 14 104 (9 of them have been executed as of October 2016, Fig. 3). For each visit we use three gratings, G230LB+G430L+G750L, in order to continuously cover the 1700-10 200 Å range. We use the 2′′-wide slit in order to obtain data for for 30 OB stars (Figs. 4 and 5). The stellar spectra are extracted with MULTISPEC (Maíz Apellániz 2005b) to correctly eliminate nebular contamination. The stars were selected to probe different environments: H ii region, diffuse ISM, and molecular gas. The questions we want to answer are:
-
•
What are the UV-NIR detailed (100 Å resolution) extinction laws?
-
•
Is the Whitford (1958) knee real and does it exist for all values of ?
-
•
Are there real differences between the Galactic and 30 Doradus UV extinction laws?
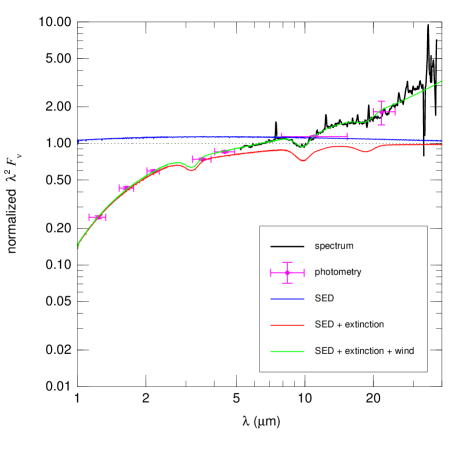
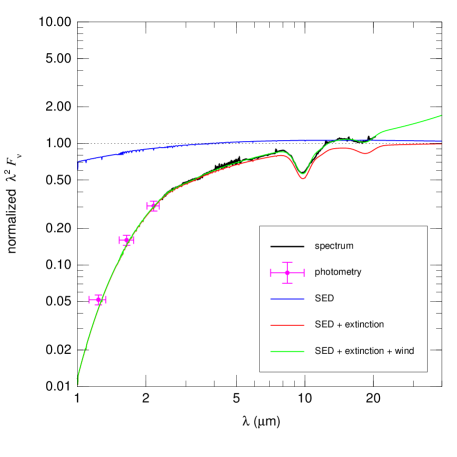
5 Infrared extinction
We aim to derive a detailed IR extinction law for OB stars in the solar neighborhood; tie it up with the optical extinction law finding appropriate sightlines; and analyze possible variations, checking if there is a relationship with . Our strategy is:
-
•
Collect Spitzer+ISO spectrophotometry and Spitzer photometry for GOSSS stars.
-
•
Collect and reprocess WISE photometry.
-
•
Use WISE imaging to determine the type of environment.
-
•
Combine the data to fit: [a] atmosphere SED, [b] wind, and [c] extinction law for each sightline (Fig. 6).
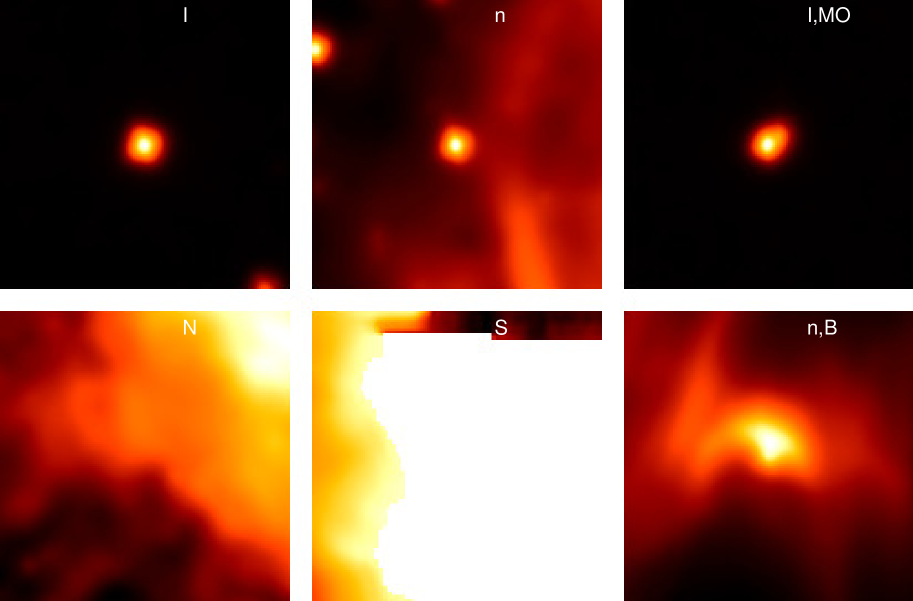
In the process of measuring the MIR extinction law, we collected and reprocessed the WISE photometry for the GOSSS I+II+III sample. We tested the validity of the W1+W2+W3+W4 photometry comparing the results from the All-Sky (Cutri et al. 2012) and AllWISE (Cutri et al. 2013) data releases. We compared the PSF photometry from the data releases with new aperture photometry using a realistic sky evaluation. We also derived saturation corrections and identified cases with large uncertainties. We will use our results to study the relationship between extinction and the environment.
-
•
WISE W3+W4 can be used to identify the presence of the warm dust associated with H ii regions, detecting them even at high extinctions.
-
•
We morphologically classified the sample using the WISE images (Fig. 7) in order to study possible variations in the extinction law.
-
•
We use the following main flags: I (isolated), n (weak nebulosity), N (strong nebulosity), S (saturated background i.e. bright H ii region).
-
•
We use the following optional flags: MO (hidden multiplicity in WISE, optical companion), MI (hidden multiplicity in WISE, IR companion), B (bow shock visible).
References
- •
- •
- •
- •
- •
- •
- •
- •
- •
- •
- •
- •
- •
- •
- •
- •
- •
- •
- •
- •
- •
- •
- •
- •
- •