The distribution and kinematics of interstellar O VI in the Milky Way
Abstract
We present the results of a survey of interstellar O VI absorption in the Milky Way (MW) towards 69 stars in the Large Magellanic Cloud (LMC) obtained with the Far Ultraviolet Spectroscopic Explorer (FUSE). The integrated MW O VI column densities log N(O VI) are in the range from 13.68 to 14.73 with a mean of 14.26 atoms cm-2. The O VI exponential scale height is found to be 2.281.06 kpc. The O VI column density correlates with the Doppler parameter . The O VI velocity dispersion ranges from 14.0 to 91.6 with an average value of 62.7 km s-1. These high values of velocity dispersion reveal the effect of turbulence, multiple velocity components and collision on broad O VI profiles. There is a significant variation of O VI column density on all scales studied (0.0025 - 6.35). The smallest scale for which O VI column density variations has been found is 9. Comparison of the O VI velocity profiles with Fe II indicates the presence of intermediate velocity cloud (IVC) and/or high velocity cloud (HVC) components in the O VI absorption.
keywords:
ISM:atoms–ISM:galaxies:Milky Way1 Introduction
Highly ionized gas spanning the temperature range from 105 to 107 K is an important constituent of the interstellar medium (ISM) of galaxies. Species in the hot phase of the ISM (Si IV, C IV, N V, O VI, etc.) show strong transitions in the ultraviolet (UV). Important lines amongst these are the O+5 (O VI) absorptions at 1032 Å and 1038 Å. O VI is unlikely to arise from photoioization as 113.9 eV is required to remove one more electron from O V but is rather produced in the ISM through collisional ionization at temperatures of about 3105 K (Indebetouw & Shull, 2004; Cox, 2005). Such temperatures represent the interface between the warm (T K) and the hot (T K) phases of the interstellar gas and a detailed analysis of the O VI absorption aids in understanding the total abundance and the processes leading to its formation in the ISM (Wakker et al., 2012).
The first observations of O VI absorption were made with the the Copernicus satellite (Jenkins, 1978a, b) followed by observations made with the Hopkins Ultraviolet Telescope (HUT) (Dixon et al., 1996). The Far Ultraviolet Spectroscopic Explorer (FUSE) (Moos et al., 2000; Sahnow et al., 2000) launched in 1999 June contributed significantly to the observation of O VI absorption with much higher resolution and signal to noise. FUSE had a far-ultraviolet (FUV) wavelength coverage between 905 – 1187 Å with a resolution of 15,000 – 20,000 near the O VI line absorption wavelengths. The study of O VI absorption in the ISM of galaxies with FUSE has given us information about the formation and distribution of O VI in the MW and the Magellanic Clouds that adds to our knowledge of varying ISM conditions in environments of different metallicities (Howk et al. (2002a); Savage et al. (2000); Wakker et al. (2003); Oegerle et al. (2005); Savage & Lehner (2006); Welsh & Lallement (2008); Pathak et al. (2011)). Apart from absorption studies, FUSE has also been used to observe the O VI spectra in emission from the diffuse ISM in the MW (Shelton et al., 2001; Dixon et al., 2006; Dixon & Sankrit, 2008), from superbubbles (SBs) and in the LMC (Sankrit & Dixon, 2007). O VI absorption studies at low redshifts trace the warm-hot intergalactic medium (WHIM) and are important contributor to models of the cosmological problem of missing baryons (Tepper-Garcia et al., 2011).
2 O VI in the Milky Way
Although the first observations of hot interstellar gas of the MW were made with the Copernicus satellite (York, 1974; Jenkins, 1978a), it was not until the launch of the FUSE satellite that large scale observations of O VI absorption in the MW began. Strong O VI absorption was detected along 10 out of 11 lines of sight by Savage et al.2000 (2000) with log N(O VI) ranging from 13.80 to 14.64 atoms cm-2 while Howk et al.2002b (2002b) found a mean column density of 14.52 atoms cm-2 in the direction of the LMC. Savage et al.2005 (2005) report FUSE observations of O VI absorption towards 100 extragalactic lines of sight finding that the average log N(O VI) is 14.36 atoms cm-2. Bowen et al.2008 (2008) studied absorption lines of O VI towards 148 early-type stars situated at distances 1 kpc and found an average O VI midplane density of 1.310-8cm-3.
Pathak et al.2011 (2011) surveyed the O VI absorption in the LMC towards 70 lines of sight using FUSE and noted the presence of a MW component in each of these lines of sight. We have analysed all these sightlines and report our findings here.
3 Observations and data reduction
A detailed description of the FUSE mission and instruments has been given by Moos et al.2000 (2000) and Sahnow et al.2000 (2000). FUSE consists of two channels (SiC and LiF) optimized for short and long wavelength observations. These channels are further divided into eight segments; the SiC 1A, SiC 2A, SiC 1B, SiC 2B covering the wavelength range 905 - 1105 Å and LiF 1A, LiF 2A, LiF 1B and LiF 2B covering the wavelength range 1000 - 1187 Å. FUSE observes through three apertures- LWRS, MDRS and HIRS with aperture size 30, 4 and 1.25 respectively. Here we use data from the LiF 1A segment since its sensitivity near 1032 Å is almost double to that of the other segments.
We obtained the calibrated data for the 69 sightlines analysed by Pathak et al.2011 (2011) (see Table 1) from the Multimission Archive at STScI (MAST). These were processed by the latest FUSE data reduction pipeline CALFUSE V3.2 (Dixon et al., 2007). Out of the 69 sightlines, O VI absorption has already been reported for 1 sight line by Friedman et al. (2000); for 11 sightlines by Howk et al. (2002b); 3 by Danforth & Blair (2006); and 1 by Lehner & Howk (2007). Although the native FUSE resolution is 20 km s-1 in this region, we have uniformly downgraded all the spectra to a resolution of 35 km s-1 to have a higher signal-to-noise, irrespective of the quality of the original spectrum.
3.1 Continuum and Contamination
Our first task was to define a stellar continuum near the O VI profile for which we used Legendre polynomials as described by Sembach & Savage1992 (1992) and Howk et al.2002a (2002a). For most of the sightlines a low order polynomial (5) is enough to model the continuum, except for a few sightlines (e.g., Sk-67D05, Sk-67D168, Sk-70D115 etc.) that show complex behaviour. These sightlines show a sudden hike or trough near the O VI absorption. Polynomials of higher order (5) were required to fit such continuum. To measure the error in the continuum fitting we have tested two continua other than the assumed continuum, one just above and the other just below the real continuum giving 1 significance level.
Another source of error in the O VI column density measurements is the contamination from Galactic and LMC molecular hydrogen. We modeled the H2 absorption lines that arise due to 6 – 0 P(3) and 6 – 0 R(4) transitions following Howk et al.2002a (2002a) (Table 3). In this model we used the intensity of existing H2 absorption lines that are not blended with other lines and use the ratio of the oscillator strengths. The model estimated the strength of the 1031.20 Å and 1032.35 Å H2 line. These were subtracted from the O VI profiles that appear in the same wavelength region. This is not a major problem for the LMC absorption lines which are shifted to a higher velocity (Howk et al. (2002a); Pathak et al. (2011)) but may affect the Galactic O VI significantly. We have plotted a representative sample of normalized spectra of the O VI absorption at 1032 Å in Figure 1. HD lines were modeled but we find that these are extremely weak and their contribution is within the error bars of O VI.
Stellar wind variability and mass loss may add significant error in the O VI column density measurements. Interstellar O VI identification and stellar continuum placement is complicated because of stellar wind variability. Following Zsargó, Sembach & Howk (2003) we have selected by eye those the objects for which we had confidence in the continuum placement, line identification, and blending decontamination. Bowen et al. (2008) studied the absorption spectrum of HD 178487 in detail and estimated the uncertainty due to stellar mass loss to be about 0.1 dex.

3.2 Apparent Optical Depth Measurements
We have used the apparent optical depth (AOD) technique (Savage & Sembach, 1991; Sembach & Savage, 1992; Howk et al., 2002a) to measure the equivalent width and column density of the O VI absorption lines. This technique uses an apparent optical depth () in terms of velocity defined as
| (1) |
where is the continuum intensity and the intensity of the absorption line in terms of velocity. This method is well suited for observations where the instrument is able to completely resolve the absorption line.
The apparent column density ( in units of atoms cm-2 (km s-1)-1) is calculated from the apparent optical depth using the expression
| (2) |
where is the mass of the electron, is the speed of light, is the electronic charge, is the line wavelength (in Å) and f is the oscillator strength of the atomic species. For O VI, f value of 0.1325 has been taken from Yan et al. (1998). The O VI absorption is a doublet with absorptions at 1032 and 1038 Å. While the 1032 Å O VI profile is broad and is completely resolved by FUSE, the 1037.6 Å is difficult to separate from the CII* absorption line. Because of this we have only used the 1031.93 Å line in our analysis.
We have listed derived equivalent widths and column densities for O VI in Table LABEL:Tab1. The 1 error in the equivalent width and column density has been derived using the uncertainty in the FUSE data and the fitting procedures. Another major uncertainty is due to the overlap of high velocity MW O VI with that of the LMC absorption. The separation is distinct for some sightlines viz. Sk-65D21, Sk-67D69, Sk-65D105, HV2543, Sk-66D100, HV5936, Sk-67D211, Sk-69D220, Sk-66D172, Sk-68D137 and D301-1005. For overlapping lines, the lower velocity limit of the LMC O VI absorption from Pathak et al. (2011) is taken as the upper limit of the MW O VI profile. The range of the velocity considered for the integration is presented in Table LABEL:Tab1. The LMC results from Pathak et al. (2011) are also presented. The uncertainty in exactly resolving the velocity limits may lead to significant errors in the measurements of high velocity clouds (HVCs).
For understanding the distribution of O VI, we have tried to separate the O VI in the MW disk from the IVCs and HVCs. For this the velocity limits are chosen as 50 km s-1 for the O VI in the MW disk, 50 to 100 km s-1 for the O VI in the IVCs and 100 km s-1 for the O VI in the HVCs. The results from these measurements are presented in Table LABEL:Tab2.
4 Characteristics of O VI in the MW
4.1 Fe II absorption and kinematic properties of O VI
It is difficult to directly compare the kinematics of O VI in the MW and the LMC based only on the absorption profiles because the O VI profiles are broad (Figure 2) suggesting that they arise in an extended halo of hot gas. A better probe of the kinematics of the gas is the optically thin Fe II absorption line at 1125.448 (Howk et al., 2002b). These lines trace the low-ionization gas associated with the relatively high column density warm neutral medium (WNM) and warm ionized medium (WIM) and we observe two components, one at low negative velocities arising in the MW and the other at high positive velocities arising in the LMC (Figure 2;(Howk et al., 2002b)).
The O VI absorption in the MW is observed as a broad line at negative velocities (except for Sk-70D97, BI253 and HV982) arising in both the low velocity components tracked by the Fe II absorption line and in IVC and HVC components where no Fe II is seen.

Evidence of IVC and/or HVC components in the O VI absorption profiles for LMC can also be seen for all sightlines. In comparison to Fe II, O VI absorption profiles in the LMC extend to the lower velocities. Almost all Fe II profiles are aligned to the high velocity edge of O VI. Therefore, Fe II present in the LMC is close to the disk and O VI is an extended gas.
4.2 High velocity O VI
Absorption or emission spectra against bright extragalactic sources provide information about the large gaseous structures surrounding the MW. Gas with radial velocities km s-1 are usually the HVC and IVC is considered to be the gas having velocities km s-1. HVCs are often described in terms of the HI 21 cm emission and connect the inner region of a galaxy with the surrounding intergalactic medium. Towards several HVCs, H emission has been detected (Tufte, Reynolds, & Haffner, 1998; Bland-Hawthorn et al., 1998; Weiner & Williams, 1996). UV spectra of bright extragalactic stars have revealed neutral, weakly, and highly ionized gas at high velocities (Savage & de Boer, 1981; Welty, Frisch, Sonneborn, & York, 1999; Lehner et al., 2001; Danforth et al., 2002; Hoopes et al., 2002; Howk et al., 2002b; Lehner, 2002). The HVC has a complex multi-phase structure but the Hubble Space Telescope and FUSE results have shown that some HVCs are almost fully ionized (Sembach et al., 1995, 1999; Putman et al., 2003; Lehner, Staveley-Smith & Howk, 2009).
Most of the large IVCs and HVCs are located in the inner Galactic halo at distances d 20 kpc (Wakker et al., 2007; 2008, 2008; Thom et al., 2006; 2008, 2008) except the “Magellanic Stream” (MS) which is at 50 kpc (Gardiner & Noguchi, 1996). The accretion of gas from the two Magellanic Clouds by the MW has been considered as the origin of Magellanic Stream (Wannier, & Wrixon, 1972; Fox et al., 2010; 2013, 2013, 2014; Richter et al., 2013).
Other HVCs possibly represent metal-deficient gas that is infalling from the inter-galactic medium. Earlier a Galactic origin of the HVC towards the LMC was proposed (Savage & de Boer, 1981; de Boer, Morras, & Bajaja, 1990; Richter et al., 1999) while recent studies reveal energetic outflow from the LMC as the origin of the HVC complex (Lehner, Staveley-Smith & Howk, 2009).
4.3 Doppler parameter
The width of an absorption line is a measure of the total velocity distribution in the gas which, in the case of Galactic lines, may be due to thermal motion, turbulence or multiple components in the line of sight and is characterized by the Doppler parameter () where = FWHM/2). For high resolution observations such as those with where the O VI absorption line is fully resolved, the AOD method provides a direct measure of . The b-value has further been corrected by subtracting the second moment for the smoothed line-spread function from the second moments of the observed profiles.

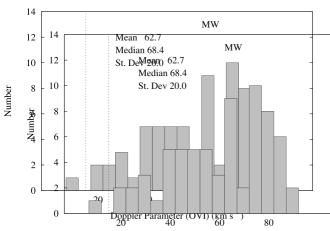
The production of O VI in collisional ionization equilibrium (CIE) is maximum at 2.8105 K (Sutherland & Dopita, 1993). At this temperature the thermal Doppler line width should be 17.1 km s-1 corresponding to a FWHM of 28.5 km s-1. The observed value for all sightlines of this study ranges from 14.0 km s-1 for BREY22 to 91.6 km s-1 for HV5936. The corresponding median, average and standard deviation of Doppler parameter are 68.4 km s-1, 62.7 km s-1 and 20.0 km s-1 respectively. The average -value is larger than expected from thermal broadening in a gas at 2.8105 K. This may be due to different environments dominated by inflow, outflow and turbulent motions.
For the MW O VI Savage et al. 2003 (2003) found =61km s-1 with a median value of 59 km s-1 for 100 extragalactic sightlines. Earlier Jenkins1978a (1978a) found a variation in the value of for the Galactic disk from 10.7 to 56 km s-1 with median value of 27 km s-1 for O VI absorption towards 62 stars observed by the satellite. O VI velocity dispersions from 33 to 78 km s-1 with an average km s-1 was reported for 22 halo stars by Zsargó, Sembach & Howk (2003). Lehner et al. 2011 (2011) also derived the O VI -distribution in the Milky Way disk and found a variation from 20 to 60 km s-1.
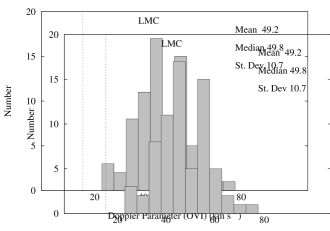
The distribution of the Doppler parameter and the column density is used to understand the variation in the temperature and the density of the ISM. A linear correlation between N(O VI) and was first discussed by Heckman et al.2002 (2002), who studied the trend using extragalactic sightlines and data from early investigations of O VI in the Galaxy. The discussed correlation between O VI column density and Doppler parameter is expected in radiatively cooled or conductively heated gas. This correlation extends from the local interstellar medium (LISM) to the Galactic disk and the halo and beyond (Heckman et al, 2002; Savage et al., 2003). Bowen et al.2008 (2008) found a similar relation in the Galactic disk for O VI. A good correlation between the Doppler parameter and the O VI column density for 15 km s-1 was reported by Lehner et al.2011 (2011). In Figure 3 (bottom panel) we plot N(O VI) against Doppler parameter . We find a correlation as reported in earlier studies. For comparison we also plot the results of Pathak et al.2011 (2011) and Bowen et al.2008 (2008) in the middle and upper panels respectively. O VI Doppler line width in the LMC is found to be confined in a narrower range compared to that of the MW. Heckman et al.2002 (2002) suggested that the correlation depends on the characteristic velocity which may be explained by the laws of heating or cooling. The correlation suggests a collision dominated ionisation for O VI production (Lehner et al., 2011). In Figure 4, the histogram of the values of for all the sightlines are shown. In the right panel of Figure 4 we also present the histogram of values as obtained by Pathak et al. 2011 (2011) for the LMC. The histogram plots indicate that the values are larger then the value for which maximum O VI is expected. Thus, the gas experiences nonthermal motion that dominates the broadening. There may also be undefined components contributing to the profile width (Lehner et al., 2011).
4.4 Column density
We find a variation of about an order of magnitude in the O VI column densities in the MW lying between 13.68 to 14.73 (in units of atoms cm-2) for log N(O VI). The mean MW O VI column density is found to be 14.26 atoms cm-2 and the median value for our sample is 14.27 atoms cm-2. The projections of the total column densities perpendicular to the Galactic plane, log (N sin ) are in approximately the same range: from 13.42 to 14.50 atoms cm-2 with average and median values of 14.00 and 14.02 atoms cm-2 respectively. Similar values of O VI column densities are reported in different literature as given in Table 3.
As discussed in section 4.1, the O VI profiles for all sightlines in our sample have HVC and/or IVC components. For the low velocity component, we have derived the MW O VI column densities by integrating over 50 km s-1 (Table LABEL:Tab2). This velocity range is nearly free from the IVC. The log N(O VI) for this velocity range varies from 12.55 to 14.52 atoms cm-2. The mean column density log N(O VI) for this range is 13.94 atoms cm-2.
The log N(O VI) for the velocity range 100 km s-1 representing the disk with the IVC component, varies from 14.63 to 13.61 atoms cm-2. The mean column density log N(O VI) for this range is 14.24 atoms cm-2. There are 5 sightlines where the IVC contribution to the total O VI column density is greater than and 14 sightlines where the contribution is . Howk et al.2002b (2002b) report O VI column density values in the Galactic halo from 13.61 to 14.23 atoms cm-2 in the velocity range -50 to +50 km s-1 and 14.22 to 14.67 atoms cm-2 when integrated over total velocity range for 12 stars in the LMC. The individual sightline of the 12 stars have varying column density values for the two corresponding velocity limits.
Out of the 69 sightlines, we have not found HVC component in case of BREY22 and HDE269599 (Figure 1). Except these two, it is observed that the HVC contribution is significant for all other sightlines. For 100 km s-1 region, log N(O VI) ranges from 9.78 to 14.03 atoms cm-2 with a mean of 12.87 atoms cm-2. There are 9 cases where the HVC contribution to the total column density is . The highest contribution from this velocity range is found in case of Sk-71D45.
4.5 Comparison with the LMC and the SMC
The metallicity of the MW is higher than that of the LMC and the SMC with SMC being the lowest. This implies that the O VI abundance in the MW would be higher compared to that of the LMC and the SMC. O VI column density for all the 69 lines in the LMC have already been reported by Pathak et al.2011 (2011). They found high abundance of O VI with log N(O VI) in the range of 13.72 to 14.57 atoms cm-2 and a mean of 14.23 atoms cm-2. The variation of column density in the LMC is lower than the MW. The mean O VI column density for the MW is higher then the LMC. Considering the inclination angle of the LMC to be 33∘, Pathak et al. 2011 (2011) calculated the projected O VI column density on the plane as 14.16. Table LABEL:Tab1 presents a comparison of the equivalent widths and the column densities in the two galaxies for all sightlines. We find that the O VI column densities in the MW are higher (or comparable) to the LMC values. The O VI absorption profiles are similar to that of the LMC which is in agreement with Pathak et al.2011 (2011).
Howk et al. 2002a (2002a) analysed the distribution and kinematics of O VI absorption towards 12 early-type stars in the LMC. They observed O VI absorption for all 12 stars and derived column densities in the range of 13.9–14.6 atoms cm-2 with a mean of 14.37 atoms cm-2. They report that the average column density of O VI and the dispersion of the individual measurements about the mean are identical to those measured for the halo of the MW.
Since, the O VI absorption is very patchy in nature and the O VI abundance depends on the local ISM conditions, it is extremely difficult to compare the O VI column densities of the MW and the LMC.
O VI absorption in the SMC was surveyed by Hoopes et al. (2002) for 18 early-type stars. They report a widespread presence of O VI with a mean value of N(O VI) as 14.53 atoms cm-2. While the metallicity of the SMC is lower, the mean column density is higher than the MW and the LMC. Highest abundance of O VI has been found for NGC 346 which is a star forming region of the SMC. In the SMC the O VI profile is shifted to higher velocities compared to the lower ionization gas traced by Fe II absorption (Hoopes et al., 2002).
4.6 O VI column density and angular variation
The O VI column densities have been measured using AOD method for 69 stars in the LMC [(l,b)=280.5, - 32.9 and d= 50 kpc]. As evident from Table LABEL:Tab1, there exists significant variation in the N(O VI) values. The lowest value of column density has been found to be 4.82 atoms cm-2 for SK-65D63. For LH91486 the value is highest which is 5.36 atoms cm-2. This gives a variation of about one order of magnitude.
The column density variation with respect to the angular scale may provide us information on physical properties of the regions in which O VI is produced. An idea of the physical dimension and shape of the O VI bearing clouds may be obtained from the amount of change in N(O VI) and angular scale variations. Though uniform distribution of hot gas in the galactic halo was considered (Spitzer, 1956), soon it became clear that the O VI distribution is not smooth in the galaxy (Savage et al., 2003). Howk et al. 2002b (2002b) found large variations in the MW O VI column densities over small angular scales towards 12 LMC and 11 SMC stars. They found column density variations for the smallest scales with a value of 1.8. No significant N(O VI) variation was found towards 4 stars in NGC 6752 that are separated by 2.2 - 8.9 (Lehner & Howk, 2004).

The sightlines in our study are separated by angular distances of 0.0025 6.35. The smallest scale for which O VI column density variation has been measured is 0.0025 for the closest pairing stars Sk-69D243 and MK42. On the other hand Sk-65D21 and Sk-68D03 are found to be the most distant lines of sight ( 6.35). Assuming O VI absorption by HVCs located in the halo of the Galaxy towards the LMC at a distance of 40 kpc from the Sun (Lehner, Staveley-Smith & Howk (2009); Sarma et al. (2014)), we find the distance between the closest and most distant stars to be 1.75 pc and 4.43 kpc respectively.

Figure 5 shows the difference in column densities for each pair of sightlines versus the angular separation of the pair. We measure absolute column density difference i.e. N(O VI) = N(O VI)i–N(O VI)j for each pair of sightlines i and j. In Figure 5 we show relative variation in N(O VI) for object pairs plotted against the angular separation of the pair. There exists clear variation in the amount of N(O VI) over all angular scales. The average and standard deviation of logarithmic values of column density difference of each sightline is found to be 13.83 and 0.49 atoms cm-2. This result confirms the patchiness of O VI in the Galaxy.
Following Howk et. al 2002b (2002b), we also derived the angular autocorrelation function (ACF) w() for O VI column densities towards all the 69 sightlines. The ACF is calculated using the expression
| (3) |
where Ni and Nj are the O VI column densities with uncertainties and . This is the same expression as Howk et. al 2002b (2002b) used except that the weight factors have been raised to (-1).
The average column density of 69 sightlines is represented by . We have considered the bin spacing as 0.2 for the whole data set. The derived values of w() are shown in Figure 6.
We find significant variation of w() on small scales. Below 2, the maximum factor by which the ACF varies is 1.6. This indicates that the cloud structure may be much smaller. At large scales, the variation of w() is not significant ( 0) which is similar to the earlier result (Howk et al., 2002b).
Howk et al.2002b (2002b) discuss the angular correlation function of the O VI measurements, finding no preferred angular scale for variations. Savage et al.2003 (2003) showed that the variation seen towards the LMC and the SMC extend to larger angular scales. They favoured models in which the O VI-bearing medium is composed of small complex cloud-like or sheet-like distribution of material (Howk et al., 2002b; Savage et al., 2003).
4.7 Scale Height
Another aim of this work is to study the distribution of O VI in the Galactic plane with a large sample size compared to earlier studies (Jenkins (1978b); Savage et al. (2003); Bowen et al. (2008); Savage & Wakker (2009)). We assume an exponential gas distribution with O VI volume density as a function of height (z), [n()=n0 exp (-/h) where h is scale height and n0 is midplane density]. The column density N(x) perpendicular to the plane for an object with latitude b is given by N(x) sin =n0h[1-exp (-/h)], where N(x) sin is the line-of-sight column density of an object. For extra-galactic objects ( h), N(x) sin =n0h is used.
Using Copernicus data the midplane density n0 and corresponding O VI scale height have been estimated to be 2.810-8 cm-3 and 0.3 kpc respectively by Jenkins (1978b). The Copernicus O VI observations have been reanalyzed by Shelton & Cox 1994 (1994) and they found that the midplane O VI density beyond the Local Bubble (LB) is (1.3 - 1.5)10-8 cm-3 for an O VI absorbing layer with h 3 kpc. Savage et al.2000 (2000) estimate n0 = 2.010-8 cm-3 from Copernicus O VI survey and derived scale height h2 kpc. Using data of 100 extragalactic objects Savage et al.2003 (2003) derived a scale height of h2.5 kpc. Bowen et al. (2008) used data of 148 early type stars and estimated midplane density n0 = 1.3310-8 cm -3 which decreases away from the plane of the Galaxy. Bowen et al. (2008) considered a correction for O VI absorption in the LB and measured O VI scale height as 3.2 kpc at negative latitudes or 4.6 kpc at positive latitudes.
We measure the scale height for all the sightlines of our study. For a midplane density n0=1.6410-8 cm-3 (Savage & Wakker, 2009), we obtain the scale height using the simple relation h=N(x) sin /n0. The value ranges from 0.53 to 6.4 kpc. The average values of the O VI scale height is 2.281.06 kpc. Savage & Wakker 2009 (2009) using a large object sample (109 stars and 30 extragalactic objects) derived the O VI scale height to be 2.60.5 kpc from the Galactic plane. We have also calculated the scale height for all the sightlines for the column density derived in the range from minimum to 100 kms-1. The average scale height in this case has been found to be 2.05 kpc.
From the O VI scale height value, the temperature of the ionized plasma can be found as estimated by Savage & Wakker 2009 (2009). Considering hydrostatic equilibrium at temperature T for an isothermal gas, the scale height is given by h=kT/. The value of gravitational acceleration towards the disk g(, in the solar neighbourhood for a distance 1-10 kpc is cm s-2 (Kalberla & Dedes, 2008). Considering average mass per particle =0.73mH, for a scale height h=2.28 kpc the temperature of the gas is found to be T 0.62 106 K. This temperature is 2.21 times larger than the transition temperature of O VI. Savage & Wakker 2009 (2009) derived this temperature as 0.8 106 K for a scale height value h=3 kpc.
5 Summary and conclusion
We have studied the properties of O VI in the MW along the lines of sight towards 69 stars in the LMC using FUSE spectra. The observed absorption lines are studied using AOD method which reveal significant variation in O VI column densities over small angular scale. The important results of these study may be summarized as follows:
1. We find O VI absorption in the MW with IVC and HVC components. The highest column density measured for the MW is log N(OVI) = 14.73 atoms cm-2 and the minimum value is log N(OVI) = 13.68 atoms cm-2. The mean MW O VI column density is found to be 14.26 atoms cm-2. The median value of our sample is 14.27 atoms cm-2. The logarithm of the column densities perpendicular to the Galactic plane varies between 13.42 and 14.50 atoms cm-2 with an average value of 14.00 atoms cm-2. We observed the O VI absorption line at 1036 Å but did not use it as it overlaps with the CII* absorption line.
2. There is a significant variation in the O VI column densities on all scales (0.0025 - 6.35). Higher variation towards smaller angular scale indicates that the O VI bearing clouds are small in size.
3. The measured O VI column densities can be described by a patchy exponential distribution in the MW which is in accordance with earlier measurements of O VI absorption for the Galaxy.
4. The velocity dispersion (-values) of the O VI absorption profiles range from 14.0 to 91.6 km s-1. The median, average and standard deviation of equivalent width are 68.4, 62.7 and 20.0 km s-1 respectively. The average b-value is larger than expected from thermal broadening in gas at 2.8105 K. This may be due to different environments dominated by inflow, outflow and turbulent motions.
5. The broad (25.24 km s-1) O VI absorption profiles suggest collisional ionization at the interface of warm-hot ISM to be the mechanism that produces this ion.
6. The O VI column density and the Doppler parameter, , are found to be correlated for our sample of sightlines. This confirms earlier results.
7. A kinematical comparison of Fe II and O VI line profiles reveal the presence of HVC and/or IVC components in the O VI absorption along all sightlines. In the Fe II profiles we have not observed either of these components.The distribution of O VI is significantly different than that of Fe II. The broad absorption profiles of O VI trace extended layers compared to that of the Fe II-bearing layer.
8. For a midplane density n0=1.6410-8 cm-3, we measured the O VI scale height as 2.281.06 kpc. This is in accordance with earlier results.
A thorough mapping of O VI in the MW and in nearby galaxies will be helpful in understanding the distribution and kinematics of the ionized gas. Future scientific mission which may cover O VI wavelengths will definitely explore much more about the hot ionized phase of the ISM.
| Target Name | Milky Way | LMC | ||||
|---|---|---|---|---|---|---|
| Limit | EW | log N(O VI) | Limit | EW | log N(OVI) | |
| (km s-1) | (mÅ) | (dex) | (km s-1) | (mÅ) | (dex) | |
| SK-67D05 | -30,175 | 259.915 | 14.26 | 175, 330 | 736 | 13.72 |
| SK-68D03 | -20,120 | 12218 | 14.06 | 180,330 | 1128 | 14.02 |
| BI13 | -35,120 | 190.027 | 14.25 | 175, 315 | 884 | 13.94 |
| SK-67D18 | -30,135 | 130.317 | 14.12 | 165, 330 | 1327 | 14.16 |
| Sk-67D20 | -30,175 | 200.23 | 14.19 | 175, 335 | 1478 | 14.08 |
| PGMW-3070 | -50,120 | 139.215 | 14.23 | 180, 345 | 13223 | 14.10 |
| LH103102 | -20,150 | 287.023 | 14.38 | 180, 330 | 13223 | 14.16 |
| LH91486 | -30,175 | 459.922 | 14.73 | 175, 385 | 26629 | 14.47 |
| PGMW-3223 | -50,120 | 138.917 | 14.01 | 175, 315 | 12915 | 14.10 |
| HV2241 | -35,165 | 330.066 | 14.56 | 165, 365 | 27118 | 14.50 |
| HD32402 | -40,140 | 253.522 | 14.40 | 160, 320 | 2718 | 14.48 |
| SK-67D32 | -40,165 | 192.028 | 13.82 | 165, 360 | 1297 | 14.11 |
| SK-65D21 | -20,165 | 111.029 | 13.91 | 225, 340 | 9423 | 13.94 |
| HV2274 | -20,125 | 219.020 | 14.19 | 165, 345 | 16011 | 14.14 |
| Sk-66D51 | -30,170 | 391.821 | 14.47 | 170, 370 | 18510 | 14.26 |
| NGC1818-D1 | -50,150 | 32020 | 14.46 | 150, 340 | 28013 | 14.52 |
| SK-70D69 | -50,150 | 115.056 | 13.96 | 150, 295 | 18212 | 14.18 |
| Sk-67D69 | -20,170 | 138.018 | 13.97 | 170, 340 | 23228 | 14.40 |
| MACHO78-6097 | -30,165 | 236.950 | 14.32 | 165, 320 | 15125 | 14.15 |
| BI130 | -30,165 | 339.96 | 14.39 | 165, 320 | 947 | 13.89 |
| SK-69D94 | -20,160 | 149.88 | 14.22 | 160, 340 | 1503 | 14.22 |
| SNR0519-697 | 2,160 | 339.016 | 14.44 | 160, 300 | 974 | 13.97 |
| BREY22 | 10,160 | 105.620 | 13.94 | 160, 330 | 12624 | 14.07 |
| HD269445 | -30,175 | 301.231 | 14.49 | 175, 365 | 20010 | 14.29 |
| SK-69D124 | -35,190 | 136.426 | 13.95 | 190, 430 | 3318 | 14.57 |
| SK-67D105 | -40,180 | 311.340 | 14.42 | 180, 320 | 1108 | 13.92 |
| SK-67D106 | -20,150 | 113.022 | 13.89 | 175, 345 | 1807 | 14.30 |
| SK-67D107 | -40,120 | 427.62 | 14.63 | 160, 360 | 25410 | 14.45 |
| HD36521 | -30,175 | 190.03 | 14.24 | 175, 340 | 1269 | 14.07 |
| SK-68D82 | -20,165 | 226.612 | 14.30 | 165, 320 | 14110 | 14.17 |
| BI170 | -35,165 | 190.059 | 14.23 | 165, 365 | 23520 | 14.43 |
| SK-67D111 | -30,175 | 260.010 | 14.46 | 175, 365 | 21419 | 14.34 |
| HV2543 | -35,160 | 255.625 | 14.30 | 160, 365 | 15642 | 14.23 |
| SK-70D91 | -45,160 | 243.020 | 14.39 | 160, 365 | 2567 | 14.43 |
| Sk-66D100 | -35,160 | 222.064 | 14.21 | 160, 340 | 21421 | 14.34 |
| HDE269599 | -40,100 | 169.621 | 14.18 | 165, 320 | 1236 | 14.05 |
| SK-65D63 | -40,150 | 54.019 | 13.68 | 180, 375 | 1848 | 14.21 |
| HV982 | 40,175 | 117.555 | 13.91 | 175, 360 | 20858 | 14.33 |
| SK-70D97 | 20,175 | 74.912 | 13.74 | 175, 375 | 2264 | 14.39 |
| Sk-67D144 | -30,165 | 185.276 | 14.19 | 165, 335 | 19410 | 14.25 |
| BI184 | -30,165 | 295.428 | 14.51 | 165, 330 | 11810 | 14.04 |
| NGC2004-B15 | -30,165 | 200.524 | 14.22 | 175, 330 | 927 | 13.86 |
| SK-71D38 | -50,165 | 350.121 | 14.52 | 165, 315 | 947 | 13.92 |
| Sk-71D45 | -30,160 | 203.012 | 14.19 | 160, 345 | 1949 | 14.26 |
| SK-67D166 | -20,165 | 260.021 | 14.29 | 165, 390 | 2069 | 14.32 |
| SK-67D168 | -30,165 | 149.240 | 14.27 | 165, 375 | 18612 | 14.26 |
| SNR0532-675 | -70,165 | 292.080 | 14.50 | 165, 345 | 1479 | 14.16 |
| SK-67D191 | -40,165 | 462.727 | 14.64 | 165, 340 | 22916 | 14.42 |
| HV5936 | -30,175 | 286.025 | 14.41 | 175, 375 | 1748 | 14.18 |
| Sk-69D191 | -30,165 | 219.041 | 14.22 | 165, 340 | 18525 | 14.22 |
| J053441-693139 | -35,165 | 189.763 | 14.18 | 165, 330 | 18233 | 14.22 |
| Sk-67D211 | -40,160 | 222.055 | 14.13 | 160, 350 | 1448 | 14.11 |
| BREY64 | 10,180 | 239.043 | 14.25 | 180, 330 | 1398 | 14.20 |
| SNR0536-692 | 38, 165 | 139.739.7 | 14.16 | 165, 320 | 1167 | 14.03 |
| SK-69D220 | -40,155 | 222.023 | 14.33 | 160, 315 | 1289 | 14.09 |
| Sk-66D172 | -30,175 | 316.938 | 14.47 | 175, 360 | 1739 | 14.20 |
| BI253 | -20,160 | 260.046 | 14.36 | 160, 300 | 25946 | 14.46 |
| SK-68D137 | -20,165 | 307.051 | 14.37 | 165, 330 | 2347 | 14.45 |
| MK42 | -20,160 | 367.412 | 14.48 | 160, 330 | 22824 | 14.41 |
| SK-69D243 | 10,150 | 293.215 | 14.40 | 150, 345 | 30715 | 14.56 |
| 30DOR-S-R136 | -30,165 | 212.845 | 14.16 | 165, 320 | 18525 | 14.25 |
| SK-69D246 | -40,145 | 358.92 | 14.56 | 155, 325 | 2117 | 14.37 |
| HDE269927 | -40,160 | 228.621 | 14.34 | 160, 320 | 2458 | 14.42 |
| SK-69D257 | -40,160 | 245.898 | 14.49 | 160, 315 | 1718 | 14.20 |
| SNR0543-689 | 0, 160 | 238.88.47 | 14.24 | 160, 360 | 18634 | 14.27 |
| D301-1005 | -30,165 | 279.872 | 14.47 | 165, 385 | 28457 | 14.53 |
| SK-67D250 | -40,165 | 212.858 | 14.29 | 165, 375 | 31633 | 14.57 |
| D301-NW8 | -30, 175 | 204.235.5 | 14.15 | 175, 365 | 22830 | 14.42 |
| SK-70D115 | -40,165 | 170.81 | 14.36 | 165, 330 | 18611 | 14.23 |
Notes. LMC values are taken from Pathak et al.2011 (2011)
| Target name | limit | log N(O VI) | limit | log N(O VI) | log N(O VI)† |
|---|---|---|---|---|---|
| (km s-1) | (dex) | (km s-1) | (dex) | (dex) | |
| SK-67D05 | -30, 50 | 13.59 | -30, 100 | 14.19 | 13.43 |
| SK-68D03 | -20, 50 | 13.74 | -20, 100 | 14.03 | 12.81 |
| BI13 | -35, 50 | 14.02 | -35, 100 | 14.23 | 12.97 |
| SK-67D18 | -30, 50 | 13.92 | -30, 100 | 14.09 | 12.83 |
| Sk-67D20 | -30, 50 | 13.63 | -30, 100 | 14.05 | 13.61 |
| PGMW-3070 | -50, 50 | 14.09 | -50, 100 | 14.22 | 12.51 |
| LH103102 | -20, 50 | 14.18 | -20, 100 | 14.35 | 13.26 |
| LH91486 | -30, 50 | 14.31 | -30, 100 | 14.63 | 14.03 |
| PGMW-3223 | -50, 50 | 13.98 | -50, 100 | 14.01 | 10.06 |
| HV2241 | -35, 50 | 14.31 | -35, 100 | 14.52 | 13.53 |
| HD32402 | -40, 50 | 14.17 | -40, 100 | 14.36 | 13.29 |
| SK-67D32 | -40, 50 | 13.79 | -40, 100 | 13.82 | 10.10 |
| SK-65D21 | -20, 50 | 13.67 | -20, 100 | 13.90 | 12.14 |
| HV2274 | -20, 50 | 14.07 | -20, 100 | 14.18 | 12.43 |
| Sk-66D51 | -30, 50 | 13.83 | -30, 100 | 14.37 | 14.02 |
| NGC1818-D1 | -50, 50 | 14.36 | -50, 100 | 14.45 | 12.69 |
| SK-70D69 | -50, 50 | 13.66 | -50, 100 | 13.96 | 11.63 |
| Sk-67D69 | -20, 50 | 13.94 | -20, 100 | 13.97 | 10.28 |
| MACHO78-6097 | -30, 50 | 14.04 | -30, 100 | 14.29 | 13.21 |
| BI130 | -30, 50 | 14.09 | -30, 100 | 14.28 | 13.73 |
| SK-69D94 | -20, 50 | 13.73 | -20, 100 | 14.12 | 13.53 |
| SNR0519-697 | 2, 50 | 14.05 | 2, 100 | 14.36 | 13.63 |
| BREY22 | 10, 50 | 13.85 | 10, 100 | 13.94 | -0- |
| HD269445 | -30, 50 | 13.71 | -30, 100 | 14.36 | 13.93 |
| SK-69D124 | -35, 50 | 13.34 | -35, 100 | 13.85 | 13.24 |
| SK-67D105 | -40, 50 | 14.17 | -40, 100 | 14.39 | 13.20 |
| SK-67D106 | -20, 50 | 13.79 | -20, 100 | 13.81 | 10.05 |
| SK-67D107 | -40, 50 | 14.52 | -40, 100 | 14.62 | 12.94 |
| HD36521 | -30, 50 | 14.06 | -30, 100 | 14.19 | 13.31 |
| SK-68D82 | -20, 50 | 13.97 | -20, 100 | 14.23 | 13.46 |
| BI170 | -35, 50 | 13.94 | -35, 100 | 14.19 | 13.14 |
| SK-67D111 | -30, 50 | 14.29 | -30, 100 | 14.43 | 13.20 |
| HV2543 | -35, 50 | 14.10 | -35, 100 | 14.27 | 13.12 |
| SK-70D91 | -45, 50 | 14.11 | -45, 100 | 14.34 | 13.46 |
| Sk-66D100 | -35, 50 | 14.19 | -35, 100 | 14.21 | 10.11 |
| HDE269599 | -40, 50 | 14.08 | -40, 100 | 14.18 | -0- |
| SK-65D63 | -40, 50 | 13.16 | -40, 100 | 13.61 | 12.90 |
| HV982 | 40, 50 | 12.55 | 40, 100 | 13.86 | 12.97 |
| SK-70D97 | 20, 50 | 12.91 | 20, 100 | 13.70 | 12.72 |
| Sk-67D144 | -30, 50 | 14.07 | -30, 100 | 14.14 | 13.25 |
| BI184 | -30, 50 | 14.25 | -30, 100 | 14.48 | 13.25 |
| NGC2004-B15 | -30, 50 | 14.11 | -30, 100 | 14.22 | 9.78 |
| SK-71D38 | -50, 50 | 14.29 | -50, 100 | 14.49 | 13.39 |
| Sk-71D45 | -30, 50 | 13.81 | -30, 100 | 14.01 | 13.71 |
| SK-67D166 | -20, 50 | 14.05 | -20, 100 | 14.28 | 12.80 |
| SK-67D168 | -30, 50 | 13.97 | -30, 100 | 14.24 | 13.04 |
| SNR0532-675 | -70, 50 | 14.20 | -70, 100 | 14.38 | 13.12 |
| SK-67D191 | -40, 50 | 14.45 | -40, 100 | 14.55 | 11.28 |
| HV5936 | -30, 50 | 14.09 | -30, 100 | 14.34 | 13.59 |
| Sk-69D191 | -30, 50 | 14.06 | -30, 100 | 14.22 | 13.90 |
| J053441-693139 | -35, 50 | 13.94 | -35, 100 | 14.17 | 12.65 |
| Sk-67D211 | -40, 50 | 14.07 | -40, 100 | 14.12 | 11.44 |
| BREY64 | 10, 50 | 13.29 | 10, 100 | 14.21 | 13.12 |
| SNR0536-692 | 38, 50 | 13.28 | 38, 100 | 14.06 | 13.46 |
| SK-69D220 | -40, 50 | 14.00 | -40, 100 | 14.28 | 13.44 |
| Sk-66D172 | -30, 50 | 13.87 | -30, 100 | 14.32 | 13.95 |
| BI253 | -20, 50 | 13.99 | -20, 100 | 14.34 | 13.02 |
| SK-68D137 | -20, 50 | 13.50 | -20, 100 | 14.33 | 13.36 |
| MK42 | -20, 50 | 13.79 | -20, 100 | 14.40 | 13.71 |
| SK-69D243 | 10, 50 | 13.45 | 10, 100 | 14.32 | 13.64 |
| 30DOR-S-R136 | -30, 50 | 14.03 | -30, 100 | 14.16 | 10.40 |
| SK-69D246 | -40, 50 | 14.25 | -40, 100 | 14.51 | 13.57 |
| HDE269927 | -40, 50 | 14.10 | -40, 100 | 14.32 | 13.12 |
| SK-69D257 | -40, 50 | 14.21 | -40, 100 | 14.45 | 13.44 |
| SNR0543-689 | 0, 50 | 13.95 | 0, 100 | 14.20 | 13.21 |
| D301-1005 | -30, 50 | 14.16 | -30, 100 | 14.41 | 13.56 |
| SK-67D250 | -40, 50 | 14.24 | -40, 100 | 14.29 | 11.70 |
| D301-NW8 | -30, 50 | 13.89 | -30, 100 | 14.12 | 13.06 |
| SK-70D115 | -40, 50 | 14.26 | -40, 100 | 14.35 | 12.68 |
column densities are calculated in the range from 100 km s-1 to the upper limit as given in the column 2 of Table LABEL:Tab1 for each sightline.
| Region | No. of stars | Mean | Median | Range | Ref. |
|---|---|---|---|---|---|
| Galactic Halo | 11 | 14.45 | 14.47 | 14.16-14.84 | a |
| Galactic Halo | 12 | 14.52 | 14.55 | 14.22-14.67 | b |
| Galactic Halo | 22 | 14.17 | 14.25 | 13.65-14.57 | c |
| Local ISM | 39 | 13.05 | 13.10 | 12.38-13.60 | d |
| Galactic Disk | 148 | 14.23 | – | 12.90-14.68 | e |
| Galactic Halo | 139 | 14.11 | 14.15 | 13.23-15.03 | f |
References
- Blair et al. (2009) Blair W. P., Oliveira C., Lamassa S., et al., 2009, PASP, 121, 634
- (2)
- Bowen et al. (2008) Bowen D. V., Jenkins B. E., Tripp T. M., et al. 2008, ApJS, 176, 59
- Cox (2005) Cox D. P., 2005, ARA&A, 43, 337
- Bland-Hawthorn et al. (1998) Bland-Hawthorn, J., et al. 1998, MNRAS, 299, 611
- Danforth et al. (2002) Danforth C. W., Howk J. C., Fullerton A. W., Blair W. P., Sembach K. R., 2002, ApJS, 139, 81
- Danforth et al. (2006) Danforth C. W., Shull J. M., Rosenberg J. L., Stocke J. T., 2006, ApJ, 640, 716
- Danforth & Blair (2006) Danforth C. W., Blair W. P., 2006, ApJ, 646, 205
- de Boer, Morras, & Bajaja (1990) de Boer K.S., Morras, R., & Bajaja, E. 1990, A&A, 233, 523
- Dixon et al. (1996) Dixon W. Van D., Hurwitz M, Ferguson H. C., 1996, ApJ, 469, 77
- Dixon et al. (2006) Dixon W. V. D., Sankrit R., Otte B., 2006, ApJ, 647, 328
- Dixon et al. (2007) Dixon W. V., Sahnow J., Barrett P.E. et al. 2007, PASP, 119, 527
- Dixon & Sankrit (2008) Dixon W. V. D., Sankrit R., 2008, ApJ, 686, 1162
- Friedman et al. (2000) Friedman S. D. et al., 2000, ApJ, 538, L39
- Fox et al. (2010) Fox A.J., Wakker, B.P., Smoker, J.V., et al. 2010, ApJ, 718, 1046
- (16) Fox A.J., Richter, P., Wakker, B.P., et al. 2013, ApJ, 772, 110
- (17) Fox A.J., Wakker, B.P., Barger, A., et al. 2014, ApJ, 787, 147
- Gardiner & Noguchi (1996) Gardiner L. T. & Noguchi, M. 1996, MNRAS, 278, 191
- Heckman et al (2002)
- (20) Heckman T.M., Norman C.A., Strickland D. K. & Sembach K. R., 2002, ApJ, 577, 691
- (21)
- Hoopes et al. (2002) Hoopes C. G., Sembach K. R., Howk J. C., Savage B. D., Fullerton A. W., 2002, ApJ, 569, 233
- Howk et al. (2002a)
- (24) Howk J. C., Sembach K. R., Savage B. D., Massa D., Friedman S. D., Fullerton A. W., 2002a, ApJ, 569, 214
- Howk et al. (2002b)
- (26) Howk J. C., Savage B. D., Sembach K. R., Hoopes C. G., 2002b, ApJ, 572, 264
- Indebetouw & Shull (2004) Indebetouw R., Shull J. M., 2004, ApJ, 605, 205
- Jenkins (1978a)
- (29) Jenkins E. B., 1978a, ApJ, 219, 845
- Jenkins (1978b) Jenkins E. B., 1978b, ApJ, 220, 107
- Kalberla & Dedes (2008) Kalberla P.M.W. & Dedes L. 2008, A&A, 487, 951
- Lehner & Howk (2007) Lehner N., Howk J. C., 2007, MNRAS, 377, 687
- Lehner, Staveley-Smith & Howk (2009) Lehner N., Staveley-Smith L. & Howk J. C. 2009, ApJ, 702, 940
- Lehner et al. (2001) Lehner N., Fullerton A. W., Sembach K. R., Massa D. L., Jenkins E. B., 2001, ApJ, 556, L103
- Lehner (2002) Lehner, N. 2002, ApJ, 578, 126
- Lehner et al. (2003) Lehner N., Fullerton A. W., Massa D., Sembach K. R., Zsargo, J., 2003, ApJ, 589, 526
- Lehner & Howk (2004) Lehner N., Howk J. C., 2004, PASP, 116, 824
- Lehner et al. (2011)
- (39) Lehner N., Zech W. F., Howk J. C. & Savage B. D., 2011, ApJ, 727, 46
- Meaburn et al. (1984) Meaburn J., McGee R. X., Newton L. M., 1984, MNRAS, 206, 705
- (41)
- Moos et al. (2000) Moos H.W., Cash W.C., Cowie L.L. et al., 2000, ApJ, 538, 1
- Oegerle et al. (2005)
- (44) Oegerle W. R., Jenkins E. B., Shelton R. et al., ApJ, 622, 377
- Pathak et al. (2011)
- (46) Pathak A., Pradhan A.C., Sujatha N.V. & Murthy J., 2011, MNRAS, 412, 1105
- Putman et al. (2003) Putman M.E. et al. 2003, ApJ, 597, 948
- Richter et al. (1999) Richter P., de Boer, K.S., Bomans, D.J., et al. 1999, Nature, 402, 386
- Richter et al. (2013) Richter P., Fox, A. J., Wakker, B. P., et al. 2013, ApJ, 772, 111
- (50)
- Sahnow et al. (2000) Sahnow D.J., Moos H.W., Ake T.B. et al., 2000, ApJ, 538, 7
- Sankrit & Dixon (2007) Sankrit R., Dixon, W. V. D., 2007, PASP, 119, 284
- (53) Savage B. D., Edger, R. & Diplas A. 1990, ApJ, 361, 107
- Sarma et al. (2014) Sarma, R. et al. 2014, AdSpR, 53, 963
- Savage & Sembach (1991) Savage B. D., Sembach K. R., 1991, ApJ, 379, 245
- Savage & de Boer (1981) Savage B. D. & de Boer K. S., 1981, ApJ, 243, 460
- Savage et al. (2000)
- (58) Savage B. D., Sembach K.R., Jenkins E.B. et al., 2000, ApJ, 538, 27
- Savage et al. (2003)
- (60) Savage B. D. et al., 2003, ApJS, 146, 125
- Savage & Lehner (2006)
- (62) Savage B. D., Lehner N., 2006, ApJS, 162, 134
- Savage & Wakker (2009)
- (64) Savage B. D. & Wakker B. P., 2009, ApJ, 702, 1472
- Sembach & Savage (1992)
- (66) Sembach K. R. & Savage B. D., 1992, ApJS, 83, 147
- Sembach et al. (1995) Sembach K. R., Savage B. D., Lu L., & Murphy E. M., 1995, ApJ, 451, 616
- Sembach et al. (1999) Sembach K. R., Savage, B. D., Lu L., & Murphy, E. M., 1999, ApJ, 515, 108
- (69) Shelton R. L.& Cox D. P., 1994, ApJ, 434, 599
- Shelton et al. (2001) Shelton R. L., Kruk J. W., Murphy E. M., et al., 2001, ApJ, 560, 730
- Spitzer (1956) Spitzer L. J., 1956, ApJ, 124, 20
- Sutherland & Dopita (1993) Sutherland R.S., & Dopita M.A., 1993, ApJS, 88, 253
- Tepper-Garcia et al. (2011) Tepper-García T., Richter P., Schaye J., et al. 2011, MNRAS, 413, 190
- Tufte, Reynolds, & Haffner (1998) Tufte S. L., Reynolds R. J. & Haffner L. M., 1998, ApJ, 504, 773
- Thom et al. (2006) Thom C., Putman M. E., Gibson B. K., et al. 2006, ApJ, 638, L97
- (76) Thom C., Peek J. E. G., Putman M. E., et al. 2008, ApJ, 684, 364
- Wakker et al. (2003) Wakker B. P., Savage B. D., Sembach K. R. et al. 2003, ApJS, 146, 1
- Wakker et al. (2007) Wakker B. P., York D. G., Howk J. C., et al. 2007, ApJ, 670, L113
- (79) Wakker B. P., York D. G., Wilhelm R., et al. 2008, ApJ, 672, 298
- Wakker et al. (2012) Wakker B. P., Savage B. D., Fox A. J., Benjamin R. A., Shapiro P. R., 2012, ApJ, 749, 157
- Welsh & Lallement (2008) Welsh B. Y., Lallement R., 2008, A&A, 490,707
- Wannier, & Wrixon (1972) Wannier P., & Wrixon G. T. 1972, ApJL, 173, L119
- Weiner & Williams (1996) Weiner B. J., & Williams T. B. 1996, AJ, 111, 1156
- Welty, Frisch, Sonneborn, & York (1999) Welty D. E., Frisch P. C., Sonneborn G., & York D. G. 1999, ApJ, 512, 636
- Yan et al. (1998) Yan Z. -C., Tambasco M., Drake G. W. F., 1998, PRA, 57, 1652
- York (1974) York D.G. 1974, ApJ, 193, 127
- Zsargó, Sembach & Howk (2003)
- (88) Zsargó J., Sembach K.R. & Howk J.C., 2003, ApJ, 586, 1049