Potential Energy Landscape of the Apparent First-Order Phase Transition between Low-Density and High-Density Amorphous Ice
Abstract
The potential energy landscape (PEL) formalism is a valuable approach within statistical mechanics for describing supercooled liquids and glasses. Here we use the PEL formalism and computer simulations to study the pressure-induced transformations between low-density amorphous ice (LDA) and high-density amorphous ice (HDA) at different temperatures. We employ the ST2 water model for which the LDA-HDA transformations are remarkably sharp, similar to what is observed in experiments, and reminiscent of a first-order phase transition. Our results are consistent with the view that LDA and HDA configurations are associated with two distinct regions (megabasins) of the PEL that are separated by a potential energy barrier. At higher temperature, we find that low-density liquid (LDL) configurations are located in the same megabasin as LDA, and that high-density liquid (HDL) configurations are located in the same megabasin as HDA. We show that the pressure-induced LDL-HDL and LDA-HDA transformations occur along paths that interconnect these two megabasins, but that the path followed by the liquid is different than the path followed by the amorphous solid. At higher pressure, we also study the liquid-to-ice-VII first-order phase transition, and find that the behavior of the PEL properties across this transition are qualitatively similar to the changes found during the LDA-HDA transformation. This similarity supports the interpretation that the LDA-HDA transformation is a first-order-like phase transition between out-of-equilibrium states. Finally, we compare the PEL properties explored during the LDA-HDA transformations in ST2 water with those reported previously for SPC/E water, for which the LDA-HDA transformations are rather smooth. This comparison illuminates previous work showing that, at accessible computer times scales, a liquid-liquid phase transition occurs in the case of ST2 water, but not for SPC/E water.
I Introduction
Water is one of the most complex liquids, exhibiting many anomalous thermodynamic and dynamical properties (see e.g., Refs. pabloReview2003 ; pabloGene ). In the glassy state, water is also a complex substance pabloReview2003 ; mishimaStanleyNature ; angellReview ; LGreview . Notably, amorphous solid water can be found in at least two different forms, low-density amorphous ice (LDA) and high-density amorphous ice (HDA), having very different properties. For example, the densities of LDA and HDA differ by mishimaNature1984 ; mishimaNature1985 ; mishimaVol ; katrinRevers2008_1 ; katrinRevers2008_2 . A large number of experiments indicate that LDA and HDA can be interconverted via many thermodynamic paths, such as isobaric heating and isothermal compression/decompression processes (see e.g. Refs.pabloReview2003 ; mishimaStanleyNature ; angellReview ; LGreview ). The LDA-HDA transformation, between properly annealed LDA and HDA forms, is rather sharp and reversible, and exhibits many of the characteristics of a first-order phase transition mishimaNature1985 ; mishimaJPC1994 ; katrin2006 ; klotzPRL2005 ; andersson2002 . The explanation of this unusual behavior requires answers to fundamental questions of statistical mechanics, such as how to properly define or interpret a “phase-transition” between out-of-equilibrium glassy states.
In this work, we address these questions by studying the LDA-HDA transformations in water, and the relationship of these glasses with the liquid state, using the potential energy landscape (PEL) approach (see e.g. Ref. stillinger95 ). The PEL is a statistical mechanical approach that formally separates the configurational contributions to the partition function into contributions from local energy minima (“inherent structures”), and vibrational excitations within the basins of attraction surrounding these minima. Consequently, the PEL formalism has been used extensively to study supercooled liquids and glasses pabloStill ; francescoReview ; harrowellEdiger2012 , and other equilibrium systems daviesBook , where such a separation between vibrational and configurational degrees of freedom arises naturally.
Specifically, for a system of particles, the PEL is the hyper-surface in -dimensional space defined by the potential energy of the system as function of the coordinates, . At any given time , the system is represented by a single point in the PEL defined by the particle coordinates . As time evolves, the representative point of the system moves, sampling different regions of the PEL. In the PEL approach, the thermodynamic francescoReview ; sastriNature and dynamic mossa ; lanave ; scalaNat ; francisINM properties of the system can be defined in terms of the topography of the PEL regions being sampled. The topography of the PEL can be rather complex with comparatively shallow basins residing within deeper and broader “megabasins” stillinger95 ; heuwer1 ; heuwer2 . In the case of supercooled liquids, the free energy can be expressed in terms of three basic properties of the PEL francescoReview ; sastriNature ; pabloStill ; stillinger95 : (i) the average energy of the inherent structures (IS) associated with the basins sampled in equilibrium; (ii) the number of IS having a given value of ; and, (iii) the average curvature of the basins associated with each IS.
The behavior of glassy and liquid water are necessarily related, and several scenarios have been proposed to explain their unusual properties within a common framework (see e.g. rev25 ; PooleNature92 ; rev38 ; rev23 ). One of the more widely accepted explanations is based on the idea that LDA and HDA are the glass counterparts of two liquids, low-density (LDL) and high-density liquid (HDL), that are separated by a first-order phase transition PooleNature92 ; mishimaStanleyNature ; poole1993 . This liquid-liquid phase transition (LLPT) ends at a liquid-liquid critical point (LLCP) recently estimated to exist at a temperature K and pressure MPa, based on experiments and theory mishimaVol ; FAeos . The LLPT hypothesis was originally proposed on the basis of computer simulations using the ST2 water model PooleNature92 , leaving the validation of the hypothesis for experiments. Unfortunately, crystallization makes experimental verification challenging, and thus the hypothesis remains a point of debate. However, there is experimental evidence supporting the existence of a LLPT in water winkel2011 ; thomasReviewTgHDA ; mishimaLLCP2000 . Indeed, most of the evidence supporting the LLPT hypothesis is from studies involving glassy water. A LLPT has been directly observed in experiments on other substances such as phosphorus Katayama and cerium Cadien , demonstrating the possibility of such a scenario. Furthermore, computer simulations of atomistic (see e.g. joel ; limei ; jagla ; francese ), nanoparticle francisDNA , and molecular systems including modified water models francisNews ; smallenburg14 ; smallenburg15 have shown the possibility for a LLPT in the equilibrium (as opposed to metastable) region of the phase diagram, establishing that a LLPT can exist as a proper phase transition in the thermodynamic limit.
In order to probe the apparent first-order transitions between LDA and HDA states, we employ the ST2 model. This choice is important since, contrary to other models such as the SPC/E and mW models davidPNAS2014 ; MySciRep ; yoPhaseDiag , the ST2 model reproduces the sharp LDA-HDA transformation observed in experiment. The behavior of ST2 water in glassy states has been recently characterized in detail and it has been shown that it is in qualitative agreement with experiments chiu1 ; chiu2 . Specifically, in the case of the ST2 model, the density has been observed to change abruptly with little change in the pressure [i.e. ] during the LDA-HDA transformation; see e.g. Refs. chiu1 ; MySciRep ; jessina .
In the present work, we explore the LDA-HDA transformation in ST2 water using the PEL formalism in order to clarify the thermodynamic differences between the LDA and HDA forms, and to assess the extent to which it may be appropriate to refer to this transformation as a first-order-like phase transition. As we show below, our results are consistent with the view that LDA and HDA occupy distinct megabasins of the PEL, and that the transformations between LDA and HDA exhibit a number of behaviors observed in well-defined equilibrium first-order phase transitions.
The structure of this manuscript is as follows: In Sec. II we describe the computer simulation details and methods employed. In Sec. III we discuss the changes in the PEL properties of ST2 water during the LDA-HDA transformations. We compare our results for ST2 water to those reported previously for SPC/E water in section IV. We compare the LDA-HDA transformation and the liquid-to-ice-VII first-order phase transition using the PEL formalism in Sec. V. The regions of the PEL sampled by the liquids and glasses are compared in Sec. VI. A summary and discussion, including a simple model of the PEL for polyamorphic water, is presented in Sec. VII. In the Appendix, we study the effects of reducing the compression/decompression rates on our results. Additional material is included as suplementary information (SI) where results at different temperatures are compared.
II Simulation and Analysis Methods
We perform extensive out-of-equilibrium molecular dynamics (MD) simulations of water using the ST2 model ST2model . Long-range (electrostatic) interactions are treated using the reaction field technique reacField . The details of the MD procedure and our implementation of the ST2 model are identical to that described in Ref. poole2005 . Ref. chiu1 contains a complete analysis of the thermodynamic and structural changes accompanying the pressure-induced LDA-HDA transformations to be analyzed in this work using the PEL formalism.
To summarize the thermodynamic procedure briefly, an LDA configuration is prepared by cooling equilibrium liquid water at MPa from K down to the chosen temperature for compression/decompression, using a cooling rate of K/ns. This preparation method corresponds to the experimental process used to produce the LDA form known as hyperquenched glassy water (HGW), although we use a faster cooling rate than experiments; see discussions in Refs. chiu1 ; chiu2 ; jessina . Our HGW configuration is then compressed isothermally, producing a sample of HDA. The resulting HDA form is then decompressed (at the same temperature ) leading to a new LDA sample. When subjected to sufficiently negative pressure, this LDA sample fractures. In order to compare our HGW sample and the LDA form we obtain by decompression of HDA, we also subject the HGW configuration to increasingly negative pressure, starting from MPa, until it also fractures.
Our compression/decompression rate is MPa/ns, which leads to sharp LDA-HDA transformations, as observed experimentally using much slower rates chiu1 ; MySciRep ; jessina . For each compression/decompression temperature, we perform runs starting from independently generated starting configurations to account for sample-to-sample variations in the non-equilibrium state. In all cases, we use a cubic box with water molecules with periodic boundary conditions.
During the compression/decompression runs, configurations are saved every MPa and the corresponding IS are obtained using the conjugate gradient algorithm conjGrad . The virial expression for the pressure at the IS configuration defines the IS pressure, (see e.g., Ref. nymand ). The curvature of a basin near the IS minimum is quantified by the shape function . is obtained from the set of eigenvalues (where to ) of the Hessian matrix evaluated at the IS configuration (see e.g. Ref. francescoReview and references therein):
| (1) |
Here is the frequency of vibrational mode , and where is Planck’s constant. The constant kJ/mol is included so that the argument of the function is dimensionless.
The same definition for was employed in Ref. yoSPCE-LDAHDA for the case of SPC/E water, allowing for a direct comparison of the present results with those reported in Ref. yoSPCE-LDAHDA . While and are calculated for independent runs, the shape function is calculated for only of these runs, owing to the computational expense of evaluating the eigenvalues . Technical details on the evaluation of the Hessian can be found in Ref. matharooPoole ; sastryFrancesco94 where the density of states of water in equilibrium is reported.
The PEL properties , , and are fundamental quantities in the PEL formalism francescoReview . For example, for a low-temperature liquid in equilibrium (or metastable equilibrium), knowledge of and as a function of and is sufficient to quantify key contributions to the free energy. In this case, the Helmholtz free energy can be written as,
| (2) |
where and are the configurational and vibrational entropies and is the average energy of the system due to vibrational motion in the PEL around the IS. In the harmonic approximation,
| (3) |
where is a function only of temperature and number of molecules mossaPELmolec , and
| (4) |
In the case of water, there can also be significant anharmonic contributions waterAnharm . An extension of the PEL formalism to quasi-equilibrium liquids shows that , , and are sufficient to write an analogous expression for the free energy of out-of-equilibrium states, from which the thermodynamic properties of the liquid can be predicted mossaOOE_1 ; mossaOOE_2 ; tartagliaOOE . In this case, however, knowledge of the PEL properties sampled in equilibrium is necessary francescoReview .
III The LDA-HDA Transformation in the PEL Formalism
We focus on the three fundamental properties of the PEL (, , and ) sampled by the system during the compression-induced LDA-to-HDA transformation and the decompression-induced HDA-to-LDA transformation. Doing so allows us to characterize the PEL basins associated with these states, and to determine the overall topography of the PEL for this system.
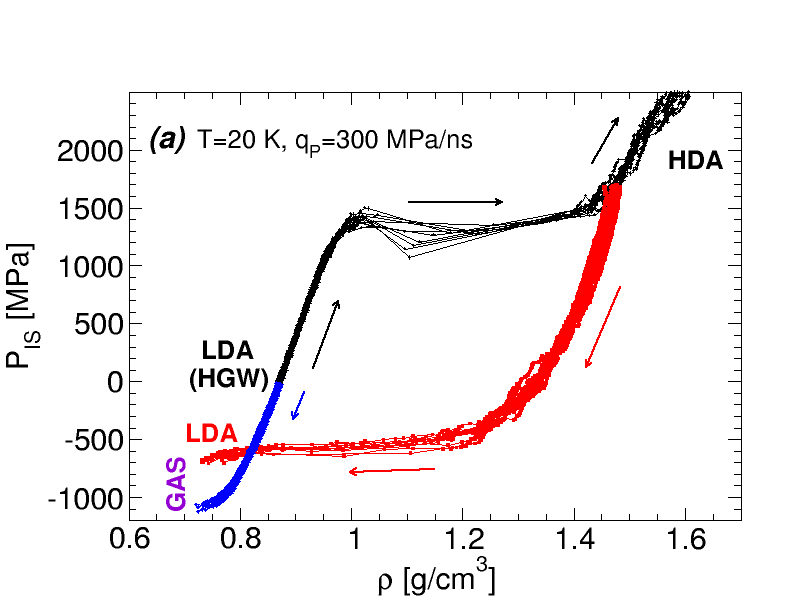
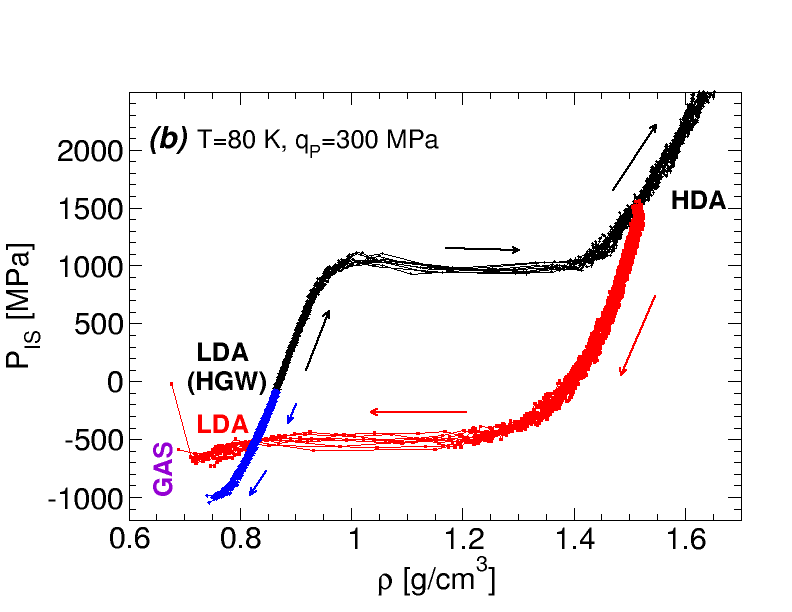
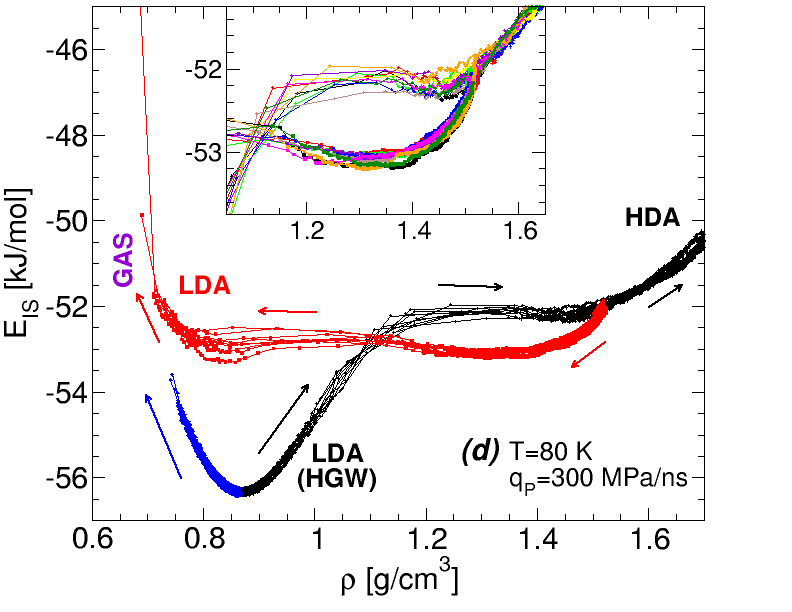
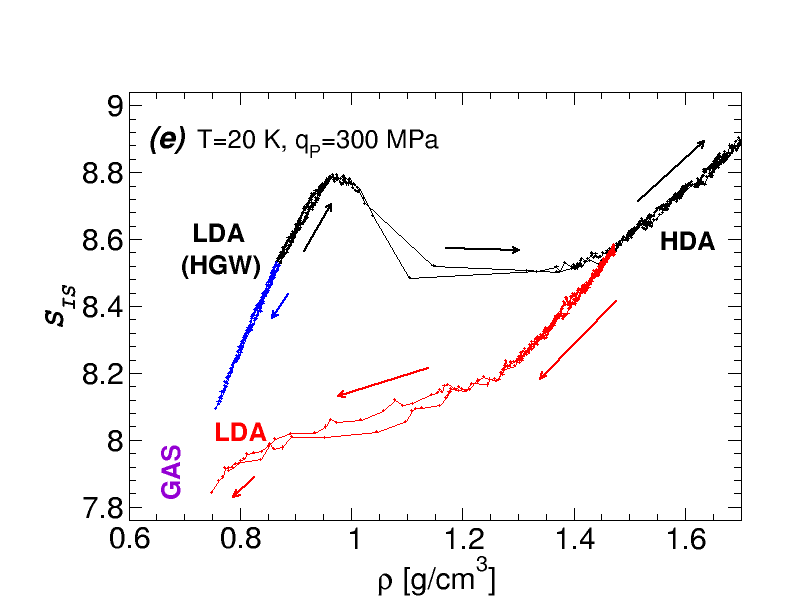
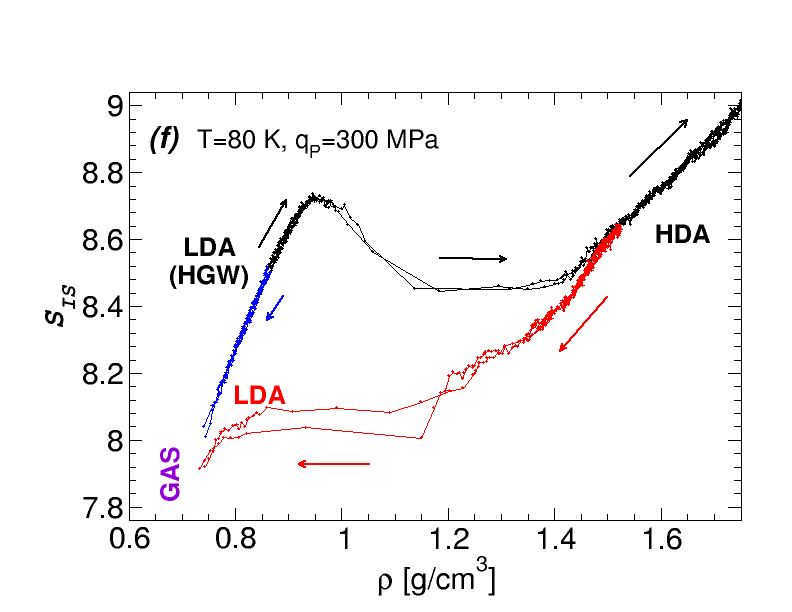
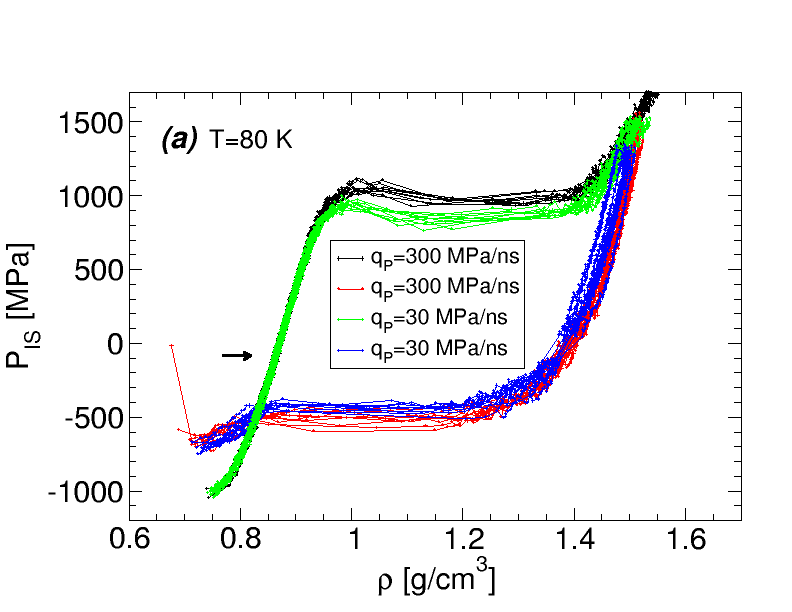
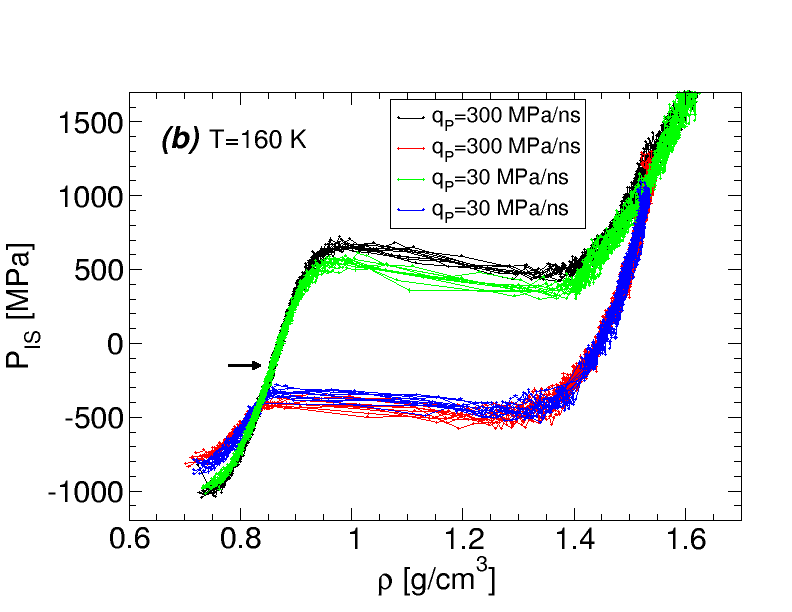
First we examine the LDA-to-HDA transformation at very low temperatures. Figs. 1(a)-(f) show , , and as a function of at two representative temperatures in the glass state, and K, during the LDA-to-HDA transformation. The behavior of , , and does not differ significantly between these two . Hence we will focus our discussion on the case K.
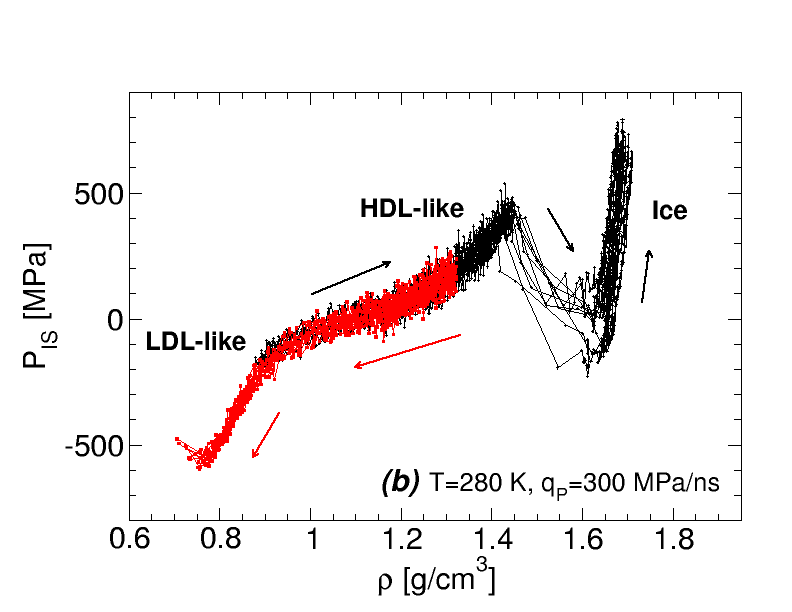
In Fig. 2(b) of Ref. chiu1 , the behavior of the pressure during the LDA-to-HDA transformation at K is shown for the same compression runs for which is shown here in Figs. 1(b). The LDA-to-HDA transformation during compression at K occurs at a pressure which ranges between and MPa. Within the LDA regime () and the HDA regime (), we note that varies rapidly with and is approximately linear, indicating that in these regimes the system responds to volume changes like a stiff elastic solid. These elastic regimes correspond to approximately for LDA and g/cm3 for HDA. As shown in Fig. 1(b), we find that the behavior of in these density ranges is similar to that observed for in Ref. chiu1 .
A significant difference between and is that is a monotonic function of , while is not. That is, during the LDA-to-HDA transformation (occurring in the range g/cm3), exhibits a van der Waals-like loop reminiscent of a first-order phase transition; see Fig. 1(b). This van der Waals-like loop in becomes more evident at K [see Fig. 3(a)], i.e. as the liquid phase is approached from the glass state, and it vanishes at [see Fig. 3(b)]. Since our system is glassy and therefore not in equilibrium, we cannot say that a van der Waals loop in indicates a thermodynamic instability. At the same time, it is interesting that during the LDA-to-HDA transformation we find , in analogy with the condition of instability for an equilibrium system, . We note that for K, these two inequalities become identical, since in this limit because the vibrational contributions to the pressure vanish francescoReview .
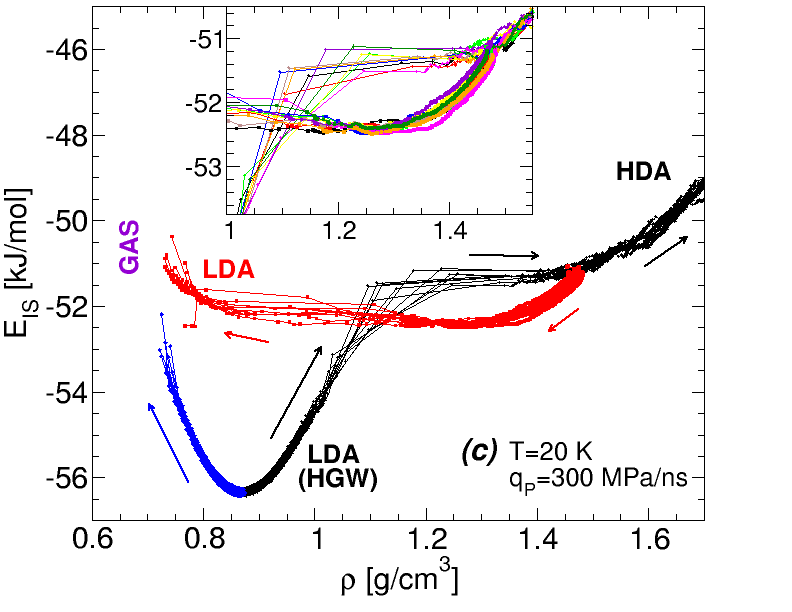
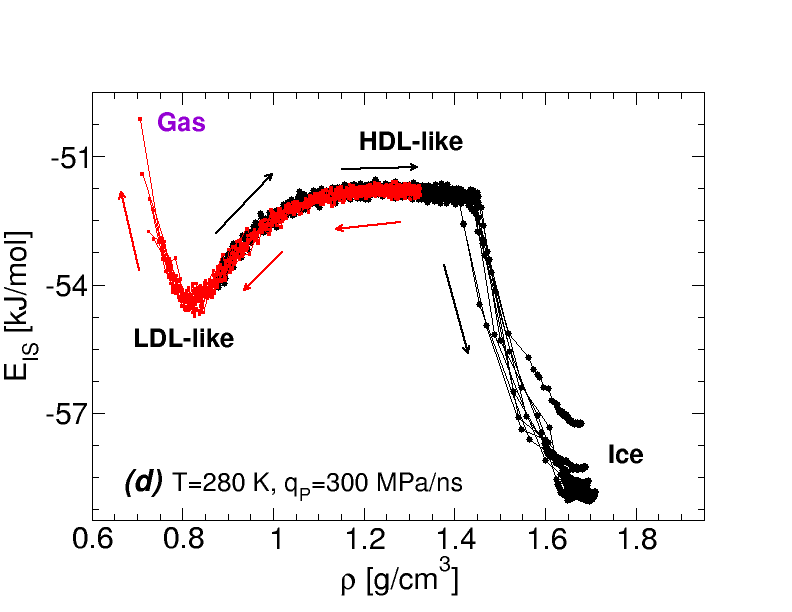
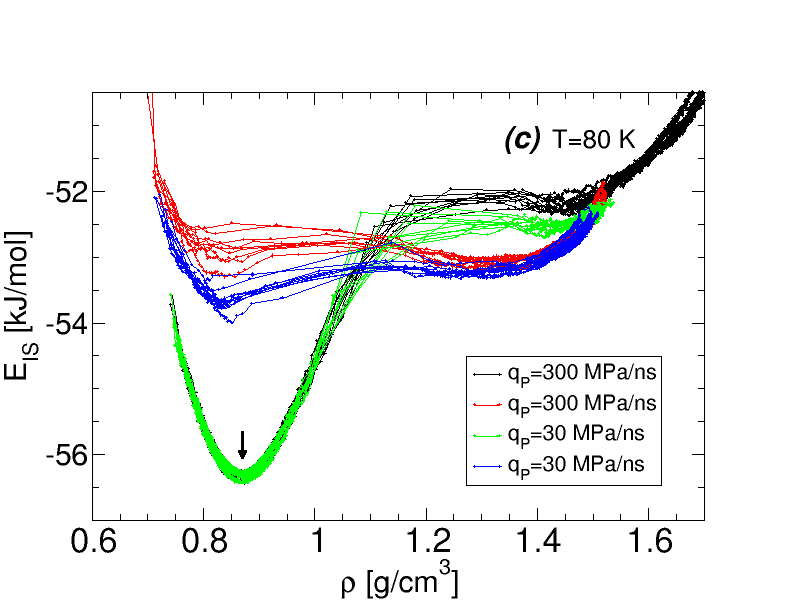
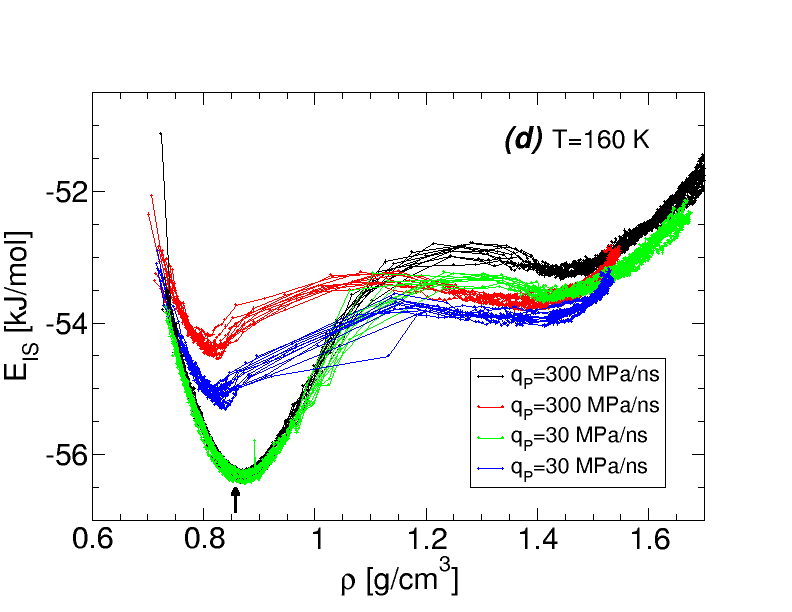
We next examine the behavior of during the LDA-to-HDA transformation at K, shown in Fig. 1(d). In the following analysis we assume that contributes to as described by Eq. 2. In this case, however, is considered to be an out-of-equilibrium configurational entropy that depends on the glass preparation. This implies that is assumed to be an additive function of and . We also note that the inequality identifies conditions at which a system is thermodynamically unstable as a single homogeneous phase. As shown in Fig. 2, the curvature of as a function of is positive in the density ranges associated with the elastic regimes of both LDA and HDA, consistent with the mechanical stability of the system in these two forms. However, during the transformation of LDA to HDA (in the range g/cm3), exhibits a pronounced negative curvature, i.e. . Our data for therefore indicate that the influence of the PEL on the thermodynamic behavior of the system is to introduce a region of instability between the LDA and HDA regimes.
We also note that exhibits a weak maximum during the LDA-HDA transformation. Hence, the present results are consistent with the PEL of ST2 water containing two megabasins, one for LDA and another for HDA, separated by potential energy barriers. We stress that such barriers separating the LDA and HDA megabasins are not necessary for the system to become unstable. In other words, as argued in the previous paragraph (based on Eq. 2), the negative curvature of (which does not need to be accompanied by potential energy barriers) may be sufficient to introduce an instability [] between the LDA and HDA states.
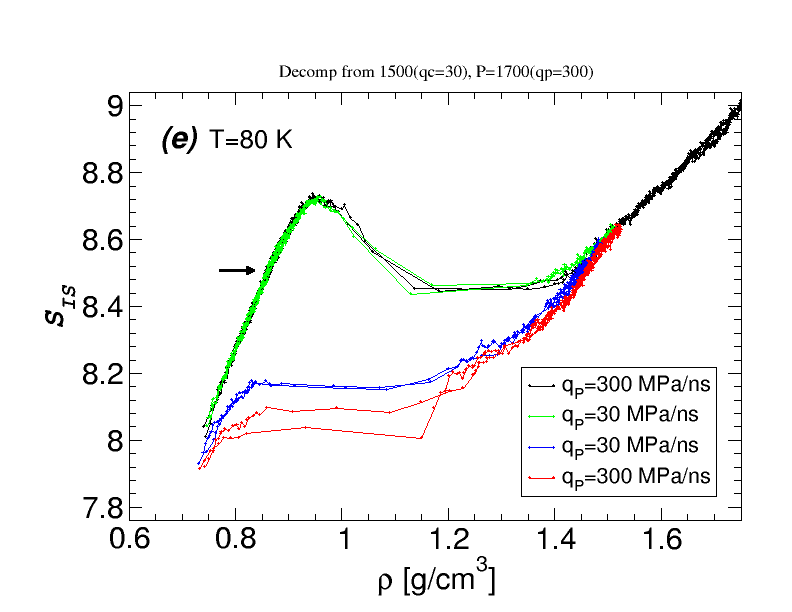
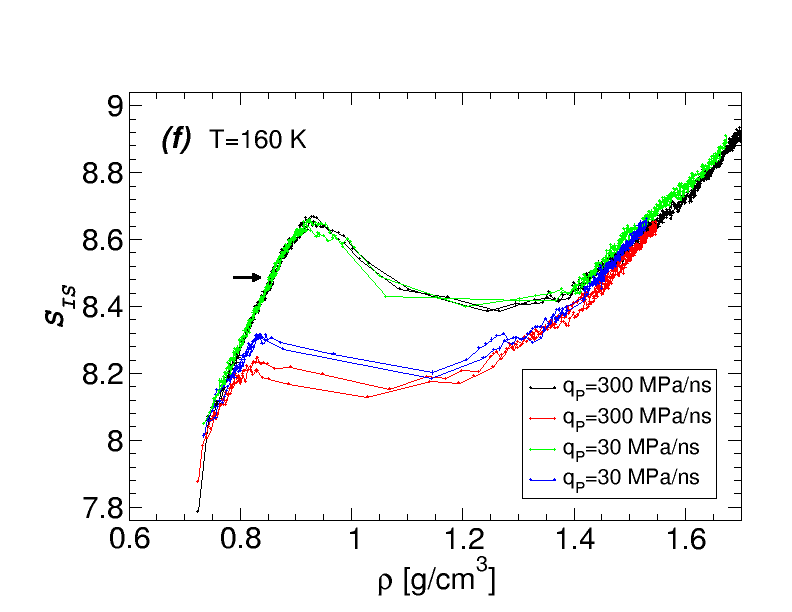
The behavior of during the LDA-to-HDA transformation at K is shown in Fig. 1(f). During the elastic compression of LDA and HDA (for and g/cm3), increases monotonically. In other words, in regimes of elastic deformation, the system explores basins in the PEL that become narrower as density increases. However, the overall behavior of as a function of across the LDA-to-HDA transformation is non-monotonic. At the beginning of the LDA-to-HDA transformation, decreases abruptly, indicating that “wider” basins (relative to LDA) become available to the system in the transformation zone. We also note that throughout much of the LDA-to-HDA transformation region. Within the harmonic approximation of the PEL formalism (see Eqs. 2 and 3), the positive curvature of will act to reduce the instability introduced by the negative curvature of noted above. However, in terms of their respective contributions to according to Eq. 2, the relative variation of over the LDA-to-HDA transformation range is approximately 20 times larger than for when K. Hence the curvature of dominates over that contributed by in determining the overall curvature of .
To summarize, Figs. 1(a)-(f) show three characteristic features of the LDA-to-HDA transformation in the PEL: (i) a van der Waals-like loop in ; (ii) negative curvature in ; and (iii) non-monotonic variation of . These features are all consistent with behavior analogous to a first-order phase transition in an equilibrium system, as we show in Sec. V. We note that these characteristic features, found here at K, become more pronounced as increases within the range of in which the system remains glassy. For example, see the results for K in the left column of Fig. 3 for g/cm3. See also the SI where we include , , and for all temperatures studied.
During decompression, the behavior of , and are consistent with the system moving from the HDA megabasin back to the LDA megabasin. For example, at K [Fig. 3(a), (c), (e)], all three of the characteristic features noted above [points (i), (ii), (iii)] are observed during the HDA-to-LDA transformation. However, these features are less evident, or absent, during the HDA-to-LDA transformations at K. As shown in Fig. 1, the negative curvature of is less prominent during decompression, and non-monotonic behavior in and is barely observed. This demonstrates that the IS basins of the PEL visited by the system during the LDA-to-HDA and HDA-to-LDA transformations are quite different, that is, the system follows different trajectories on the PEL.
A natural question follows: Is the LDA-to-HDA transformation reversible? As shown in Fig. 1, the values of , , and at g/cm3 for (a) the LDA (HGW) used to initiate the compression runs (black lines) and (b) the LDA recovered from HDA via decompression (red lines), are different. While these two LDA forms are not identical, as shown in Ref. chiu1 , both are structurally similar based on the corresponding OO, OH, and HH radial distribution functions. Ref. chiu1 argued that both of these LDA forms should be considered to be different members of the LDA “family”. The present results based on the PEL approach support this view. A region of negative curvature in (accompanied by a weak maximum) is encountered both during compression and decompression, consistent with the view that these trajectories take the system first from the LDA to the HDA megabasin, and then back again to the LDA megabasin. However, for the recovered LDA is much higher than for the starting LDA (HGW); see Figs. 1(c), 1(d), and 3(c) for g/cm3. This difference suggests that the recovered LDA form is a highly stressed glass residing higher in the LDA megabasin than HGW. This would not be surprising given the relatively fast compression rates that are accessible in simulations davidPNAS2014 ; chiu1 ; MySciRep ; jessina ; martonak . To confirm this interpretation, we subjected both the HGW and the recovered LDA forms to large negative pressures, to test if their properties become more similar when they are both brought close to their limits of mechanical tensile stress. As shown by the blue lines in Figs. 1 and 3, the PEL properties of HGW do approach more closely those of the recovered LDA at negative pressure. Also consistent with this view, we show in the Appendix that for HGW and recovered LDA become closer to one another when the compression/decompression rate is reduced.
IV Comparison of the LDA-HDA Transformation in ST2 and SPC/E water
In a previous work, a similar PEL study of the LDA-HDA transformation in water was carried out using the SPC/E model yoSPCE-LDAHDA . The computer simulation protocol followed in Ref. yoSPCE-LDAHDA is similar to the procedure used in the present work. In particular, both studies employ the same compression/decompression and cooling rates, which is crucial for a proper comparison. The main difference between the SPC/E and ST2 models is that a LLPT is accessible in (metastable) equilibrium simulations of ST2 water PooleNature92 ; pabloLLCPnat2014 ; yangLLCP ; pooleLLCP2013 ; smallenburg15 while it is not in SPC/E water via ordinary molecular dynamics simulations. Earlier studies scalaSPCE ; sciortinoLLCPspce suggested that a LLPT may be present in SPC/E water at very low , but it is not accessible at the available computational time scales. In short, Ref. yoSPCE-LDAHDA describes the PEL properties explored during the LDA-HDA transformation if the LLPT is not accessible to simulations. The present study corresponds to the case when the LLPT is accessible.
The main difference between the LDA-HDA transformation results for SPC/E and ST2 water is that in the case of SPC/E water, the evidence (at e.g. K; see Fig. 2 in Ref. yoSPCE-LDAHDA ) for first-order phase transition-like behavior in the PEL is significantly weaker. Specifically, during the LDA-HDA transformations in SPC/E water: (i) does not exhibit van der Waals-like loops; (ii) exhibits only very weak, barely noticeable, negative curvature upon compression, and not at all during decompression; and (iii) non-monotonic behavior in is also weak during compression, and absent during decompression. This pattern of behavior is consistent with the absence of an accessible LLPT in SPC/E water.
We also note that at the compression rates studied, the LDA-HDA transformation in SPC/E water exhibits a more gradual change of density on compression/decompression, compared to ST2 water or experimental water jessina ; chiu1 ; MySciRep . This suggests that the glass phenomenology observed in SPC/E water can be thought of as a “supercritical” LDA-HDA transformation, analogous to a liquid-gas transformation at . In contrast, for ST2 water and perhaps for real water, the glass phenomenology corresponds to a “subcritical” first-order phase transition between LDA and HDA.
A theory for amorphous ices has been presented in Ref. davidPNAS2014 based on theory/computer simulations using the mW model, a coarse-grain model for water mWmodel . In the suplementary information of Ref. davidPNAS2014 it is shown that for a compression rate MPa/ns, similar to the compression rate employed here and in Ref. yoSPCE-LDAHDA , the slope of in the LDA state and during the LDA-HDA transformation are similar, i.e., there is not a sudden change in density associated with the LDA-to-HDA transformation. The authors conclude that there is a state at which LDA, HDA, and the liquid coexist at an out-of-equilibrium triple point. Since the mW model seems to lack the sharp change in density associated with the LDA-to-HDA transformation, its behavior is closer to the case of SPC/E than ST2 water. It is thus suggestive that the theory proposed in Ref. davidPNAS2014 may apply only for the case of “supercritical” LDA-HDA transformations, such as that which occurs in SPC/E water.
We finally note some of the characteristic features indicative of a LDA-HDA “first-order phase transition”, found in ST2 water at K, vanish with increasing temperature as , where K is the LLCP temperature of ST2 water poolePRL2011 . For example, at temperatures slightly above , we find that the curvature of increases (becomes less negative) and shows no van der Waals-like loop (see SI). In particular, the behavior of and becomes closer to that reported in Fig. 2 of Ref. yoSPCE-LDAHDA for the case of SPC/E water. A similar phenomenology is found at high temperature, in the liquid state. For example, the right column of Figs. 3 shows , , and for the case of K . At these temperatures, and increase smoothly and monotonically with increasing density (at g/cm3, where crystallization does not interfere).
V The LDA-HDA transformation Contrasted with the Liquid-to-Ice Transition
In this section, we study the PEL behavior during the pressure-induced HDA-to-ice (at low temperature) and liquid-to-ice transformation (at high temperature). Refs. chiu1 ; MySciRep ; yangLLCP showed that ST2 water crystallizes spontaneously at high-pressure during isothermal compression, or isothermal heating of HDA at high pressure. The resulting crystal has the structure of ice VII, characterized by interpenetrating tetrahedral networks. The occurrence of spontaneous crystallization in our system provides the opportunity to identify the PEL behavior that is characteristic of an unambiguous first-order phase transition. We can thus compare the behavior of the PEL properties sampled during the liquid-to-ice first-order phase transition and with that occurring during the LDA-HDA transformation.
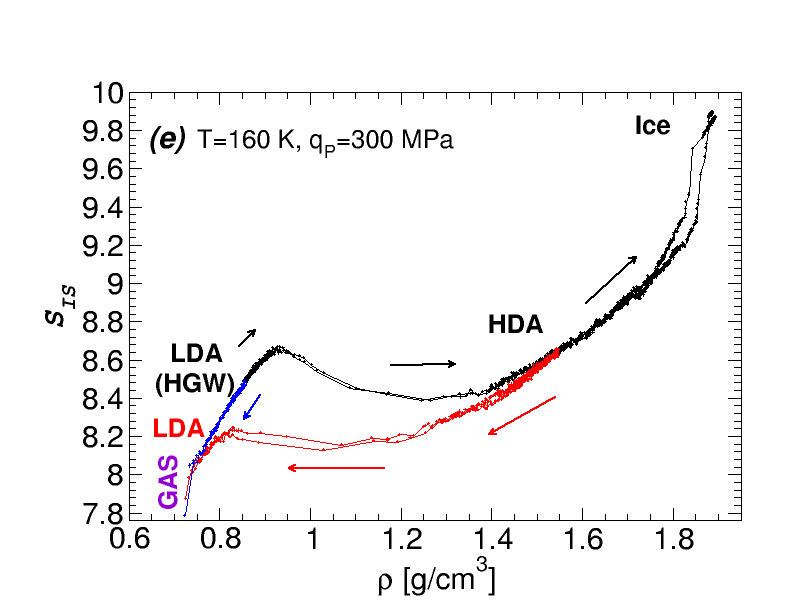
We first focus on the case of isothermal compression at K; see the left column of Fig. 3. At this temperature, we observe the successive LDA-to-HDA and HDA-to-ice transformations upon compression. The similarities in the behavior of , , and during these two transformations is striking. In both the LDA-HDA and HDA-ice transformations, (i) exhibits a van der Waals loop; (ii) exhibits negative curvature; and (iii) a sharp change in occurs as the transformation proceeds. In addition, the changes observed in the PEL properties during both transformations are consistent with the system evolving from one megabasin of the PEL to another. Specifically, at K, a maximum in separates LDA, HDA, and ice indicating that at this temperature, there are well-separated LDA, HDA, and ice megabasins in the PEL. The only minor difference is that during the HDA-ice transformation, increases monotonically (see Fig. 3(e) for g/cm3), while for the LDA-HDA transformation increases non-monotonically (see Fig. 3(e) for g/cm3). Yet, in both cases, the basins become narrower [i.e., they have a larger ] in the higher-density “phase”.
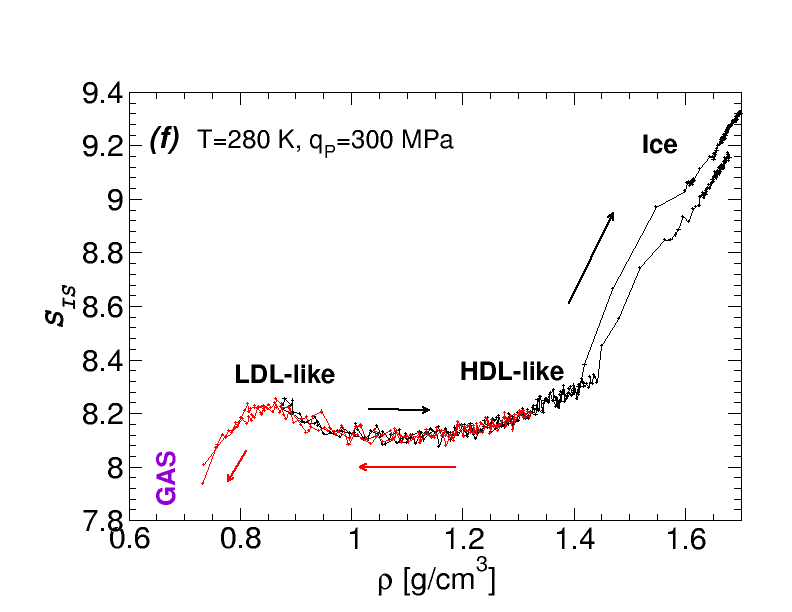
The right column of Fig. 3 shows the PEL properties at K. At this temperature the system starts in the liquid state during compression. For the compression rate employed, the system at this temperature is essentially in equilibrium, as demonstrated by the fact that the PEL properties overlap during compression and decompression. The main effect of increasing the temperature from K to K is to lose the signature of a distinct megabasin associated with the HDL-like liquid. However, all the PEL features of the HDA-ice transition observed in the left panels of Fig. 3 also occur in the liquid-ice transition shown in the right panels.
In summary, these results suggest that during a true first-order phase transition, shows a van der Waals-like loop, and exhibits a region of negative curvature. Interestingly, in the case of the liquid-to-ice transformation, the system also crosses a potential energy barrier in the PEL that separates two distinct (liquid and ice) megabasins. The similarities in the PEL properties sampled during the liquid-to-ice and LDA-HDA transformations provide support for the view that the LDA-HDA transformation is an out-of-equilibrium first-order phase transition; the origins of the LDA-HDA and LDL-HDL transformations being the system moving between the same two (LDL/LDA and HDL/HDA) megabasins of the PEL.
VI LDA, HDA, and the Equilibrium Liquid in the PEL
We now consider how the LDA and HDA configurations compare with the configurations sampled by LDL and HDL in equilibrium. This question has deep implications for our understanding of glass and liquid polymorphism. For example, if the PEL basins sampled by the LDA (HDA) glass are the same as the ones sampled by the equilibrium LDL (HDL) liquid at some fictive temperature , then it becomes possible to provide a thermodynamic modeling of the LDA-HDA transformation in terms of the LDL-HDL first-order phase transition. We addressed this question in Ref. yoSPCE-LDAHDA for the case of SPC/E water and found that, surprisingly, during the LDA-HDA transformation the system explores regions of the PEL never sampled by the equilibrium liquid. In this section, we show that this conclusion also holds for the case of ST2 water.
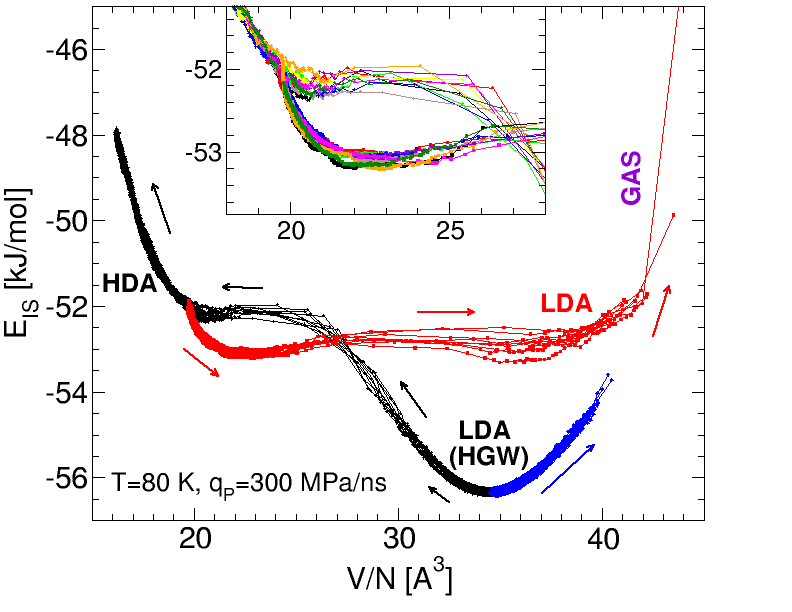
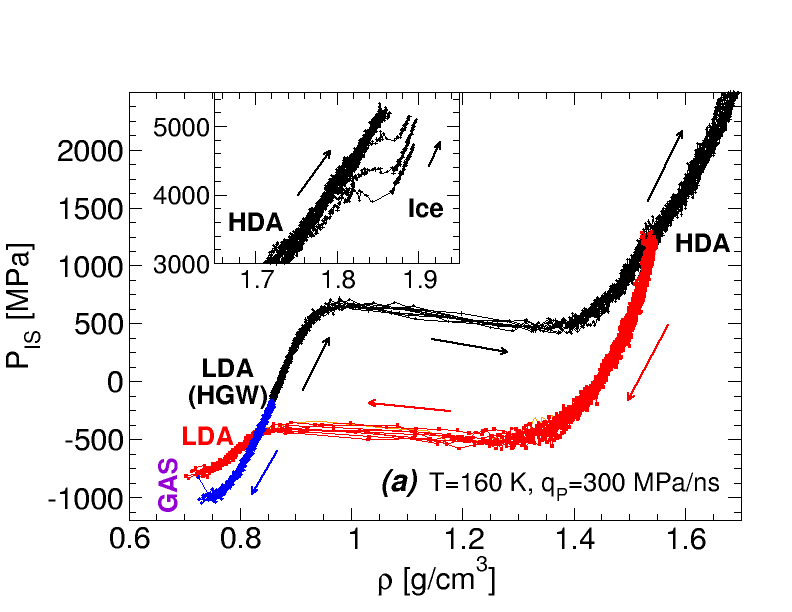
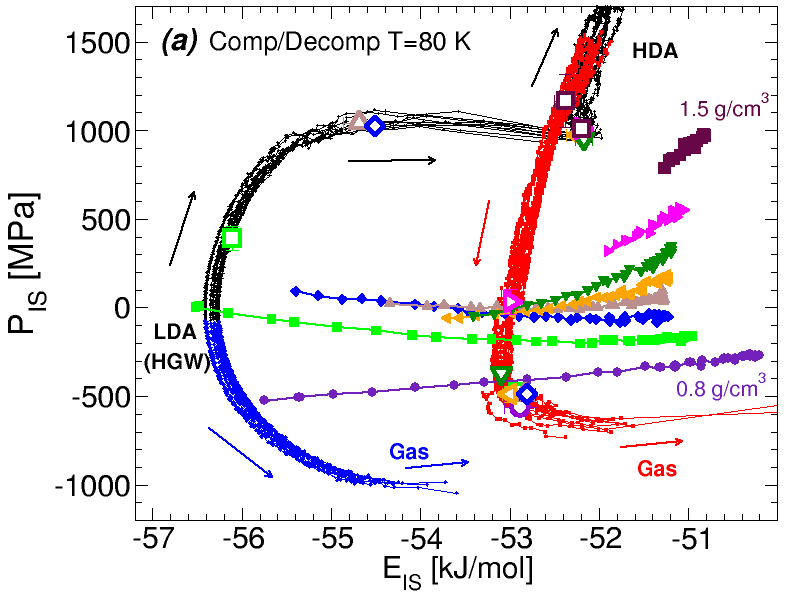
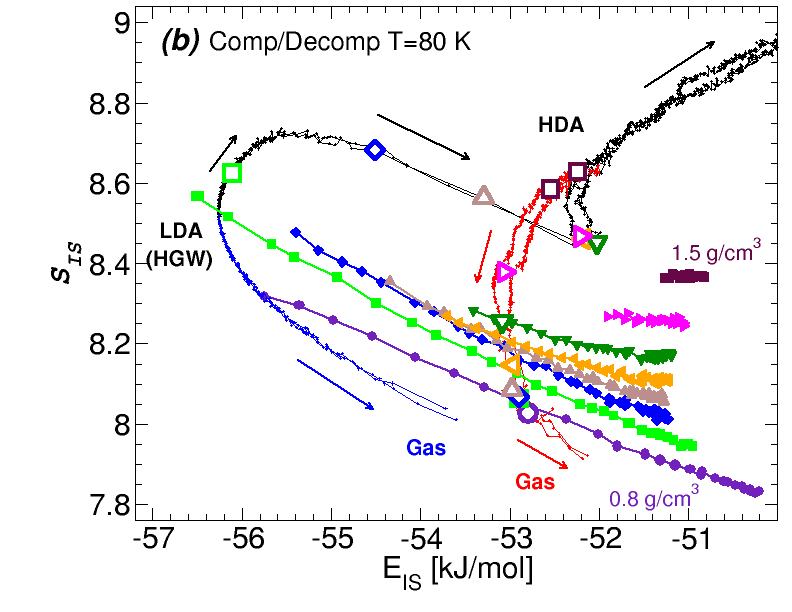
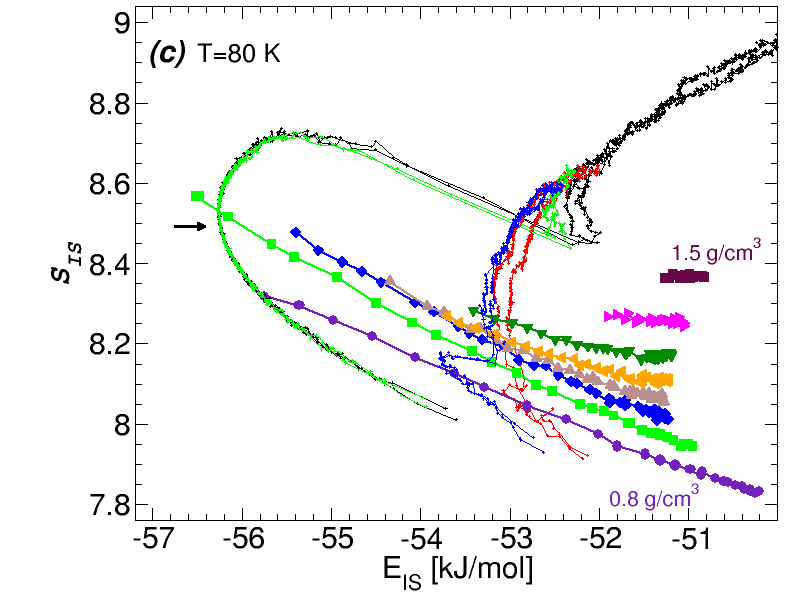
To compare the regions of the PEL associated with LDA, HDA, and the equilibrium liquid, in Figs. 4 and 5 we present these states in the - and - planes at and K. See Fig. 3 of Ref. yoSPCE-LDAHDA for a comparison with the case of SPC/E water. The starting LDA form (i.e. HGW) is close to the low-energy end of the g/cm3 isochores for the liquid in the - and - planes. This is expected since the density of LDA in this temperature range is approximately g/cm3. However, as soon as the compression starts, the glass deviates abruptly from the liquid isochores, exploring regions of the PEL that are not accessed by the liquid, similar to the behavior in SPC/E water yoSPCE-LDAHDA . For example, at K the LDA form at g/cm3 is characterized by MPa, kJ/mol, and (see empty diamond on the black lines in Fig. 4), while the corresponding values for the equilibrium liquid at the same density and are MPa and (see blue solid diamonds). Interestingly, the LDA-HDA transformation occurs in a region of the PEL that is far from the accessible configurations explored by the liquid at all densities.
During decompression of HDA (red lines in Figs. 4 and 5), the system returns to regions of the PEL with properties similar to those of the liquid. However, at a given density, the LDA form exhibits values of , , and that correspond to the equilibrium liquid at a different density. For example, Fig. 4(a) and 4(b) show that the decompressed glass at g/cm3 has MPa, kJ/mol, and (see empty diamond on the red lines), while the corresponding values for the equilibrium liquid at the same density and are approximately MPa and (blue solid diamonds).
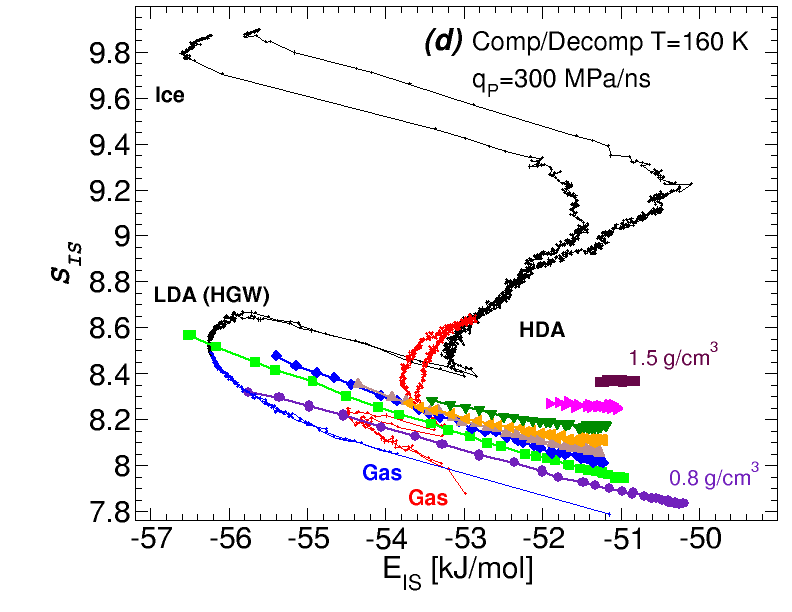
The results shown in Fig. 5(a) for K are similar. The main difference between the cases and K occur during the decompression paths. Specifically, Fig. 4(a) and (b) show decompression paths (red lines) where both and decrease monotonically with decreasing . Instead, Fig. 5(a) and (c) show a sharp kink at low and corresponding to the HDA-LDA transformation. Yet, at both temperatures the LDA form at a given density is in a different region of the PEL than the equilibrium liquid at the same density.
For comparison, we include in Figs. 5(a)-(d) the location in the - and - planes of the high-pressure ice that forms during compression at K. Clearly, the PEL region explored by the system in the ice state is very different from the regions associated with LDA, HDA, or the equilibrium liquid.
VII Discussion
In summary, we find that the PEL properties in our simulations of amorphous solid water during compression and decompression support the view that LDA and HDA correspond to two distinct megabasins in the PEL. We also show that the PEL behavior we observe in the LDA-HDA transformation is qualitatively the same as the PEL signatures observed during unambiguous first-order phase transitions in the same system, specifically the liquid-ice transitions. This finding is consistent with the interpretation of the LDA-HDA transformation as a sub-glass-transition manifestation of the equilibrium LLPT that has been demonstrated to occur in ST2 water. Comparison of our ST2 results with those obtained using SPC/E water demonstrate that when the LLPT is inaccessible, the phase-transition-like characteristics of the LDA-HDA transformation are correspondingly weakened, or lost entirely. Given the closer similarity between the behavior of amorphous solid ST2 water and real amorphous solid water, our results therefore support the possibility that a LLPT occurs in deeply supercooled liquid water.
An interesting result of this work is that, in ST2 water, the regions of the PEL sampled by the liquid (LDL and HDL) and the glass (LDA and HDA) differ. This is in agreement with previous simulations of SPC/E water. It follows that, at least for the compression/decompression rates explored here, the concept of fictive temperature cannot be used to associate LDA or HDA with “frozen” equilibrium configurations of LDL or HDL. As a consequence, it seems unlikely that a simple thermodynamic modeling of the LDA-HDA transformation in terms of the LDL-HDL first-order phase transition is possible.
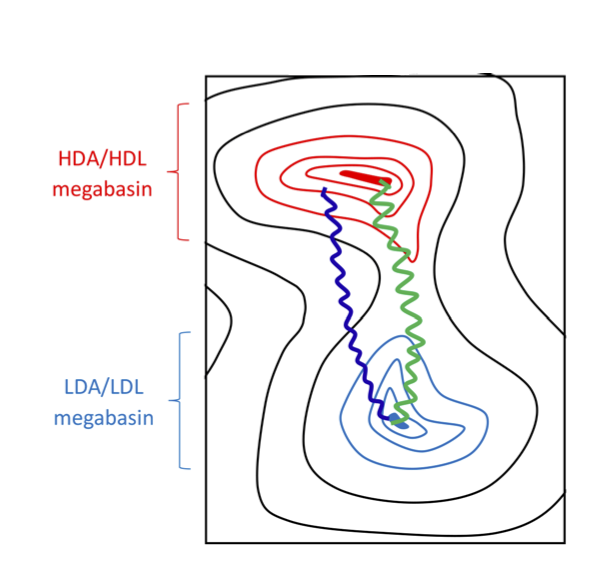
However, we also note that the fact that LDL/HDL and LDA/HDA sample different regions of the PEL is not at odds with the view that there are two distinct megabasins in the PEL, one associated with both LDL and LDA, and another megabasin corresponding to both HDL and HDA. A schematic and highly idealized PEL for real water, based on our results for ST2 water, is shown in Fig. 6. Only the LDL/LDA and HDL/HDA megabasins are illustrated; for clarity we have omitted the individual IS basins that are distributed all over the PEL. In Fig. 6, the region of the PEL explored by a given realization of a glass (LDA or HDA) should be small compared to the region accessible to the liquid. The slower a liquid is cooled toward the glass state, the deeper the system gets in the PEL in the final glassy state. Accordingly, the well-annealed LDA and HDA samples prepared in experiments are expected to lie quite close to the the minima of their respective megabasins. The region of the PEL explored by the equilibrium liquid will include many higher energy configurations. The path followed in the PEL when compressing at experimental rates from LDA to HDA might look something like the green path in Fig. 6. However, if a HDA sample is prepared by compression of LDA at a very fast rate compared to experiments, as is done in our simulations, the glass can be driven into regions of the PEL quite different, and at higher energy, than those explored by either the liquid, or the well-relaxed HDA obtained in experiments; a possible realization of this scenario is shown by the blue path in Fig. 6. From this point of view, we should not be surprised that different regions of the PEL are sampled by the glass during compression, relative to the liquid. A similar argument has been used to explain the differences between HDA samples prepared under different procedures mishimaMegabasin .
One of the limitations of simulation studies of glass polymorphism is the fast compression/decompression rates employed, relative to experiments. In particular, we have shown that the starting LDA form for our compression/decompression cycle (HGW) is not identical to the LDA form recovered after decompression of HDA. However, as shown in the Appendix, the difference between these two LDA forms decreases upon reducing the compression/decompression rate. Hence the present results are consistent with HGW and the recovered LDA form belonging to the same LDL/LDA megabasin. Our work supports the interpretation that the LDL/LDA and HDL/HDA megabasins each host a family of glasses and liquids, all with similar properties. In a following work, we will expand on the reversibility of the pressure-induced LDA-HDA transformation in simulations using the PEL approach.
Acknowledgments
This project was supported, in part, by a grant of computer time from the City University of New York High Performance Computing Center under NSF Grants CNS-0855217, CNS-0958379 and ACI-1126113. PHP thanks NSERC and ACEnet. We thank Wesleyan University for computational resources.
Appendix: Influence of the Compression/Decompression Rate on the PEL Properties Sampled during the LDA-HDA Transformations
In this section we study the effects of reducing the compression/decompression rate on the behavior of , , and during the LDA-HDA transformations. We find that the qualitative PEL behavior is not altered by reducing from to MPa/ns. Interestingly, while the compression-induced LDA-to-HDA transformation is clear at both rates studied, the decompression-induced HDA-to-LDA transformation becomes much more evident when is reduced. In addition, the recovered LDA becomes closer to the starting LDA (HGW) as decreases.
Fig. 7 shows , , and during the pressure-induced LDA-to-HDA transformation at K and K, for both and MPa/ns. During compression, reducing has the main effect of reducing the values of , , and during the LDA-HDA transformation. Yet at both rates one observes the signatures expected during the transition from one megabasin (LDA) to another (HDA) upon compression: (i) shows a van der Waals-like loop; (i) exhibits a region of negative curvature; and (iii) decreases sharply.
We observe a larger effect during the decompression path when is reduced. As discussed in Sec. III, the HDA-LDA transformation is rather smooth at K. The van der Waals-like loop in , and the negative curvature in , are weaker effects during decompression, relative to the compression process. However, upon reducing the decompression rate to MPa/ns, we observe that these features become significantly more prominent. This observation is consistent with our conclusion that during decompression, the system transitions from the HDA megabasin back to the starting LDA megabasin of the compression cycle. In particular, Figs. 7(c) and 7(d) show that the value of for the recovered LDA at MPa decreases with decreasing and becomes closer to the IS energy of the starting LDA (HGW). That is, the recovered LDA is deeper in the LDA megabasin with decreasing compression/decompression rate, as one would expect. This supports the view that the LDA-HDA transformation in ST2 water is indeed reversible chiu1 .
Fig. 8 shows and at and K for and MPa/ns. At both rates studied, these properties exhibit the same qualitative behavior during compression (black and green lines) and decompression (red and blue lines). The main point of Fig. 8 is that the system samples IS never visited by the equilibrium liquid even if the compression/decompression rate is reduced to MPa/ns.
References
- (1) P. G. Debenedetti, J. Phys.: Condens. Matter 15, R1669 (2003).
- (2) P. G. Debenedetti and H. E. Stanley, Physics Today 56, 40 (2003).
- (3) O. Mishima and H. E. Stanley, Nature 396, 329 (1998).
- (4) C. A. Angell, Annu. Rev. Phys. Chem. 55, 559 (2004).
- (5) T. Loerting and N. Giovambattista, J. Phys.: Condens. Matter 18, R919 (2006).
- (6) O. Mishima, L. D. Calvert, and E. Whalley, Nature 310, 393 (1984).
- (7) O. Mishima, L. D.Calvert, and E. Whalley, Nature 314, 76 (1985).
- (8) O. Mishima, J. Chem. Phys. 133, 144503 (2010).
- (9) K. Winkel, M. Bauer, E. Mayer, M. Seidl, M. S. Elsaesser, and T. Loerting, J. Phys.: Condens. Matter 20, 494212 (2008).
- (10) K. Winkel, E. S. Elsaesser, E. Mayer, and T. Loerting, J. Chem. Phys. 128, 044510 (2008).
- (11) O. Mishima, J. Chem. Phys. 100, 5910 (1994).
- (12) T. Loerting, W. Schustereder, K. Winkel, C. G. Salzmann, I. Kohl, and E. Mayer, Phys. Rev. Lett. 96, 025702 (2006).
- (13) S. Klotz, Th. Strässle, R. J. Nelmes, J. S. Loveday, G. Hamel, G. Rousse, B. Canny, J. C. Chervin, and A. M. Saitta, Phys. Rev. Lett. 94, 025506 (2005).
- (14) O. Andersson and H. Suga, Phys. Rev. B 65, 140201(R) (2002).
- (15) F. H. Stillinger, Science 267, 1935 (1995).
- (16) P. G. Debenedetti and F. H. Stillinger, Nature 410, 259 (2001)
- (17) F. Sciortino, J. Stat. Mech. P05015 (2005).
- (18) M. D. Ediger and P. Harrowell, J. Chem. Phys. 137, 080901 (2012).
- (19) D. J. Wales, Energy Landscapes (Cambridge University Press, UK, 2003).
- (20) S. Sastry, Nature 409, 164 (2001).
- (21) S. Mossa, E. La Nave, H. E. Stanley, C. Donati, F. Sciortino, and P. Tartaglia, Phys. Rev. E 65, 041205 (2002).
- (22) E. La Nave, A. Scala, F. W. Starr,1, F. Sciortino, and H. E. Stanley, Phys. Rev. Lett. 84, 4605 (2000).
- (23) A. Scala, F. W. Starr, E. La Nave, F. Sciortino and H. E. Stanley, Nature 406, 166 (2000).
- (24) V. I. Clapa, T. Kottos, and F. W. Starr, J. Chem. Phys. 136, 144504 (2012).
- (25) B. Doliwa and A. Heuer, Phys. Rev. E 67, 030501(R) (2003).
- (26) A. Heuer, B. Doliwa, and A. Saksaengwijit, Phys. Rev. E 72, 021503 (2005).
- (27) R. J. Speedy, J. Phys. Chem. 86, 982 (1982).
- (28) P. H. Poole, F. Sciortino, T. Grande, H. E. Stanley, and C. A. Angell, Phys. Rev. Lett. 73, 1632 (1994).
- (29) S. Sastry, P. G. Debenedetti, F. Sciortino, and H. E. Stanley, Phys. Rev. E 53, 6144 (1996).
- (30) P. H. Poole, F. Sciortino, U. Essmann, H. E. Stanley, Nature 360, 324 (1992).
- (31) P. H. Poole, U. Essmann, F. Sciortino, and H. E. Stanley, Phys. Rev. E 48, 4605 (1993).
- (32) D. A. Fuentevilla and M. A. Anisimov, Phys. Rev. Lett. 97, 195702 (2006).
- (33) K. Winkel, E. Mayer, and T. Loerting, J. Phys. Chem. B 115, 14141 (2011).
- (34) T. Loerting, V. Fuentes-Landete, P. H. Handle, M. Seidl, K. Ammann-Winkel, C. Gainaru, and R. Böhmer, J. Non-Cryst. Solid 407, 423 (2015).
- (35) O. Mishima, Phys. Rev. Lett. 85, 334 (2000).
- (36) Y. Katayama, T. Mizutani, W. Utsumi, O. Shimomura, M. Yamakata, and K. Funakoshi, Nature 403, 170 (2000).
- (37) A. Cadien, Q. Y. Hu, Y. Meng, Y. Q. Cheng, M. W. Chen, J. F. Shu, H. K. Mao, and H. W. Sheng, Phys. Rev. Lett. 110, 125503 (2013).
- (38) J. Y. Abraham, S. V. Buldyrev and N. Giovambattista, J. Phys. Chem. B 2011 115, 14229 (2011).
- (39) L. Xu, P. Kumar, S. V. Buldyrev, S.-H. Chen, P. H. Poole, F. Sciortino, and H. E. Stanley, Proc. Natl. Acad. Sci. USA 102, 16558 (2005).
- (40) E. A. Jagla, Phys. Rev. E 63, 061501 (2001).
- (41) P. Vilaseca and G. Franzese, J. Chem. Phys. 133, 084507 (2010).
- (42) C. W. Hsu, J. Largo, F. Sciortino, and F. W. Starr, Proc. Nat. Acad. Sci. USA, 105, 13711 (2008).
- (43) F. Starr, Nature Physics 10, 628 (2014).
- (44) F. Smallenburg, L. Filion, and F. Sciortino, Nature Physics 10, 653 (2014).
- (45) F. Smallenburg and F. Sciortino, Phys. Rev. Lett. 115, 015701 (2015).
- (46) N. Giovambattista, T. Loerting, B. R. Lukanov, and F. W. Starr, Sci. Rep. 2, 390 (2012).
- (47) D. T. Limmer and D. Chandler, Proc. Natl. Acad. Sci. USA, 111, 9413 (2014).
- (48) N. Giovambattista, H. E. Stanley, and F. Sciortino, Phys. Rev. E 72, 031510 (2005).
- (49) J. Chiu, F. W. Starr, and N Giovambattista, J. Chem. Phys. 139, 184504 (2013).
- (50) J. Chiu, F. W. Starr, and N Giovambattista, J. Chem. Phys. 140, 114504 (2013).
- (51) J. Wong, D. A. Jahn, and N. Giovambattista, J. Chem. Phys. 143, 074501 (2015).
- (52) F. H. Stillinger and A. Rahman, J. Chem. Phys. 60, 1545 (1974).
- (53) M. P. Allen and D. J. Tildesley, Computer Simulation of Liquids (Oxford University Press, UK, 2002).
- (54) P. H. Poole, I. Saika-Voivod, and F. Sciortino, J. Phys.: Condens.Matter 17, L431 (2005).
- (55) W. H. Press, B. P. Flannery, A. A. Teukolsky et al., Numerical Recipes: The Art of Scientific Computing (Cambridge: Cambridge University, 1986).
- (56) T. M. Nymand and P. Linse, J. Chem. Phys. 112, 6152 (2000).
- (57) N. Giovambattista, H. E. Stanley, and F. Sciortino, Phys. Rev. Lett. 91, 115504 (2003).
- (58) G. S. Matharoo, M. S. G. Razul, and Peter H. Poole, J. Chem. Phys. 130, 124512 (2009).
- (59) F. Sciortino and S. Sastry, J. Chem. Phys. 100, 3881 (1994).
- (60) E. La Nave, F. Sciortino, P. Tartaglia, C. De Michele, and S. Mossa, J. Phys.: Condens. Matter 15, S1085 (2003).
- (61) F. W. Starr, S. Sastry, E. La Nave, A. Scala, H. Eugene Stanley, and F. Sciortino, Phys. Rev. E 63, 041201 (2001).
- (62) S. Mossa, E. La Nave, F. Sciortino, and P. Tartaglia, Eur. Phys. J. B 30, 351 (2002).
- (63) S. Mossa, E. La Nave, P. Tartaglia,and F. Sciortino, J. Phys.: Condens. Matter 15, S351 (2003).
- (64) F. Sciortino and P. Tartaglia, Phys. Rev. Lett. 86, 107 (2001).
- (65) R. Martonâk, D. Donadio, and M. Parrinello, Phys. Rev. Lett. 92, 225702 (2004).
- (66) J. C. Palmer, F. Martelli, Y. Liu, R. Car, A. Z. Panagiotopoulos, P. G. Debenedetti, Nature 510, 385 (2014).
- (67) Y. Liu, J. C. Palmer, A. Z. Panagiotopoulos, ans P. G. Debenedetti, J. Chem. Phys. 137, 214505 (2012).
- (68) P. Poole, R. K. Bowles, I. Saika-Voivod, and F. Sciortino, J. Chem. Phys. 138, 034505 (2013).
- (69) A. Scala, F. W. Starr, E. La Nave, H. E. Stanley, and F. Sciortino, Phys. Rev. E 62, 8016 (2000).
- (70) F. Sciortino, E. La Nave, and P. Tartaglia, Phys. Rev. Lett. 91, 155701 (2003).
- (71) V. Molinero and E. B. Moore, J. Phys. Chem. B 113, 4008 (2009).
- (72) M. J. Cuthbertson and P. H. Poole, Phys. Rev. Lett. 106, 115706 (2011).
- (73) O. Mishima, Nature 384, 546 (1996).
- (74) I. Saika-Voivod, and F. Sciortino Phys. Rev. E 70, 041402 (2004).