White Dwarf Mass Distribution
Abstract
We present the mass distribution for all S/N15 pure DA white dwarfs detected in the Sloan Digital Sky Survey up to Data Release 12, fitted with Koester models for ML2/, and with K, and for DBs with S/N10, fitted with ML2/, for K. These mass distributions are for stars, i.e., excluding the Extremely Low Mass white dwarfs. We also present the mass distributions corrected by volume with the approach, for stars brighter than g=19. Both distributions have a maximum at but very distinct shapes. From the estimated z-distances, we deduce a disk scale height of 300 pc. We also present 10 probable halo white dwarfs, from their galactic U, V, W velocities.
1 Introduction
Stars born with initial masses up to 8.5–10.6 M (Woosley & Heger 2015), corresponding to at least 95% of all stars, become white dwarfs when they cannot fuse nuclear elements in the core anymore. For single star evolution, the minimum mass of the white dwarf is around 0.30– (e.g. Kilic et al. 2007). Considering the mass-radius relation of white dwarfs, this corresponds to a . Progenitors that would become lower mass white dwarfs live on the main sequence longer than the age of the Universe. We therefore determine our mass distribution only for white dwarfs with .
We estimated the masses of all DA white dwarfs found by Kleinman et al. (2013), Kepler et al. (2015) and Kepler et al. (2016a) among the 4.5 million spectra acquired by the Sloan Digital Sky Survey Data Release 12. For the mass distribution we only consider spectra with S/N to have reliable mass determinations. The spectra were fitted with synthetic spectra from model atmospheres of Koester (2010), using ML2/ for DAs, and ML2/, for DBs. We use the mass–radius relations of Althaus et al. (2005), Renedo et al. (2010) and Romero et al. (2015), to calculate the mass of our stars from the and values obtained from our fits, after correcting to 3D convection following Tremblay et al. (2013).
2 Mass Distribution
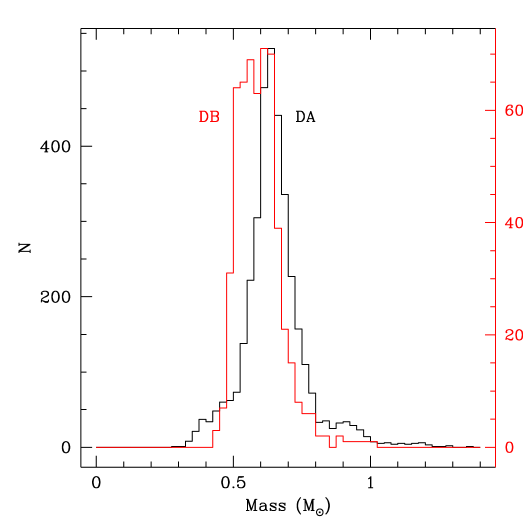
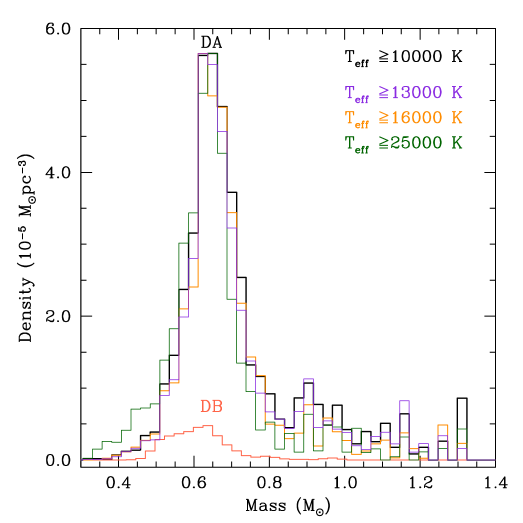
Figure 1 shows the mass distribution by number for DAs with K, where convection is unimportant, and for DBs with K reported by Koester & Kepler (2015). Because our surface gravities show an unexplained decrease below K, Figure 2 shows the mass distribution for different cutoff temperatures.
Considering white dwarfs with larger mass have smaller radius, and therefore can only be seen to smaller distances in a magnitude limited survey as SDSS, we calculated the density by correcting the visible volume with the method of Schmidt (1968), up to a maximum g=19 magnitude, shown in Figure 2. The distribution shows that the DA and DB distributions have very different shapes. The DA’s has a tail to larger masses, while the DB’s is extended to lower masses. This is probably reflecting some limitation in the progenitors that can undergo very-late thermal pulses and become DBs.
3 Discussion
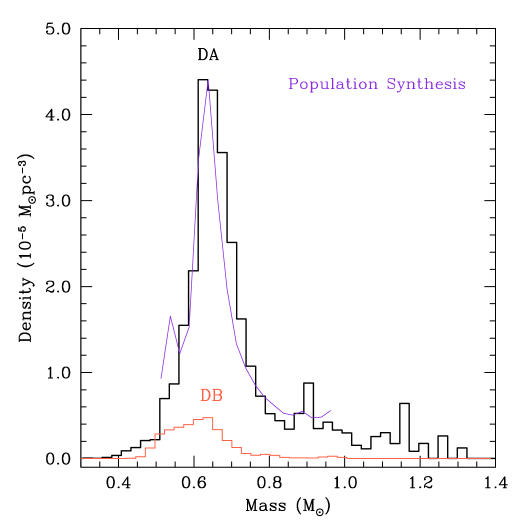
With our population synthesis analysis, we computed a theoretical mass distribution through a Monte Carlo simulation fitting single star initial mass functions, initial-to-final mass relations for masses , to obtain a history of star formation for the DAs with K. Figure 3 shows the mean mass around 0.64 requires a burst of star formation in the last 2 Gyr, as a white dwarf with such mass has a short lived progenitor mass with a mass around . This is in contrast with the uniform star formation estimated by Catalán et al. (2008) from the ML2/ mass distribution of Kepler et al. (2007).
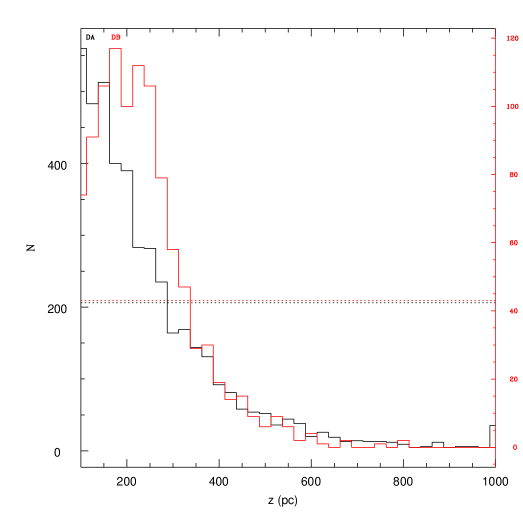
Convolving the intensities from the theoretical models with filter transmission curves, and appropriate zero-points, we estimated the corresponding absolute magnitudes. Comparing with the observed g-filter photometry we estimated the distance modulus, obtaining the distances. From distances and the galactic latitude, we estimated the distance of each star from the galactic plane z. Figure 4 shows the distance above the galactic plane for each star studied, showing the disc scale height is around 300 pc for DAs and a few parsecs larger for DBs.
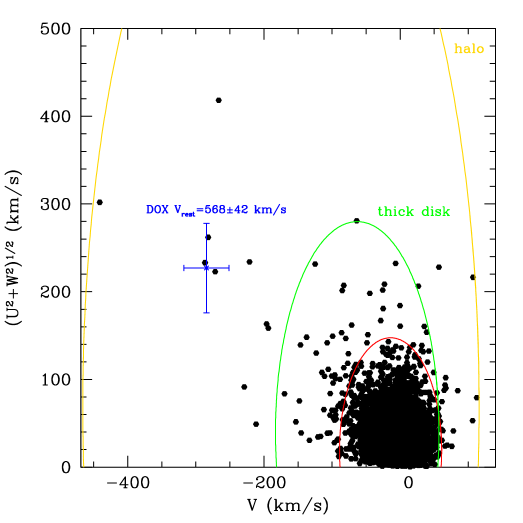
Finally, using the distances, our measured radial velocities and the proper motions obtained from APOP (Qi et al. 2015) only for those stars which has a measured proper motion larger than three times its uncertainty, we estimated the galactic velocities U, V, and W for each star (e.g Johnson & Soderblom 1987). We compared the proper motions from APOP (Qi et al. 2015) with those of Munn et al. (2014) and they are very similar. In Figure 5, we show the galactic velocities we infer for each star. As expected, most white dwarfs observed by SDSS belong to the thin and thick disk. Because of the saturation limit around , nearby white dwarfs only if very cool are included. The SDSS observations are also preferentially for directions across the galactic disk.
In Table 1 we list the 10 stars with galactic velocities outside the thin and thick disk ellipsis of Kordopatis et al. (2011), which are probably halo white dwarfs, or the result of a binary interaction.
| SDSS J | S/N | g | dist | z | |||||
|---|---|---|---|---|---|---|---|---|---|
| (mag) | (mag) | (K) | (K) | (cgs) | (cgs) | (pc) | (pc) | ||
| 081514.42+511311.39 | 33 | 17.647 | 0.014 | 74528 | 644 | 7.354 | 0.027 | 1142 | 634 |
| 091734.49+020924.37 | 15 | 18.882 | 0.015 | 16261 | 268 | 7.660 | 0.053 | 448 | 24 |
| 113219.73-075441.94 | 22 | 19.068 | 0.033 | 33820 | 256 | 7.240 | 0.057 | 1431 | 109 |
| 115045.04+191854.61 | 15 | 19.112 | 0.026 | 19135 | 247 | 8.122 | 0.040 | 407 | 39 |
| 121731.31+610520.36 | 31 | 18.075 | 0.017 | 41495 | 443 | 7.895 | 0.038 | 655 | 54 |
| 123827.80+312138.30 | 26 | 17.743 | 0.022 | 60285 | 1551 | 7.730 | 0.080 | 802 | 79 |
| 125816.99+000710.24 | 20 | 18.135 | 0.015 | 14910 | 159 | 7.870 | 0.035 | 256 | 22 |
| 152658.83+021510.19 | 17 | 18.871 | 0.016 | 48853 | 1297 | 7.200 | 0.098 | 1739 | 123 |
| 225513.66+230944.14 | 36 | 17.771 | 0.024 | 30007 | 118 | 7.522 | 0.020 | 529 | 28 |
| 230228.08+231747.90 | 21 | 19.441 | 0.010 | 40716 | 720 | 7.740 | 0.064 | 1054 | 57 |
Acknowledgments
SOK, ADR, GO and IP are supported by CNPq-Brazil. DK received support from program Science without Borders, MCIT/MEC-Brazil. This research has made use of NASA’s Astrophysics Data System and of the cross-match service provided by CDS, Strasbourg. Funding for the Sloan Digital Sky Survey has been provided by the Alfred P. Sloan Foundation, the U.S. Department of Energy Office of Science, and the Participating Institutions. The SDSS web site is www.sdss.org.
References
- Althaus et al. (2005) Althaus, L. G., García-Berro, E., Isern, J., & Córsico, A. H. 2005, A&A, 441, 689
- Catalán et al. (2008) Catalán, S., Isern, J., García-Berro, E., & Ribas, I. 2008, MNRAS, 387, 1693
- Johnson & Soderblom (1987) Johnson, D. R. H., & Soderblom, D. R. 1987, AJ, 93, 864
- Kepler et al. (2007) Kepler, S. O., Kleinman, S. J., Nitta, A., et al. 2007, MNRAS, 375, 1315
- Kepler et al. (2015) Kepler, S. O., Pelisoli, I., Koester, D., et al. 2015, MNRAS, 446, 4078
- Kepler et al. (2016a) Kepler, S. O., Pelisoli, I., Koester, D., et al. 2016, MNRAS, 455, 3413
- Kepler et al. (2016b) Kepler, S. O., Koester, D., & Ourique, G. 2016, Science, 352, 67
- Kilic et al. (2007) Kilic, M., Stanek, K. Z., & Pinsonneault, M. H. 2007, ApJ, 671, 761
- Kleinman et al. (2013) Kleinman, S. J., Kepler, S. O., Koester, D., et al. 2013, ApJS, 204, 5
- Koester (2010) Koester, D. 2010, MemSAI, 81, 921
- Koester & Kepler (2015) Koester, D., & Kepler, S. O. 2015, A&A, 583, A86
- Kordopatis et al. (2011) Kordopatis, G., Recio-Blanco, A., de Laverny, P., et al. 2011, A&A, 535, A107
- Munn et al. (2014) Munn, J. A., Harris, H. C., von Hippel, T., et al. 2014, AJ, 148, 132
- Qi et al. (2015) Qi, Z., Yu, Y., Bucciarelli, B., et al. 2015, AJ, 150, 137
- Renedo et al. (2010) Renedo, I., Althaus, L. G., Miller Bertolami, M. M., et al. 2010, ApJ, 717, 183
- Romero et al. (2015) Romero, A. D., Campos, F., & Kepler, S. O. 2015, MNRAS, 450, 3708
- Schmidt (1968) Schmidt, M. 1968, ApJ, 151, 393
- Tremblay et al. (2013) Tremblay, P.-E., Ludwig, H.-G., Steffen, M., & Freytag, B. 2013, A&A, 552, A13
- Woosley & Heger (2015) Woosley, S. E., & Heger, A. 2015, ApJ, 810, 34