Spectral Changes in the Hyperluminous Pulsar in NGC 5907 as a Function of Super-Orbital Phase
Abstract
We present broad-band, multi-epoch X-ray spectroscopy of the pulsating ultra-luminous X-ray source (ULX) in NGC 5907. Simultaneous XMM-Newton and NuSTAR data from 2014 are best described by a multi-color black-body model with a temperature gradient as a function of accretion disk radius significantly flatter than expected for a standard thin accretion disk (, with ). Additionally, we detect a hard power-law tail at energies above 10 keV, which we interpret as being due to Comptonization. We compare this observation to archival XMM-Newton, Chandra, and NuSTAR data from 2003, 2012, and 2013, and investigate possible spectral changes as a function of phase over the 78 d super-orbital period of this source. We find that observations taken around phases 0.3–0.4 show very similar temperature profiles, even though the observed flux varies significantly, while one observation taken around phase 0 has a significantly steeper profile. We discuss these findings in light of the recent discovery that the compact object is a neutron star and show that precession of the accretion disk or the neutron star can self-consistently explain most observed phenomena.
Subject headings:
X-rays: binaries — pulsars: individual (NGC 5907 ULX1) — accretion, accretion disks1. Introduction
Only a few sources in our Galaxy are known to be able to sustain luminosities close to the Eddington luminosity. However, in nearby galaxies many dozens of off-nuclear systems are known that reach luminosities greater than , the Eddington luminosity for a typical black hole binary with a mass of ; some of these exceed this luminosity by orders of magnitude (e.g., Swartz et al., 2008; Walton et al., 2011). Since these sources are significantly separated from the center of mass of their host galaxies, they cannot be related to 7super-massive black holes. We refer to these extreme accretors as ultra-luminous X-ray sources (ULXs).
Due to their high luminosity, it has been speculated that ULXs host intermediate mass black holes (IMBHs, see, e.g., Colbert & Mushotzky, 1999), which might provide important building blocks to form the super-massive black holes that power active galactic nuclei (Volonteri, 2010). In this case, and assuming accretion physics is largely mass-invariant, we would expect a power-law like hard X-ray spectrum, with a roll-over at energies keV produced by Comptonization in a hot corona. However, numerous studies have shown that most bright ULXs show a distinctly different spectral shape (e.g., Stobbart et al., 2006; Gladstone et al., 2009). In particular, in the NuSTAR era the high-energy (10 keV) spectra of bright ULXs have now become routinely observable. Such ULXs show a spectrum that seems thermal in origin, with a fast turn-over above keV.
The spectral shape of these ULXs is also distinctly different to the spectra seen in the sub-Eddington accretion regime of most Galactic binaries and active galaxies. They are therefore likely stellar remnants accreting above the Eddington rate and typically assumed to black holes. However, in a surprising discovery Bachetti et al. (2014) found that M82 X-2 is powered by a neutron star accreting at super-Eddington levels. Recently, two more neutron star powered ULXs were identified through their pulsations: NGC 7793 P13 (Fürst et al., 2016; Israel et al., 2016b) and NGC 5907 ULX1 (Israel et al., 2016a).
NGC 5907 ULX1 has been reported to exhibit peak luminosities of up to erg s-1, assuming a distance of 13.4 Mpc (Sutton et al., 2013). However, the most recent distance estimate by Tully et al. (2016) puts NGC 5907 at an even larger distance of 17.06 Mpc, which increases the peak luminosity to erg s-1, and places NGC 5907 ULX1 among the extremely rare subset of ULXs referred to as hyper-luminous X-ray sources ( erg s-1). Its neutron star nature makes it a completely unique source, which apparently is accreting at about 500 times the Eddington rate (Israel et al., 2016a).
Using XMM-Newton, Sutton et al. (2012, 2013) found that the spectrum of NGC 5907 ULX1 shows a tentative high-energy roll-over at about 5 keV, in line with expectations from super-Eddington accretion. Walton et al. (2015a, hereafter W15) analyzed broad-band XMM-Newton and NuSTAR and found a very good fit with a thermal spectrum, confirming the roll-over at high energies. This spectral shape is similar to many other ULX systems observed by NuSTAR in recent years (e.g., Bachetti et al., 2013; Walton et al., 2013, 2014, 2015a, 2015b; Rana et al., 2015; Mukherjee et al., 2015), many which could harbor black holes, due to their lack of pulsations (e.g., Doroshenko et al., 2015). The spectral similarity might indicate that the observed radiation is dominated by the effects of the super-Eddington accretion flow and not by the properties of the compact object.
W15 obtained two epochs of observations in 2013, but found the source in an “off-state” during the first observation, in which it was not detected by NuSTAR and was only marginally (at best) detected by XMM-Newton. In the second epoch, only 4 d later, the flux had recovered, having risen by at least 2 orders of magnitude. However, the observed 0.3–20.0 keV flux of erg s-1 cm-2 was still at the low end of typically observed fluxes for this source.
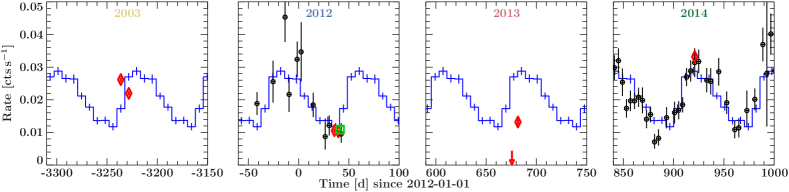
Following up on the remarkable flux variability observed in NGC 5907 ULX1, Walton et al. (2016a, hereafter W16) presented results of intense monitoring of the source with Swift/XRT over more than 2 years. While they did not observe another “off-state”, they found evidence for a stable 78 d period. This period is most likely super-orbital, as Israel et al. (2016a) find evidence in the timing data of NGC 5907 ULX1 for a 5 d orbital period. Figure 1 shows part of the Swift/XRT monitoring light curve with the average profile of the super-orbital period super-imposed. Extrapolating this profile back to the XMM-Newton observations taken in 2003 and 2012, we can see that the 2003 data were taken close to a high-state, while the 2012 data were taken close to the minimum of the profile. The 2013 and 2014 NuSTAR and XMM-Newton observations all fall close to the expected peak of this cycle, although the two 2013 observations both showed abnormally low fluxes for their phase.
Here we present observations taken simultaneously with XMM-Newton and NuSTAR during a high state of the 78 d period of NGC 5907 ULX1 in 2014 to obtain a higher quality X-ray spectrum above 10 keV and search for changes of the spectral parameters as function of luminosity and time. These data are also analyzed by Israel et al. (2016a).
2. Data reduction and observation
Besides the new NuSTAR and XMM-Newton observations of 2014, we use three more epochs of observations: XMM-Newton data taken in 2003, XMM-Newton and Chandra data taken in 2012, and XMM-Newton and NuSTAR data taken in 2013. The former two epochs were first analyzed by Sutton et al. (2013) and the 2013 data were presented by W15. For the remainder of this paper, we identify the epochs by the year they occurred in; see Table 1.
| Mission | ObsID | Startdate | Exposure (ks)aaXMM-Newton exposure time given for pn / MOS | 78 d phase |
|---|---|---|---|---|
| XMM-Newton | 0145190201 | 2003-02-20 | 29 / 43 | 0.15–0.26 |
| XMM-Newton | 0145190101 | 2003-02-28 | ||
| XMM-Newton | 0673920201 | 2012-02-05 | 19 / 32 | 0.03–0.08 |
| XMM-Newton | 0673920301 | 2012-02-09 | ||
| Chandra | 12987 | 2012-02-11 | 29 | 0.11-0.12 |
| Chandra | 14391 | 2012-02-11 | ||
| XMM-Newton | 0724810401 | 2013-11-12 | 23 / 32 | 0.30–0.31 |
| NuSTAR | 30002039005 | 2013-11-12 | 124 | 0.30–0.33 |
| XMM-Newton | 0729561301 | 2014-07-09 | 38 / 43 | 0.367–0.374 |
| NuSTAR | 80001042002 | 2014-07-09 | 132 | 0.36–0.42 |
| NuSTAR | 80001042004 | 2014-07-12 |
2.1. NuSTAR
NuSTAR (Harrison et al., 2013) data were extracted using the standard nustardas pipeline v1.6.0 as distributed with HEASOFT V6.19. We applied the CALDB 20160706. Source data were extracted from 50′′ regions centered on the source and within the pointing uncertainty for the J2000 coordinates of NGC 5907 ULX1. Background spectra were extracted from annuli centered on the same coordinates with inner radii of 90′′ and outer radii of 200′′. The source becomes background dominated around 10 keV and 20 keV for the 2013 and 2014 data, respectively. We therefore carefully checked that our choice of background region does not influence the results, finding consistent results when using a circular background region with a radius of 100′′ located elsewhere on the same chip. Note that we only use the second observation in 2013, as the source was not detected in the first one (W15).
We additionally extracted data taken in SCIENCE_SC (mode 06), during which the optical bench star tracker does not provide a solution for aspect reconstruction. While the source is therefore not reconstructed accurately on the sky, the responses can still be calculated correctly. We used regions of the same size centered on the centroid coordinates of the visible point source in these datasets. See Fürst et al. (2016) and Walton et al. (2016c) for details on mode 06 extraction. Using these data we add about 10% and 15% to the 2013 and 2014 data, respectively. This extra exposure time is included in Table 1.
The 2014 data were obtained during two separate observations, about 3 d apart (Table 1). We initially analyzed each observation separately but did not find any significant differences between them. We therefore added both observations and treat them as one epoch for the remainder of this paper.
2.2. XMM-Newton
The XMM-Newton (Jansen et al., 2001) observations were reduced with the XMM-Newton Science Analysis System (SAS) v14.0.0 following standard procedures. The raw data files were filtered using epchain and emchain to produce cleaned event lists for each of the EPIC-pn and EPIC-MOS detectors, respectively (Strüder et al., 2001; Turner et al., 2001). As recommended, we use only single and double events for EPIC-pn, and single to quadruple events for MOS. We exclude periods of high background flaring. Science products were then produced using xmmselect, with the source emission extracted from circular regions of radius 20–30′′ (depending on the source brightness and its proximity to bad detector columns) and the background estimated from larger areas on the same CCD free of other contaminating point sources. Redistribution matrices and auxiliary response files were generated with rmfgen and arfgen, respectively. After performing the data reduction separately for each of the two MOS detectors, we combined the data from these detectors into a single spectrum for each epoch using the FTOOL addascaspec.
2.3. Chandra
Chandra (Weisskopf et al., 2000) observed NGC 5907 ULX1 for two back-to-back observations in 2012 (Table 1). We extracted the ACIS-S with the standard CIAO v4.8 pipeline. The source spectra were extracted from circular regions with 3′′ radius centered on the J2000 coordinates, the background from 25′′ radius regions to the north-east from a source-free area. The spectra of the two observations were added with the CIAO tool combine_spectra. In addition, the Chandra observations were performed within a few days of the 2012 XMM-Newton observations and did not show significant changes in spectral shape or flux. We therefore treat all the 2012 data as a single epoch in the following analysis.
3. Spectral Analysis
For all our spectral fits we assume a Galactic absorption column of cm-2 (Kalberla et al., 2005). We model the absorption with an updated version of the tbabs model (Wilms et al., 2000), using the corresponding abundances and cross-sections from Verner et al. (1996). We allow for an additional absorption column intrinsic to the ULX or NGC 5907, as found by Sutton et al. (2013) and W15.
The data were fitted using the Interactive Spectral Interpretation System (ISIS v1.6.2, Houck & Denicola, 2000). We rebinned the NuSTAR data in ISIS to a signal-to-noise ratio (S/N) of 4 below 10 keV and 3 above. We additionally rebinned the data by at least a factor of 3 to prevent oversampling of the energy resolution. The XMM-Newton EPIC-pn data were rebinned to a S/N of 6 below 5 keV and 4 above, while the MOS data were rebinned to a S/N of 5 below 5 keV and 3 above. We use the XMM-Newton data in the energy range between 0.5–10 keV and NuSTAR between 3–40 keV. The Chandra data were rebinned to a S/N of 4 between 0.5–10 keV.
3.1. The 2014 epoch
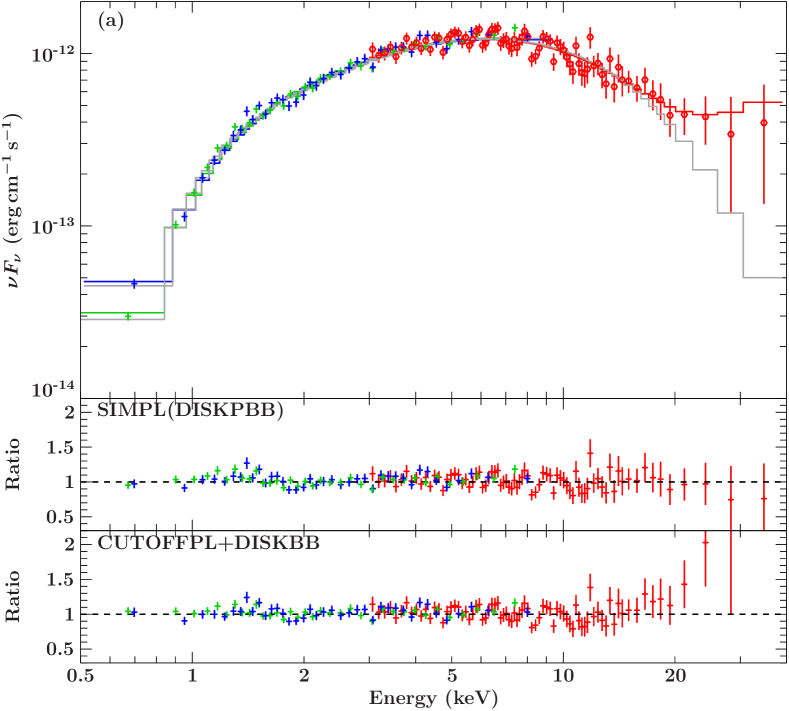
The 2014 data clearly show a hard spectrum with a visible turnover at high energies (Figure 2). Neither a pure power power-law ( dof) nor a simple multi-color blackbody of a geometrically thin, optically thick disk accretion disk (diskbb, dof) adequately describe this shape. This is very similar to other ULXs studied by NuSTAR and to previous studies of NGC 5907 ULX1 (Sutton et al., 2013; Israel et al., 2016a).
A phenomenological cutoff power-law model (cutoffpl), however, provides an acceptable fit with for 666 dof. This model can be improved by adding a diskbb model with a temperature of keV ( for 664 d.o.f., for two additional parameters). Such a model is often used to describe Galactic binaries (e.g. McClintock & Remillard, 2006). However, while the NGC 5907 ULX1 spectrum is dominated by the power-law component, similar to the low/hard state of black hole binaries, the values we obtain are very different, e.g., the photon-index is much harder ( instead of 1.4–1.8) and the folding energy much lower ( keV instead of keV; see, e.g., Fürst et al. 2015).
A more physically motivated model is the diskpbb model (Mineshige et al., 1994), which allows for a variation of the temperature gradient of the multicolor black-body, with . Recent NuSTAR results have shown that ULX spectra are often well described with a temperature gradient somewhat shallower than the canonical expected for a thin disk (e.g., Bachetti et al., 2013; Brightman et al., 2016). Such shallower gradients are expected in sources with very high to super-Eddington luminosities, in which the accretion disk can increase its geometrical thickness due to radiation pressure and advection (Abramowicz et al., 1988). We obtain a comparable fit to the cutoff power-law model with for 666 dof. We find and keV.
However, this model leaves significant residuals at the highest energies. Such a hard energy excess is expected if a significant fraction of the thermal photons are Compton scattered to higher energies, resulting in an additional high-energy power law continuum. Evidence for an additional high-energy power law continuum has now been observed in several ULXs (e.g., Walton et al., 2013, 2014, 2015b; Mukherjee et al., 2015). Here we model the hard excess with the simpl model (Steiner et al., 2009), which emulates up-scattering of the thermal seed photons into a power law tail. We find an excellent fit with for 664 dof ( for two additional parameters, Table 2). We find a scattering fraction (i.e., flux in the power law tail) of ; however, this value is highly degenerate with the photon index. The corresponding -landscape is complex so that a simple uncertainty estimation is not possible. By using the XSPEC steppar command in the 2D-space between and , we find that has a lower limit of 0.036 at 90% confidence. We do not find an upper limit due to the fact that can become very high, i.e., steep.
In all these models a small excess around 1.5 keV is visible, which can be linked to larger calibration uncertainties around the known “silicon bump” (Read et al., 2014).
| 2014 | 2013 | 2012 | 2003 | ||
|---|---|---|---|---|---|
| Parameter | Cpl+Diskbb | Simpl(Diskpbb) | Simpl(Diskpbb) | Diskpbb | Diskpbb |
| — | — | ||||
| — | — | — | — | ||
| — | |||||
| — | ccfor a fixed value of | — | — | ||
| erg s-1)ddluminosity between 0.5–10 keV for a distance of 13.4 Mpc | |||||
| erg s-1)eeluminosity between 0.5–10 keV for a distance of 17.1 Mpc | |||||
| 723.52/664 | 725.49/664 | 268.09/231 | 197.78/214 | 382.06/411 | |
| 1.090 | 1.093 | 1.161 | 0.924 | 0.930 | |
3.2. Comparison to archival observations
To put the 2014 data into context with previous observations of NGC 5907 ULX1, we perform our own analysis of the 2003, 2012, and 2013 epochs (Figure 1, Table 1). We fit the 2013 broad-band data with the same simpldiskpbb model used for the 2014 data. For the XMM-Newton-only observations in 2003 and the XMM-Newton plus Chandra observation in 2012 we did not include the simpl model, as the lack of coverage at high energies does not allow us to constrain its parameters. As can be seen in Figure 2, the hard tail modeled by the simpl model only becomes relevant above 15 keV. We also did not use the diskbb + cutoffpl model, as the power-law parameters could only be very weakly constrained with the soft data alone.
The best-fit values for all epochs are given in Table 2. The 2012 and 2013 observations have a very similar 0.5–10 keV flux, around , while both the 2003 and 2014 observations have a higher flux (). However, neither the disk temperature nor the temperature gradient show a clear correlation with flux. Instead, the 2012 data show a significantly higher value of than the other observations, which are all consistent with each other. With respect to the temperature, all observations are consistent within their uncertainties.
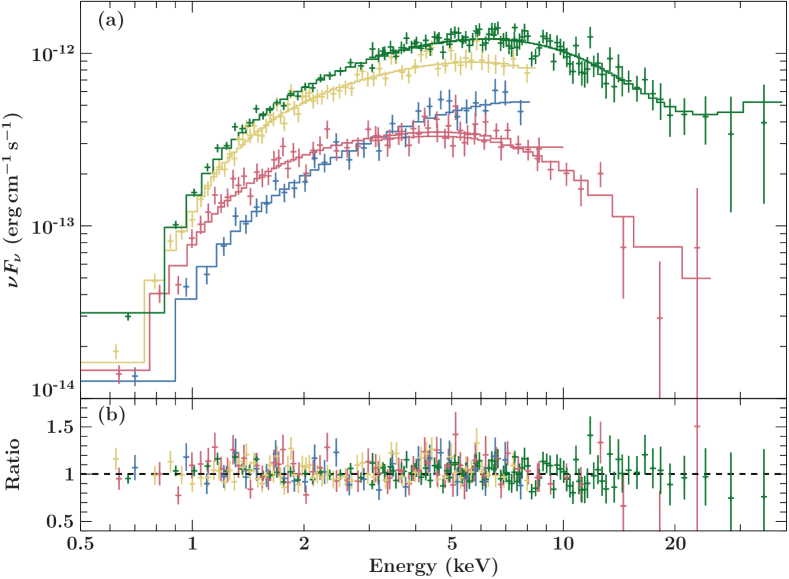
The difference can also be seen in Figure 3, where we show the unfolded spectra of all four epochs. While the observations in 2012 and 2013 show very similar fluxes, their spectral shapes are distinctly different, with the 2012 flux rising much more steeply with energy. On the other hand, the 2003 and 2014 data agree very well with each other.
We find a tentative trend of the spectral parameters as a function of 78 d-phase. We list the phases of each epoch in Table 1 and plot the values of and versus flux and phase, respectively, in Figure 4. The 2003, 2013, and 2014 data were all taken around phases 0.2–0.4 and show low values of . On the other hand, the 2012 data were taken close to phase 0 and is significantly higher, albeit with large uncertainties.
We note, however, that the phase of the 2003 data is relatively uncertain, as the period was extrapolated back by over 10 years. With an estimated uncertainty of d on the period (W16), the 2003 data can be located at phases between and 0.58. For the following discussion we will nonetheless assume the predicted value of .
To check if the spectral variation with 78 d-phase is stable over longer periods of time, we extracted spectra from the Swift/XRT monitoring campaign between 2014 March and 2016 July using the online Swift/XRT data products generator (Evans et al., 2009). We selected data for the low-phase spectra between phases and for the high phase between , based on a period of d and MJD, the minimum of the profile. While the data quality of these XRT spectra are not sufficient to confirm the spectral changes seen in the XMM-Newton data, they are fully consistent with the respective XMM-Newton models.
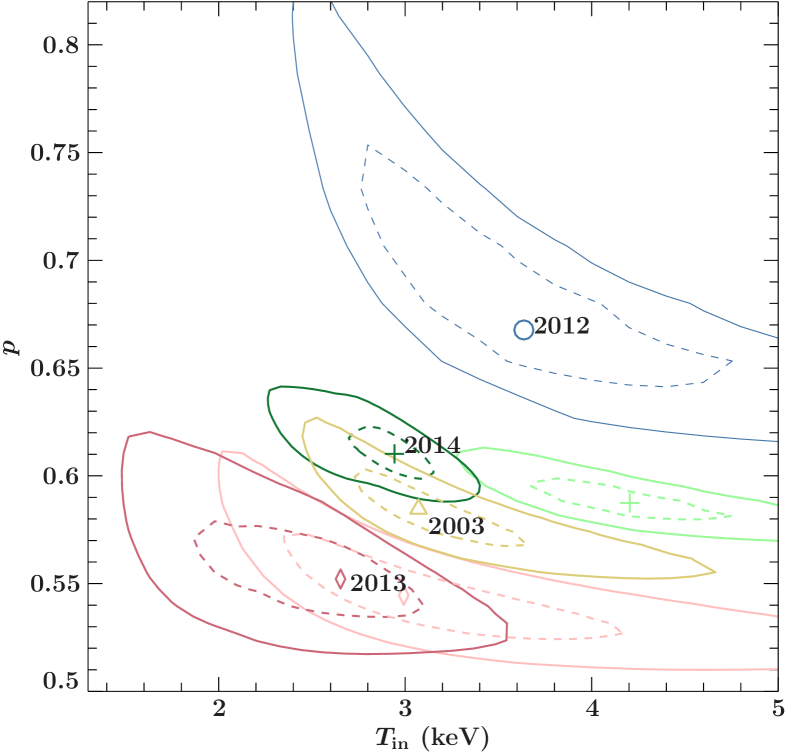
To look for possible degeneracies between and temperature, we calculate confidence contours for these two parameters for each observation, shown in Figure 5. We find that the 2003 and 2014 data are compatible with each other, while both the 2012 and 2013 data are significantly different. The 2012 data are consistent within their uncertainties with a standard temperature profile for a thin disk (i.e., , Shakura & Sunyaev, 1973).
The uncertainties in are also influenced by the variability of the absorption column. If we fix the column at cm-2, the average value of all four epochs, we find drastically smaller confidence contours while finding statistically comparable fits ( in all cases). All contours are fully within the contours presented in Figure 5, however, we note that the 2012 data are no longer consistent with values , thus ruling out a standard thin disk. As we do not know if the intrinsic absorption column has changed between observations, we continue our discussion with the model in which the column is allowed to vary independently between observations.
We also show contours for 2013 and 2014 using the XMM-Newton data only, to investigate if only using data below 10 keV results in a systematic parameter shift. These contours are shown in light color in Figure 5. We find that the XMM-Newton-only data seem to prefer a higher temperature, but find almost the same values for . This is not surprising as the peak of the spectrum, which determines the temperature, is at the edge of the XMM-Newton range, while is most relevant at lower energies and determines the slope of the spectrum up to the peak. Therefore the XMM-Newton data drive , while the temperature is mainly determined through the high-energy coverage of NuSTAR.
4. Discussion and conclusions
We have presented a detailed analysis of the broad-band spectrum of NGC 5907 ULX1 taken simultaneously by NuSTAR and XMM-Newton during a bright phase in 2014 where the luminosity was erg s-1. We find that the spectrum is very well described by a multi-color black-body with a temperature profile with , which is shallower than the expected value of for a thin disk (Shakura & Sunyaev, 1973). This suggests that advection plays an important role in the accretion disk during that observation.
At energies above 15 keV we find evidence for a hard excess over the thermal continuum, which we describe by a power-law tail due to Comptonization of the disk photons. Even though the photon-index of this power-law could not be well constrained, this component provides a significant improvement in terms of ( for two additional parameters). Given that the pulsed fraction is increasing with energy (Israel et al., 2016a), this power-law tail is likely connected to a hard continuum from the accretion column.
It is currently not known how the accretion disk is structured in neutron star ULXs. While for the often implied strong magnetic fields of these systems (e.g., Dall’Osso et al., 2015; Mushtukov et al., 2015; Tong, 2015), a truncation of the disk at 1400 km radii is expected, due to the very high luminosity of NGC 5907 ULX1 the spherization radius is still about an order of magnitude larger than the magnetospheric radius (King & Lasota, 2016). This implies that a geometrically thick disk is present, in which advection becomes important, in agreement with our spectral models. However, to sustain super-Eddington accretion rates, Israel et al. (2016a) argue that the disk has to be thin at the magnetospheric radius to not engulf the neutron star up to high magnetic latitudes. This problem could be mitigated by strong geometrical collimation, allowing the radiation to escape along a narrow funnel, which, however, is at odds with the observed smooth sinusoidal pulse profile (see also Fürst et al., 2016; Bachetti et al., 2014).
We put the 2014 data into context with observations taken in 2003, 2012, and 2013. We find that in all observations the modeled disk temperature is similar, with keV. Assuming a slim-disk accretion geometry, we might therefore assume that we always see the hottest, innermost part of the accretion disk which is likely located close to the magnetospheric radius . Israel et al. (2016a) argue that the surface magnetic field of NGC 5907 ULX1 should be around G, which implies km (Cui, 1997). If we assume that the observed radiation is dominated by the accretion disk, we can estimate the viewing angle from the normalization of the diskpbb model.
We follow the description of Soria et al. (2015) and Brightman et al. (2016). We assume a color correction factor of and a geometric factor , appropriate for the high Eddington fraction of NGC 5907 ULX1 (Soria et al., 2015). We then calculate the inclination as:
| (1) |
Where is the normalization of the diskpbb model and is the distance in units of 10 kpc. This results in an almost edge-on view of .
This inclination is very high and makes it difficult to explain how we would be able to see the regions close to the compact object at all, as in super-Eddington accretion the accretion disk is expected to have some geometrical thickness, blocking our line-of-sight. The result depends on our assumptions of and , but we obtain high inclinations for all realistic assumptions (e.g., , Watarai & Mineshige, 2003). About 20% of the observed flux is pulsed (Israel et al., 2016a), indicating that it is produced by the rotating accretion column of the neutron star. A lower flux from the disk, however, increases the estimated inclination further.
Another large systematic uncertainty in this estimate is the strength of the magnetic field, and the location of the hottest part of the disk. King & Lasota (2016) argue that a low magnetic field ( G) can explain the observed timing properties of M82 X-2, which are very similar to NGC 5907 ULX1. With a lower magnetic field and a consequently much smaller magnetospheric radius the implied inclination would be smaller. In fact, in a face-on geometry () we would imply a magnetic field of G for the inner disk radius to be at the magnetospheric radius during the bright 2014 observation.
4.1. The 2013 observation
The 2013 observation shows a distinctly different spectrum than the 2012 observation, despite having a very similar flux. It also shows a significantly different spectrum than both the 2003 and 2014 observations, despite being located in phase between them. This behavior might be related to the fact that the 2013 data were obtained only 4 d after the source’s luminosity was below the detection limit of XMM-Newton and NuSTAR (W15). This remarkable drop in luminosity is clearly not related to the stable 78 d-period, and so far has not been seen to repeat (W16). It is reasonable to expect that it is caused by the so-called “propeller effect” or the centrifugal inhibition of accretion, where the magnetospheric radius becomes larger than the corotation radius. This regime can be entered if the ram pressure of the accreting material drops, leading to a further dramatic reduction in accretion rate and consequently luminosity. During such a state, the inner accretion disk would get depleted, and the slightly lower temperature measured could be an indication that the inner accretion disk was still in the process of refilling during the second 2013 observation in which the source was detected.
4.2. Connection between the super-orbital period and spectral changes
W16 argued that the 78 d-period is most likely either orbital or super-orbital in nature. The new results by Israel et al. (2016a) indicate an orbital period of 5 d, confirming the super-orbital nature of the 78 d period.
The physical origin of super-orbital periods is often linked to precession of the accretion disk. Such precession could explain the observed regular flux variations without changes in the physical conditions of the accretion flow, as our viewing angle would change periodically (as also postulated for the ULX M82 X-2, Kong et al., 2016). Using the ratio of the diskpbb normalizations and the geometric effect that the flux is reduced by , under the assumption that the disk is relatively flat, we can calculate the required change in inclination angle . The largest variance in is required if we observe NGC 5907 ULX1 face-on () during the bright phase. This would require an inclination angle of during the faint phases (based on the 2012 data) and a half opening angle of the precession of . This is lower than the precession seen in SS 433 (Khabibullin & Sazonov, 2016), which is often argued to be a Galactic example of super-Eddington accretion analogous to ULXs, but viewed close to edge-on such that the X-ray emitting regions are obscured from view (Fabrika, 2004). While a face-on view is in contradiction to the estimated viewing angle from the model normalization assuming a strong magnetic field, it shows that a varying viewing angle is a possible explanation of the observed flux changes for all inclinations.
While a precessing disk can naturally explain the differences in observed flux across the 78-day cycle, we need to understand how different spectral shapes can be measured at different viewing angles. From Figure 4 it is clear that the strongest spectral change is observed in . At super-Eddington accretion rates it is expected that the accretion disk is flared up due to radiation pressure, i.e., becomes geometrically thick and increases in size with radius. In addition a strong wind is launched, which is also largely optically thick (Poutanen et al., 2007; Dotan & Shaviv, 2011) and for which observational evidence has recently been found in NGC 1313 X-1 and NGC 5408 X-1(Pinto et al., 2016; Walton et al., 2016b). The observed temperature profile therefore depends on which parts and with what angle we observe the accretion disk. Qualitatively we can envision a geometry where the apparent temperature gradient in the disk is changing as a function of viewing angle. Detailed calculations of this model are, however, beyond the scope of this paper.
Israel et al. (2016a) did not find pulsations in the 2012 and 2013 XMM-Newton observations and give an upper limit of a pulsed fraction of 12%. Both these observations were taken at low apparent luminosities. If these changes are connected to real changes in accretion rate, the properties of the accretion column might change. For a lower accretion rate, as observed in 2013, the emission pattern of the accretion column might be wider, resulting in a reduced pulsed fraction.
We have argued that the low observed flux of the 2012 data is not due to a lower intrinsic flux, but due to a change in viewing angle. This seems at first difficult to reconcile with the disappearing of pulsations. However, it is also possible that the neutron star shows free precession, in step with the precession of the accretion disk (e.g., as discussed for Her X-1, Staubert et al., 2013). In this case, the rotational axis at early super-orbital phases might be aligned close to our line of sight or, if the emission is axial-symmetric, close to 90∘, also reducing the observable pulsed fraction.
It is clear that to understand super-Eddington neutron stars like NGC 5907 ULX1 more observational and theoretical work needs to be done. For example, the currently available coverage of the phase-space is concentrated between phases 0–0.5. For a detailed test of the proposed spectral evolution and model, broad-band observations at later phases are necessary, which can be obtained with XMM-Newton and NuSTAR. NGC 5907 ULX1 is an ideal target for these studies, given the stable and strong 78 d-period. Its spectral similarities to other ULXs will help us understand this class of objects better and investigate how the type of compact object influences their behavior.
References
- Abramowicz et al. (1988) Abramowicz M.A., Czerny B., Lasota J.P., Szuszkiewicz E., 1988, ApJ 332, 646
- Bachetti et al. (2014) Bachetti M., Harrison F.A., Walton D.J., et al., 2014, Nat 514, 202
- Bachetti et al. (2013) Bachetti M., Rana V., Walton D.J., et al., 2013, ApJ 778, 163
- Brightman et al. (2016) Brightman M., Harrison F.A., Barret D., et al., 2016, ApJ 829, 28
- Colbert & Mushotzky (1999) Colbert E.J.M., Mushotzky R.F., 1999, ApJ 519, 89
- Cui (1997) Cui W., 1997, ApJL 482, L163
- Dall’Osso et al. (2015) Dall’Osso S., Perna R., Stella L., 2015, MNRAS 449, 2144
- Doroshenko et al. (2015) Doroshenko V., Santangelo A., Ducci L., 2015, A&A 579, A22
- Dotan & Shaviv (2011) Dotan C., Shaviv N.J., 2011, MNRAS 413, 1623
- Evans et al. (2009) Evans P.A., Beardmore A.P., Page K.L., et al., 2009, MNRAS 397, 1177
- Fabrika (2004) Fabrika S., 2004, Astrophysics and Space Physics Reviews 12, 1
- Fürst et al. (2016) Fürst F., Grinberg V., Tomsick J.A., et al., 2016, ApJ 828, 34
- Fürst et al. (2015) Fürst F., Nowak M.A., Tomsick J.A., et al., 2015, ApJ 808, 122
- Fürst et al. (2016) Fürst F., Walton D.J., Harrison F.A., et al., 2016, ApjL, submitted; arXiv:1609.07129
- Gladstone et al. (2009) Gladstone J.C., Roberts T.P., Done C., 2009, MNRAS 397, 1836
- Harrison et al. (2013) Harrison F.A., Craig W., Christensen F., et al., 2013, ApJ 770, 103
- Houck & Denicola (2000) Houck J.C., Denicola L.A., 2000, In: Manset N., Veillet C., Crabtree D. (eds.) Astronomical Data Analysis Software and Systems IX, Vol. 216. Astronomical Society of the Pacific Conference Series, Astron. Soc. Pac., San Francisco, p. 591
- Israel et al. (2016a) Israel G.L., Belfiore A., Stella L., et al., 2016a, arXiv:1609.07375
- Israel et al. (2016b) Israel G.L., Papitto A., Esposito P., et al., 2016b, MNRAS, submitted; arXiv:1609.06538
- Jansen et al. (2001) Jansen F., Lumb D., Altieri B., et al., 2001, A&A 365, 6
- Kalberla et al. (2005) Kalberla P.M.W., Burton W.B., Hartmann D., et al., 2005, A&A 440, 775
- Khabibullin & Sazonov (2016) Khabibullin I., Sazonov S., 2016, MNRAS 457, 3963
- King & Lasota (2016) King A., Lasota J.P., 2016, MNRAS 458, L10
- Kong et al. (2016) Kong A.K.H., Hu C.P., Lin L.C.C., et al., 2016, MNRAS 461, 4395
- McClintock & Remillard (2006) McClintock J.E., Remillard R.A., 2006, In: Lewin W.H.G., van der Klis M. (eds.) Compact stellar X-ray sources., p.157
- Mineshige et al. (1994) Mineshige S., Hirano A., Kitamoto S., et al., 1994, ApJ 426, 308
- Mukherjee et al. (2015) Mukherjee E.S., Walton D.J., Bachetti M., et al., 2015, ApJ 808, 64
- Mushtukov et al. (2015) Mushtukov A.A., Suleimanov V.F., Tsygankov S.S., Poutanen J., 2015, MNRAS 454, 2539
- Pinto et al. (2016) Pinto C., Middleton M.J., Fabian A.C., 2016, Nat 533, 64
- Poutanen et al. (2007) Poutanen J., Lipunova G., Fabrika S., et al., 2007, MNRAS 377, 1187
- Rana et al. (2015) Rana V., Harrison F.A., Bachetti M., et al., 2015, ApJ 799, 121
- Read et al. (2014) Read A.M., Guainazzi M., Sembay S., 2014, A&A 564, A75
- Shakura & Sunyaev (1973) Shakura N.I., Sunyaev R.A., 1973, A&A 24, 337
- Soria et al. (2015) Soria R., Kuntz K.D., Long K.S., et al., 2015, ApJ 799, 140
- Staubert et al. (2013) Staubert R., Klochkov D., Vasco D., et al., 2013, A&A 550, A110
- Steiner et al. (2009) Steiner J.F., Narayan R., McClintock J.E., Ebisawa K., 2009, PASP 121, 1279
- Stobbart et al. (2006) Stobbart A.M., Roberts T.P., Wilms J., 2006, MNRAS 368, 397
- Strüder et al. (2001) Strüder L., Briel U., Dennerl K., et al., 2001, A&A 365, L18
- Sutton et al. (2013) Sutton A.D., Roberts T.P., Middleton M.J., 2013, MNRAS 435, 1758
- Sutton et al. (2012) Sutton A.D., Roberts T.P., Walton D.J., et al., 2012, MNRAS 423, 1154
- Swartz et al. (2008) Swartz D.A., Soria R., Tennant A.F., 2008, ApJ 684, 282
- Tong (2015) Tong H., 2015, Research in Astronomy and Astrophysics 15, 517
- Tully et al. (2016) Tully R.B., Courtois H.M., Sorce J.G., 2016, AJ 152, 50
- Turner et al. (2001) Turner M.J.L., Abbey A., Arnaud M., et al., 2001, A&A 365, L27
- Verner et al. (1996) Verner D.A., Ferland G.J., Korista K.T., Yakovlev D.G., 1996, ApJ 465, 487
- Volonteri (2010) Volonteri M., 2010, Astron. Astrophys. Rev. 18, 279
- Walton et al. (2013) Walton D.J., Fuerst F., Harrison F., et al., 2013, ApJ 779, 148
- Walton et al. (2016a) Walton D.J., Fürst F., Bachetti M., et al., 2016a, ApJL 827, L13 (W16)
- Walton et al. (2015a) Walton D.J., Harrison F.A., Bachetti M., et al., 2015a, ApJ 799, 122 (W15)
- Walton et al. (2014) Walton D.J., Harrison F.A., Grefenstette B.W., et al., 2014, ApJ 793, 21
- Walton et al. (2016b) Walton D.J., Middleton M.J., Pinto C., et al., 2016b, ApJL 826, L26
- Walton et al. (2015b) Walton D.J., Middleton M.J., Rana V., et al., 2015b, ApJ 806, 65
- Walton et al. (2011) Walton D.J., Roberts T.P., Mateos S., Heard V., 2011, MNRAS 416, 1844
- Walton et al. (2016c) Walton D.J., Tomsick J.A., Madsen K.K., et al., 2016c, ApJ 826, 87
- Watarai & Mineshige (2003) Watarai K.y., Mineshige S., 2003, ApJ 596, 421
- Weisskopf et al. (2000) Weisskopf M.C., Tananbaum H.D., Van Speybroeck L.P., O’Dell S.L., 2000, In: Truemper J.E., Aschenbach B., Truemper J.E., Aschenbach B. (eds.) Proc. SPIE Vol. 4012, 2-16, X-Ray Optics, Instruments, and Missions III, Vol. 4012., p.2
- Wilms et al. (2000) Wilms J., Allen A., McCray R., 2000, ApJ 542, 914