75282 11institutetext: School of Astronomy, Institute for Research in Fundamental Sciences (IPM), P.O. Box 19395-5531, Tehran, Iran, 11email: atefeh@ipm.ir 22institutetext: Astrophysics Group, Lennard-Jones Laboratories, Keele University, ST5 5BG, UK
The Role of AGB Stars Feedback in Sustaining Galaxy Evolution
Abstract
We have conducted a near-infrared monitoring campaign at the UK InfraRed Telescope, of the Local Group spiral galaxy M33. The main aim was to identify stars in the very final stage of their evolution, and for which the luminosity is more directly related to the birth mass than the more numerous less–evolved giant stars that continue to increase in luminosity. In first instance, only the central square kiloparsec were monitored and analysed, with the UIST camera. Photometry was obtained for 18,398 stars; of these 812 stars were found to be variable, most of which are asymptotic giant branch (AGB) stars. We constructed the birth mass function and hence derived the star formation history. These stars are also important dust factories. We measure their dust production rates from a combination of our data with Spitzer Space Telescope mid-IR photometry. The mass loss rates are seen to increase with increasing strength of pulsation and with increasing bolometric luminosity. We construct a 2D map of the mass return rate, showing a radial decline but also local enhancements due to the concentration of red supergiants. We conclude that star formation in the central region of M33 can only be sustained if gas is accreted from further out in the disc or from circum–galactic regions. By using data of wide-field camera (WFCAM), the campaign was expanded to cover two orders of magnitude larger area, comprising the disc of M33 and its spiral arms. Photometry was obtained for 403,734 stars; of these 4643 stars were found to be variable. We here present the star formation history across the disc of M 33.
keywords:
stars: evolution – stars: luminosity function, mass function – stars: mass-loss – stars: oscillations – galaxies: individual: M 33 – galaxies: stellar content1 Introduction
Galactic evolution is driven at the end–points of stellar evolution, where copious mass loss returns chemically–enriched and sometimes dusty matter back to the interstellar medium (ISM); the stellar winds of evolved stars and the violent deaths of the most massive stars also inject energy and momentum into the ISM, generating turbulence and galactic fountains when superbubbles pop as they reach the “surface” of the galactic disc. The evolved stars are also excellent tracers, not just of the feedback processes, but also of the underlying populations, that were formed from millions to billions of years prior to their appearance. The evolved phases of evolution generally represent the most luminous, and often the coolest, making evolved stars brilliant beacons at IR wavelengths. The final stages of stellar evolution of stars with main-sequence masses up to M⊙ – Asymptotic Giant Branch (AGB) stars and red supergiants – are characterised by strong radial pulsations of the cool atmospheric layers, rendering them identifiable as long-period variables (LPVs) in photometric monitoring campaigns spanning months to years (e.g., Whitelock et al. 1991).
M 33 is the nearest spiral galaxy besides the Andromeda galaxy, and seen under a more favorable angle. This makes M 33 ideal to study the structure and evolution of a spiral galaxy. We will thus learn how our own galaxy the Milky Way formed and evolved, which is difficult to do directly due to our position within its dusty disc.
Our methodology comprises three stages:
[1] find stars that vary in brightness with large amplitude (about a magnitude) and long period (months to years), and identify them by their colours and luminosity as cool giant stars at the endpoints of their evolution;
[2] use the fact that these stars no longer evolve in brightness, to uniquely relate their brightness to their birth mass, and use the birth mass distribution to construct the star formation history (SFH);
[3] measure the excess infrared emission from dust produced by these stars, to quantify the amount of matter they return to the interstellar medium in M 33.
2 Observations
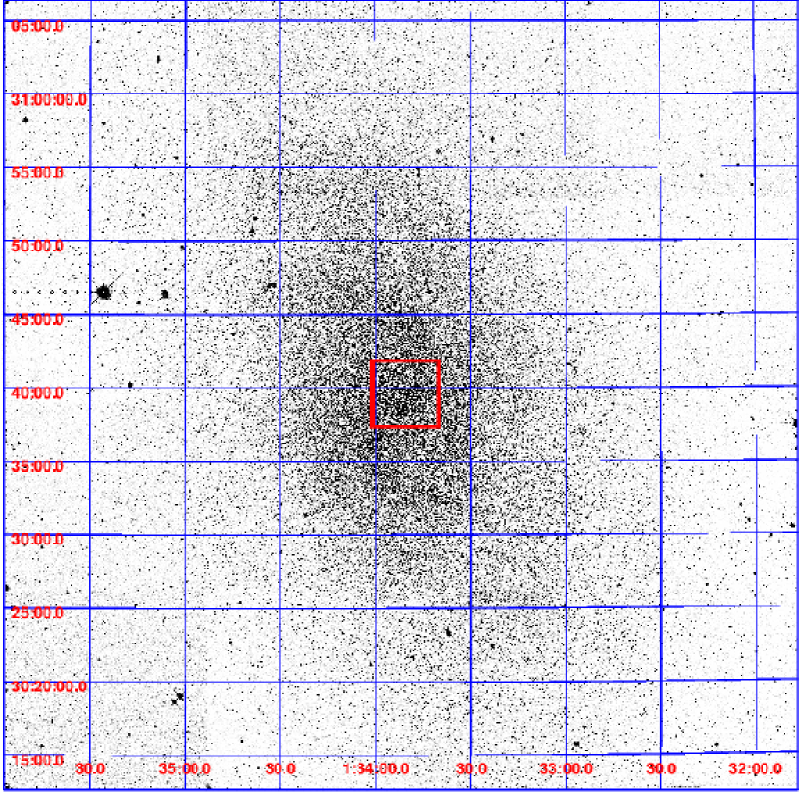
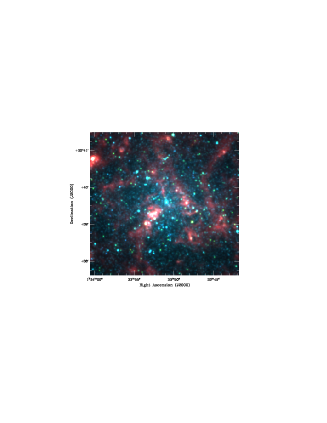
For observations we used three of UKIRT’s imagers: UIST, UFTI and WFCAM. UIST and UFTI cover the central part ( 1kpc2 ) while WFCAM covers a much larger part of M 33 (15 kpc 15 kpc). The combined, square–degree mosaic of M 33 in the K–band is shown in Fig. 1. The square–kpc central area is represented with a box.
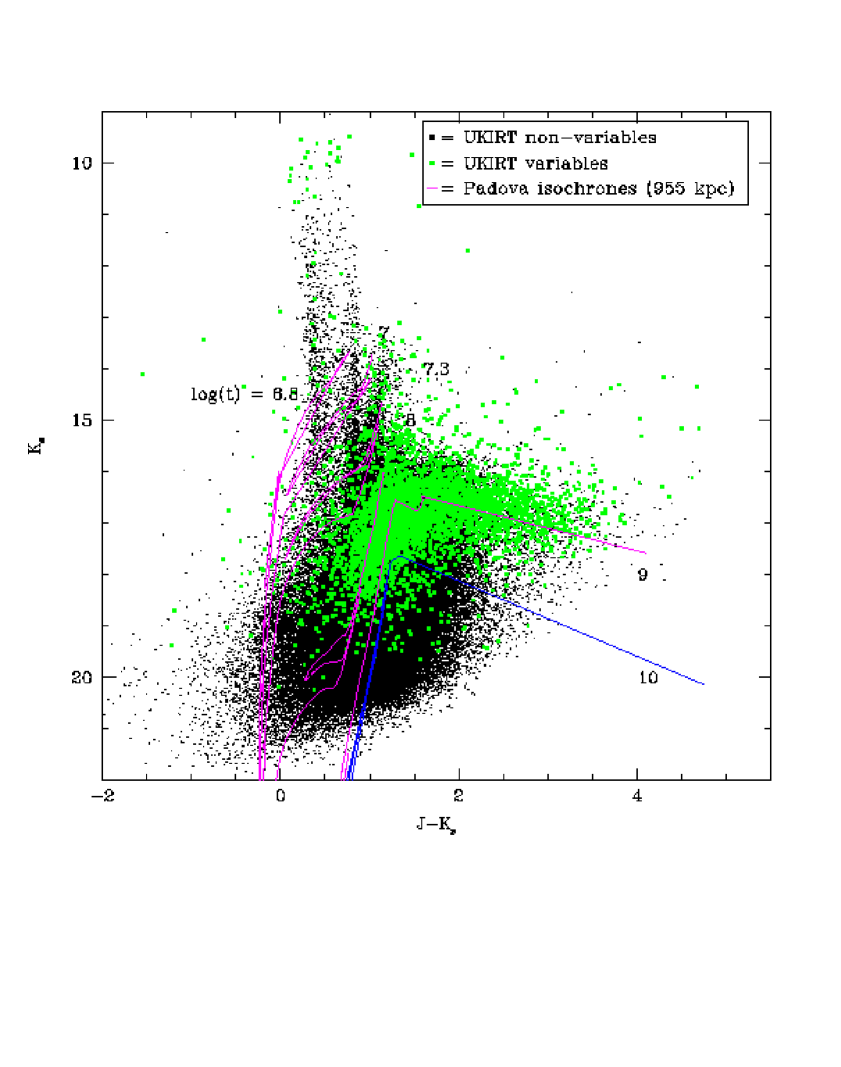
The survey and identification of variable stars are described in detail in Javadi et al. (2011, paper I) and Javadi et al. (2015, paper IV); 812 variable stars were identified in the central square kiloparsec of M 33 by using multi–epoch UIST data and 4643 variable stars were found across the galactic disc of M 33 by using multi–epoch data from WFCAM (Fig. 2).
3 The Star Formation History in M 33
In paper II, we have developed a novel way to derive the star formation history by using large–amplitude variable stars which are identified in our IR monitoring programme. We used the fact that these variables have reached the very final stages of their evolution, and their brightness can thus be transformed into their mass at birth by employing theoretical evolutionary tracks or isochrones. The LPVs are located at the cool end of each of the isochrones and this is confirmed by inspection of isochrones. Therefore, we simply could construct a link between the observed K–band magnitude and theoretical models to estimate the birth mass of LPVs. This is done in paper II for four different metallicities from super–solar metallicity suitable for massive elliptical galaxies and stellar populations in the bulge of massive spiral galaxies such as the Milky Way to sub–solar values applicable the Large and Small Magellanic Clouds (Rezaeikh et al. 2014). As discussed in paper II, the central region of M 33 has approximately solar metallicity, so we could adopt Z=0.015. The outer regions of M 33 have lower metallicities than the center. Based on discussions in paper IV, it seems Z=0.008 agrees well with colour–magnitude diagrams (CMDs), so we adopt Z=0.008 for the disc and spiral arms of M 33. The star formation history is estimated by:
| (1) |
Where n′ is the number of variables that we have identified, is the initial mass function describing the relative contribution to star formation by stars of different mass and t is the duration of variability which these stars display strong radial pulsation.
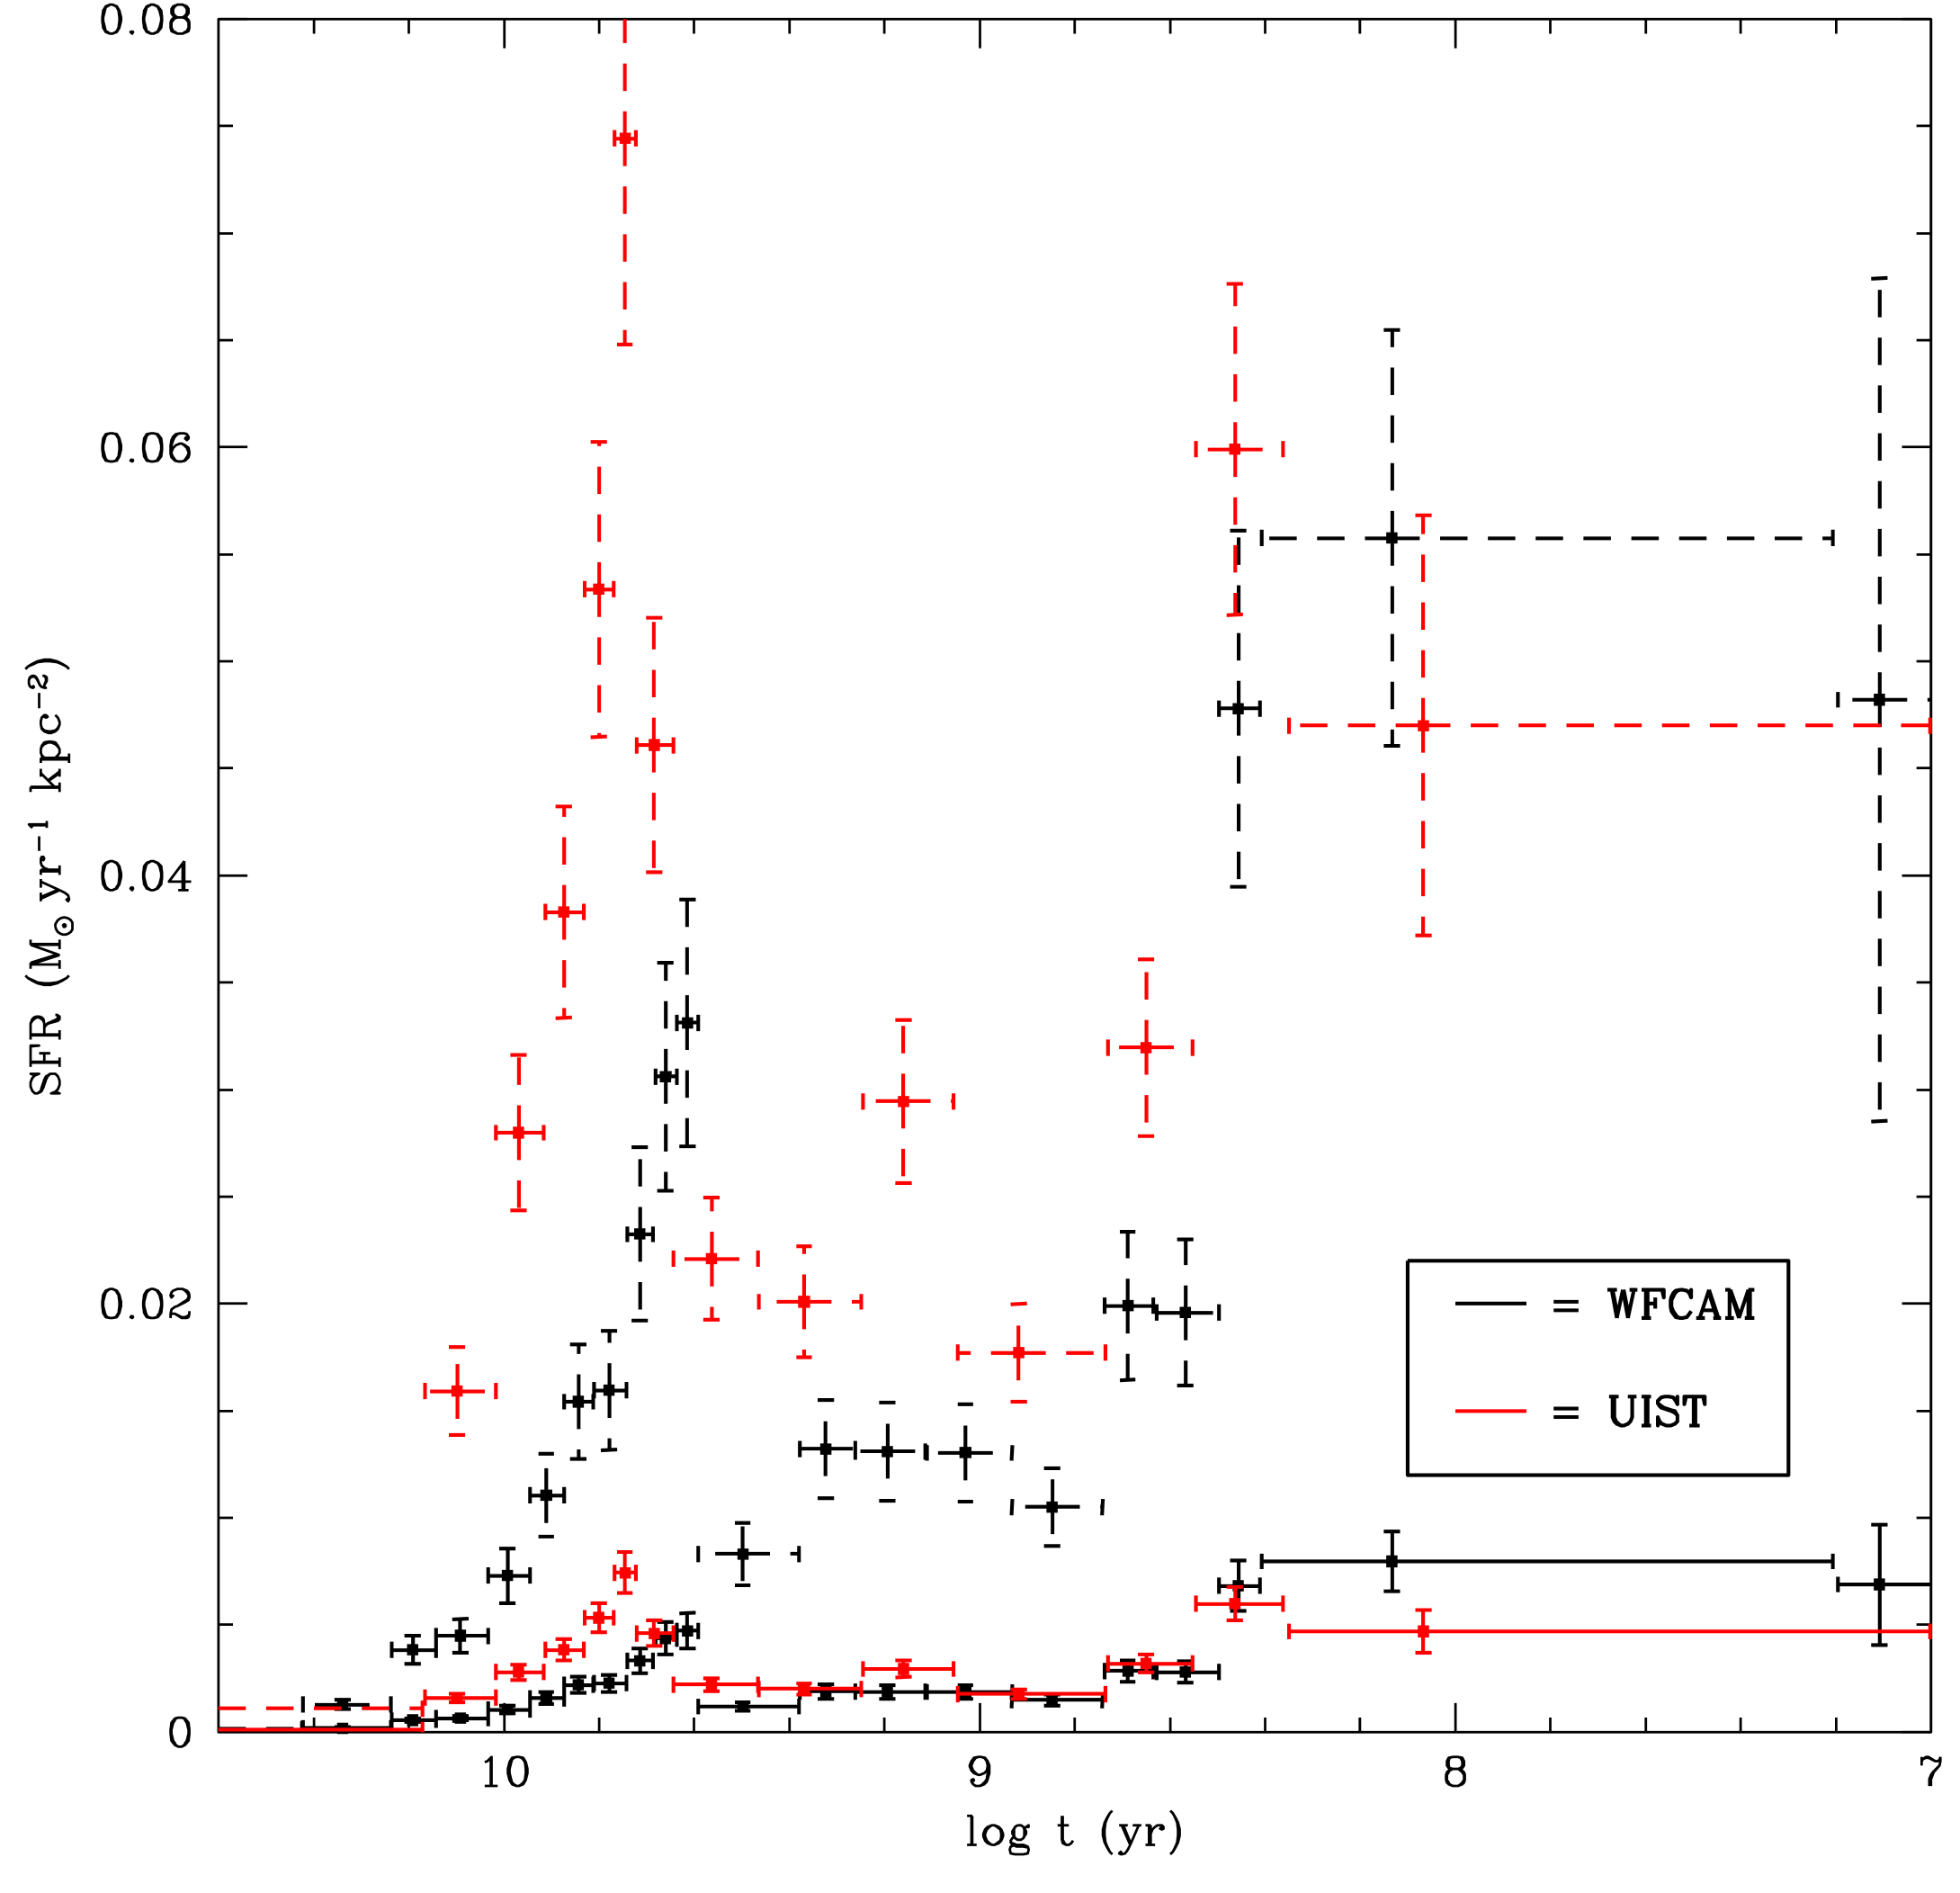
The SFH of the central square kpc of M 33 using WFCAM data is shown in Fig. 3, overlayed with red points by the SFH which was derived by using UIST data. Two main epochs of star formation are obvious; a major epoch of formation 4–5 Gyr ago (=9.6–9.7) peaking around 4 Gyr ago at a level about 2.5 times as high as during the subsequent couple of Gyr. A second epoch of star formation is seen to occur from 200 Myr–300 Myr ago (=8.3–8.5), with a rate around 1.5 times higher than the first peak at 4 Gyr ago. Since then the rate of star formation is decreasing.
The total area which is covered by WFCAM observations is almost 15 kpc 15 kpc, which covers the pseudo bulge, disc and spiral arms of the M 33 galaxy. The SFH across the disc of M 33 is shown in Fig. 4. Here again we see two epochs of enhanced star formation. The old epoch of star formation is seen at 3–6 Gyr ago (=9.5–9.8) peaking around 5 Gyr ago (=9.7) with a level almost 2 times as high as during the subsequent few Gyr. Barker et al. 2011 have shown that the outer disc of M 33 had a major epoch of star formation 2–4 Gyr ago, or at z 0.2–0.4. The peak at 4 Gyr ago resembles the peak that they have reported by using CMD fitting to the two fields in the outer disc of M 33 observed with the Hubble Space Telescope Advanced Camera. The recent epoch of enhanced star formation is occurring 200–300 Myr ago (=8.3–8.5), reaching a level of almost 4 times larger than the peak at the first epoch of star formation. This second peak is very strong compared with what we saw for the center of M 33.

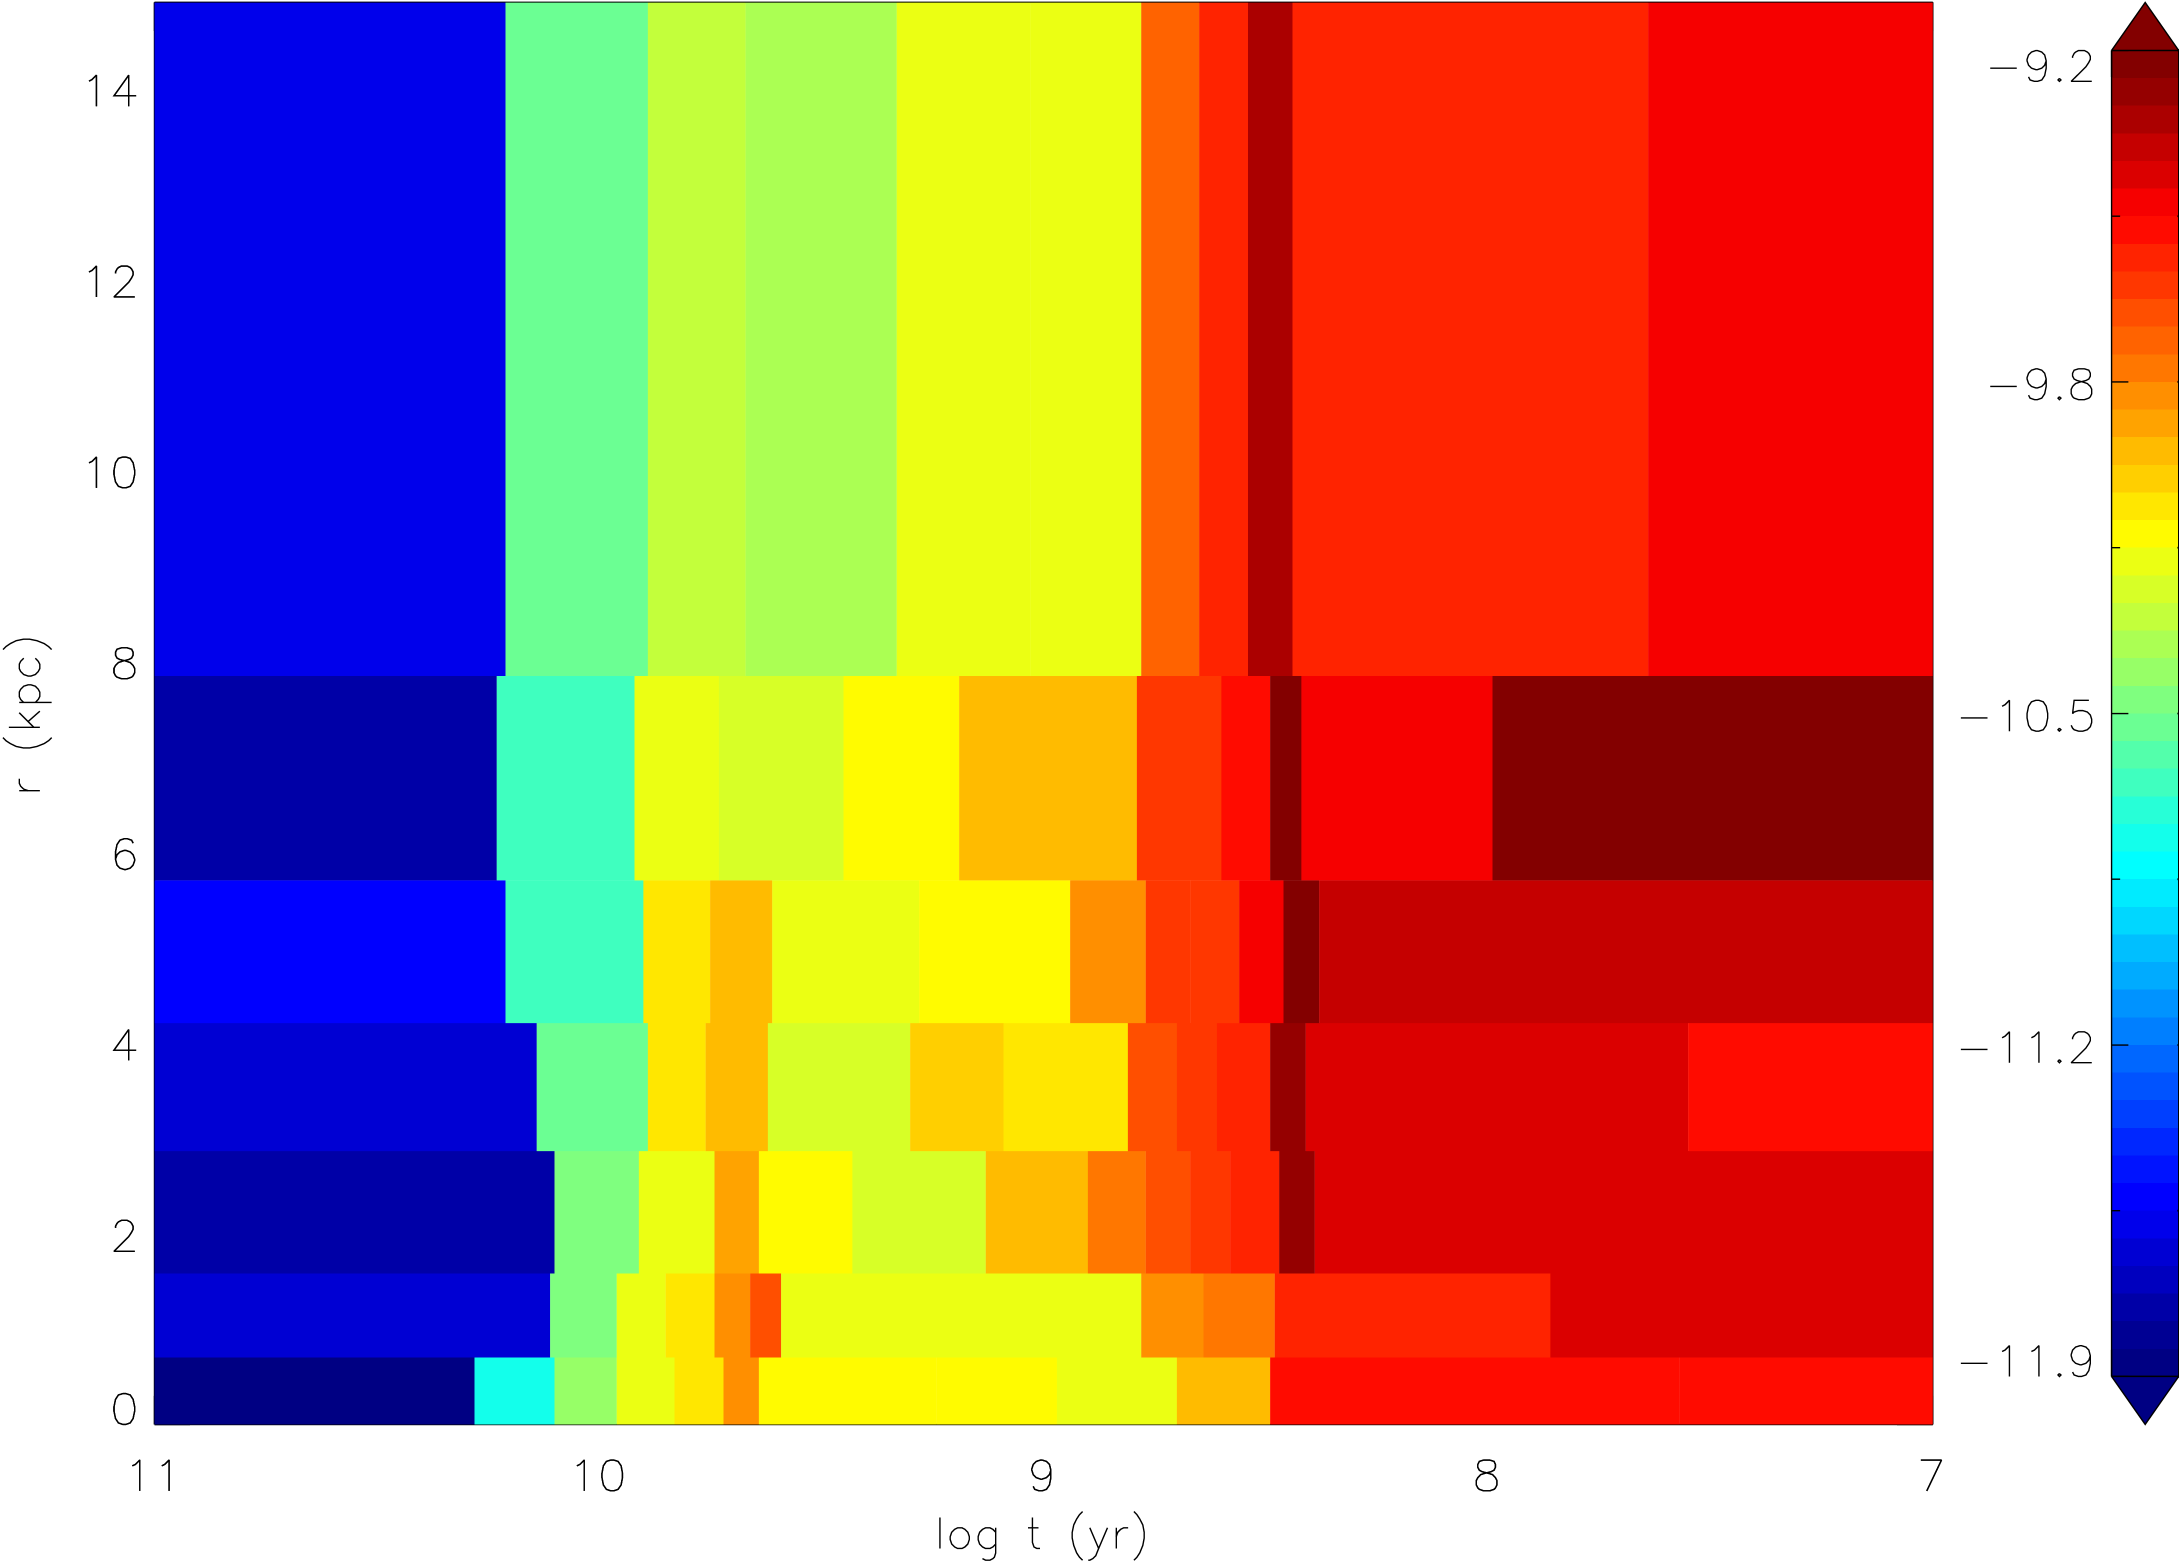
The star formation history variations versus distance from the center (r) is shown in Fig. 5. Each radius bin contains the same number of variable stars. This figure reveals two important results immediately; Firstly, the old epoch of star formation in M 33 is weakening and then disappears as we go further out from the center. The star formation starts and then gradually increases until t= 200 Myr (=8.3) and then decreases. Secondly, the very recent epoch of star formation is seen in all bins across the disc with same strength. It clearly shows the inside–out formation of M 33.
4 Mass Loss Rates in the Central Square Kiloparsec of M 33
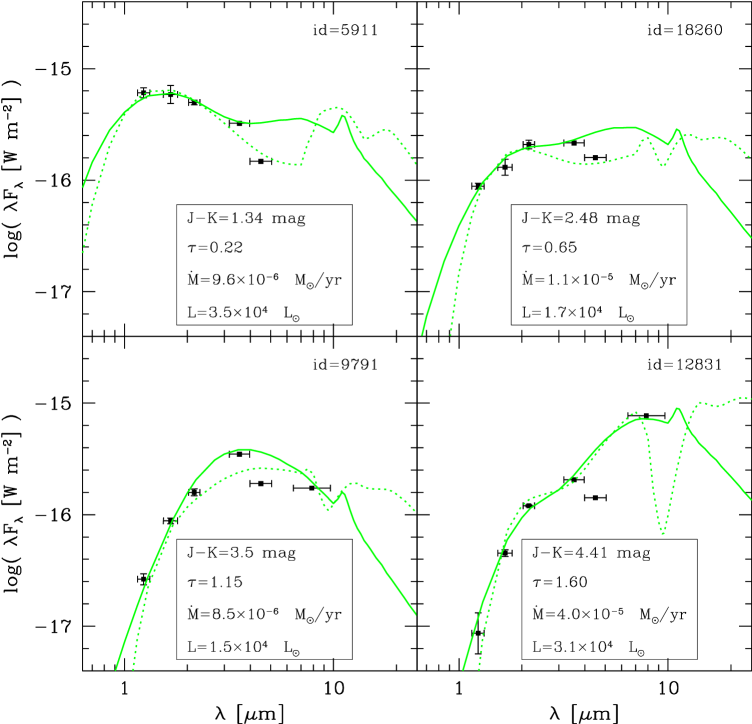
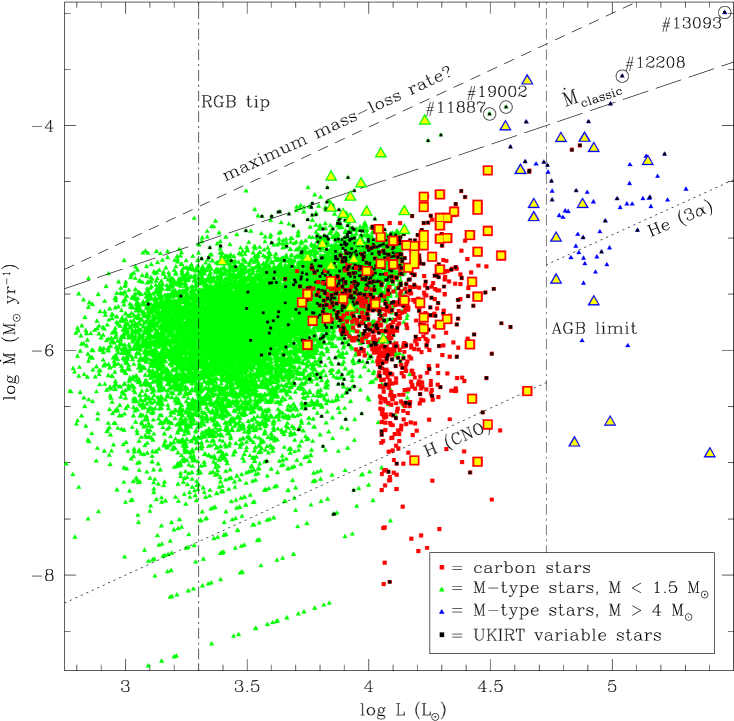
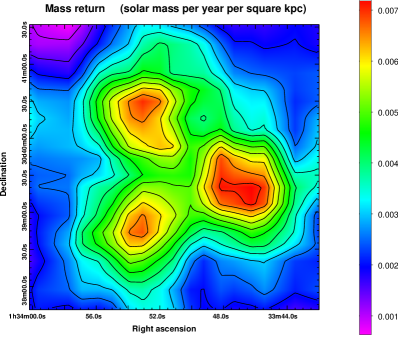
We derive the mass–loss rates of the red giant variables in two steps; First we model the spectral energy distribution (SED) of near– IR variables for which we have Spritzer Space Telescope mid–IR data (Fig. 6) and then we use these results to construct a relation between the dust optical depth and bolometric corrections on the one hand, and near–IR colours on the other. Then we apply those relations to the red giant variables for which no mid-IR counterpart was identified, to derive their mass-loss rates too (Fig. 7). The total mass return from UKIRT variables is almost 0.0055 M⊙ yr-1 and carbon grains make up 23 of the present–day dust–mass return so the interstellar dust is predominantly oxygen–rich. The full 2–D map of mass return is shown in Fig. 8.
The estimated ISM depletion timescale by Kang et al. (2012) is 0.3 Gyr. The mass return from evolved stars would not change the timescale by more than 17 . If we account for the mass return from supernovae, hot massive–star winds, luminous blue variable eruptions, et cetera, the mas return rate increases from 0.004–-0.005 M⊙ yr-1 kpc-2 to 0.006 M⊙ yr-1 kpc-2. Therefore, the above conclusion does not change. For sustaining star formation with the current rate gas must flow into the central regions of M 33, either through a viscous disc or via cooling flows from the circum–galactic medium.
In paper III we calculated the ratio of the mass lost during the pulsation phase to the birth mass and we realized that the pulsation duration is over–estimated by theoretical models. If the pulsation duration was over-estimated, then the star formation rate would have been under-estimated. Comparison of recent star formation rate derived from our method with the values derived by other methods shows that star formation rate should be corrected by the factor of 10 in the central regions and 7 for the disc. In Fig. 3 and Fig. 4 the correction factor of 10 for the center and 7 for the disc is applied to the star formation rates.
5 Conclusions
The photometric catalogues of Javadi et al. (2011) and Javadi et al. (2015) were used to reconstruct the star formation history across the galactic disc of M 33. The numbers and luminosities of the pulsating AGB stars and red supergiants were converted to star formation rate as a function of look-back time, using Padova stellar evolution models (Marigo et al. 2008). The pulsating red giant and supergiant stars were used to map the dust production in the central square kiloparsec of M 33.
We are currently working on WFCAM data to estimate the mass loss rates of evolved stars across the galactic disc of M 33 and to establish a link between the dust return and the formation of stars within the prominent spiral arm pattern.
Acknowledgements.
We acknowledge support from the ”Royal Society International Exchanges grant IE130487”. JvL acknowledges the award of a Santander Bank Research Bursary to attend this meeting.References
- Barker et al. (2011) Barker, M. K., et al. 2011, MNRAS, 410, 504
- Javadi, van Loon & Mirtorabi (2011a) Javadi, A., van Loon, J. Th., Mirtorabi, M. T. 2011a, MNRAS, 411, 263 (Paper I)
- Javadi, van Loon & Mirtorabi (2011b) Javadi, A., van Loon, J. Th., Mirtorabi, M. T. 2011b, MNRAS, 414, 3394 (Paper II)
- Javadi et al. (2013) Javadi, A., et al. 2013, MNRAS, 432, 2824 (Paper III)
- Javadi et al. (2014) Javadi, A., et al. 2015, MNRAS , 447, 3973 (Paper IV)
- Kang et al. (2012) Kang, X., et al. 2012, MNRAS, 426, 1455
- Marigo et al. (2008) Marigo, P., et al. 2008, A&A, 482, 883
- Rezaei et al. (2014) Rezaeikh, S., et al. 2014, MNRAS, 445, 2214
- Whitelock, Feast & Catchpole (1991) Whitelock, P., Feast, M., Catchpole, R. 1991, MNRAS, 248, 276