Probing the nature of phases across the phase transition at finite isospin chemical potential ††thanks: Presented by Rajiv V. Gavai at Critical Point and Onset of Deconfinement CPOD2016, Wrocław, Poland
Abstract
We compare the low eigenvalue spectra of the Overlap Dirac operator on two sets of configurations at = 0.5 and 1.5 generated with dynamical staggered fermions at these isospin chemical potential on lattices. We find very small changes in the number of zero modes and low lying modes which is in stark contrast with those across the corresponding finite temperature phases where one sees a drop across the phase transition. Possible consequences are discussed.
12.38.Gc, 11.35.Ha, 05.70.Jk
1 Introduction
The baryon density-temperature (-) phase diagram of quantum chromodynamics (QCD) has received a lot of attention for the past few decades, starting from skeleton diagrams on the basis of simple hadronic models, which explain the hadron spectrum reasonably well, to the increasingly quantitative attempts to pin it down ab initio from QCD itself using the non-perturbative lattice approach. As is well-known, one has to face the famous fermion sign(phase) problem at nonzero baryon density or equivalently nonzero baryon chemical potential, , adding an extra layer of uncertainty to the results obtained. In addition to baryon number, the up and down quarks also carry isospin. Defining as the chemical potential for , and , for the up and down quarks, one has and or alternatively, and . The fermion determinant is real [1, 2] for and , and one thus has no sign problem in that case. From a theoretical point of view the ability to simulate the theory enables tests of many conceptual issues related to confinement and chiral symmetry breaking in the entire - phase diagram, as we set out to show below.
Staggered fermions are often used for such investigations due to their remnant chiral symmetry. Kogut-Sinclair [2] introduced the corresponding fermion action to investigate also whether the isospin symmetry is spontaneously broken:
| (1) |
Here are two component flavour spinors, are the flavour generators, is the ‘’ for staggered fermions, and are isospin chemical potential and quark mass respectively and is a pionic source that is sent to zero at the end of the analysis. Ref. [2] worked out the symmetry-breaking patterns and the corresponding observables which signal them. Further, it was argued that the fermion determinant is positive definite, enabling simulations.
Employing staggered fermions on lattices with fm at a lattice quark mass , corresponding to 260 MeV, Endrődi [3] recently investigated the phase structure. As can be seen from his results in Figure 1 on the chiral condensate, the pion condensate, the isospin density and the Polyakov line, obtained from the partition function defined by above and the Wilson gluonic action by using, , , , suggest a in the limit.
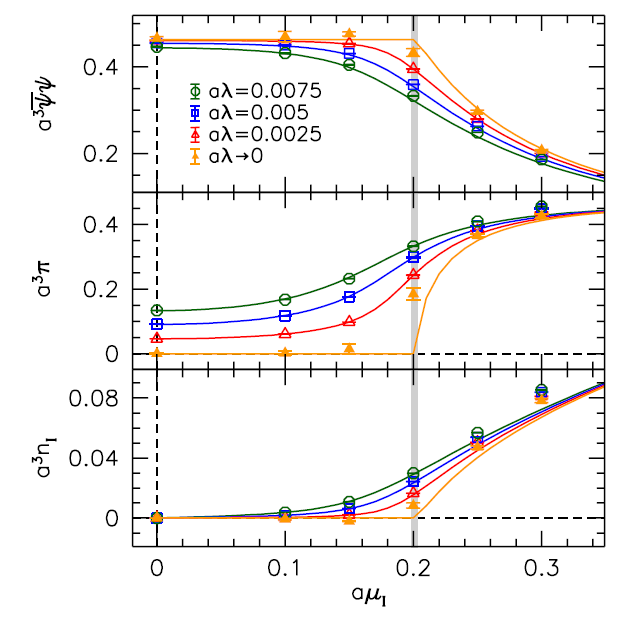
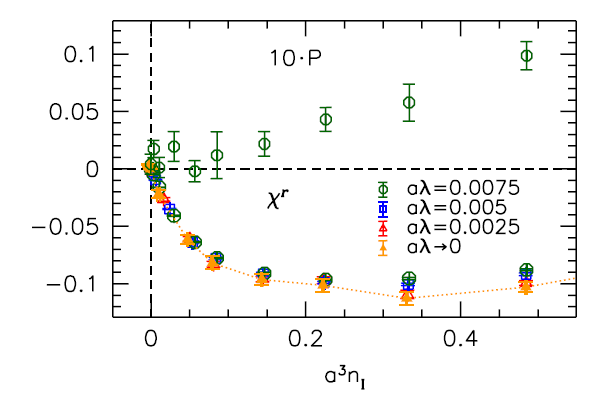
A linear extrapolation of the data for the three values indicated is displayed by points whereas the corresponding line is a chiral theory fit. The grey vertical band denotes the value of in the lattice units. The chiral condensate drops rapidly around , where the pion condensate and isospin density also become nonzero as does the Polyakov loop displayed in the upper half of the right panel. These results shows deconfinement to occur as well with the chiral symmetry restoration at the transition point, . The similarity of this phenomenon with the finite temperature transition, i.e, , prompts further investigation of the nature of this transition in terms the established ideas, such as topological excitations, or phenomenological models, such the well-known Instanton-liquid model [4] built on Instanton-fermion couplings.
Lattice QCD simulations support for the model was observed in the peak of the Instanton-distribution at a radius fm [5]. Note that Overlap Dirac operator, which has exact chiral symmetry on the lattice as well as an index theorem, was used for this analysis, by studying its low eigenmodes spectrum. Such studies were also carried out for the high temperature phase. Number of low eigenmodes were found to get depleted as increased away from [6, 7]. Furthermore a gap appeared to separate the low modes from others. Localized zero modes were observed [7] for 1.25 2, suggesting the axial symmetry group to be restored only gradually up to 2. Indeed, the scalar& pseudoscalar meson correlators were equal, as expected in a chiral symmetry restored phase, only after the contribution of these zero modes was subtracted out from the former. Clearly, a similar investigation will be interesting for the nonzero chemical potential case as well, in view of the both the naıve model expectations and the results in Figure 1 for .
2 Our Results
Employing dynamical configurations on lattices, generated with a Symanzik improved action with 2 stout steps and for a quark mass tuned to have the physical pion mass, we investigated the the eigenvalue spectra of the Overlap Dirac operator both below and above the isospin breaking phase transition at , which again corresponds to being . We employed the Arnoldi method to extract the eigenvalues of Overlap Dirac operator, demanding a residue . It may be noted that the dynamical configurations are with a nonzero and 0.15, but there is no explicit in the operator itself, since our intention is to study the topological fluctuations. We extracted 500 eigenvalues from each configuration. At both the values computations were done for two different values of — the isospin breaking parameter in the quark matrix.
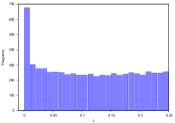
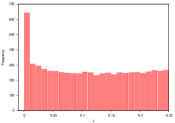
Since the eigenvalue is complex for , we display in Figure 2 the -distributions for both below and above the transition. Fairly uniform distribution with some low modes are seen in both the cases. Surprisingly the distributions are very similar as well, and by overlaying them one finds them almost indistinguishable with minor quantitative differences. Re-plotting them on a log scale, one can easily identify the zero modes from the gap in the spectrum. Explicit chirality checks were made to confirm their nature. Zooming in on the eigenvalue
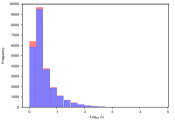
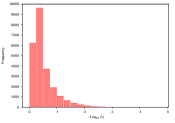
distribution on the log scale one can see if the near-zero modes have any visible differences. While a nice smooth rise is seen in Figure 3, as one moves away from the zero eigenvalue, the similarity in the distributions for and 1.5 persists for even higher =0.0025, where one observes qualitatively the same picture as discussed above. The displayed overlay of near-zero modes for and 1.5 for in the left panel also compares well with that of , in the right panel.
The exact chiral symmetry of the overlap fermions implies that nonzero modes are doubly degenerate with opposite chirality while the zero modes possess only a specific chirality. The latter act as a measure of topology due to the index theorem the overlap fermions satisfy. Table 1 list the number of zero modes we observed in a sample of 50 independent gauge configurations as a function of and . The last two columns list the corresponding results of Ref. [7] which are also on samples of 50 configurations but as a function of temperature in the vicinity of the finite temperature transition at . While a steep fall of is seen in the latter as a function of , almost no variation is observed across for and a mild one for , 25% reduction.
| 0.5 | 426 | 416 | 1.25 | 18 |
| 1.5 | 451 | 310 | 1.5 | 8 |
| - | - | - | 2.0 | 1 |
3 Summary
We investigated the eigenvalue distribution for chirally exact Overlap Dirac operator for 0.5 & 1.5, i. e., below and above the isospin phase transition, which is indicated [3] to be similar to the finite temperature transition in having both chiral symmetry restoration and a rise of the Polyakov loop at the transition point. The distribution of zero and near-zero modes is nearly the same for both at =0.0006, with a 25 % reduction in former at =0.0025.
This should be contrasted with the earlier results [6, 7], where too these modes were present above the transition but decreased sharply as one moved away from the transition. Further quantitative investigations in pinning down the changes in these modes may help in efforts to understand the difference in and directions, if any.
4 Acknowledgements
This work was supported by the Alexander von Humboldt foundation under its Institutspartnerschaft Regensburg–Mumbai project. We gratefully acknowledge its financial support. Two (RVG & NM) of us thank ILGTI, TIFR, Mumbai for its support and G. Endrődi acknowledges support from the DFG (Emmy Noether Programme EN 1064/2-1).
References
- [1] D. T. Son and M. A. Stephanov, Phys. Rev. Lett. 86 (2001) 592 [hep-ph/0005225].
- [2] J. B. Kogut and D. K. Sinclair, Phys. Rev. D 66 (2002) 034505 [hep-lat/0202028].
- [3] G. Endrődi, Phys. Rev. D 90 (2014) 094501 [arXiv:1407.1216].
- [4] T. Schäfer and E. V. Shuryak, Rev. Mod. Phys. 70 (1998) 323 [hep-ph/9610451]; D. Diakonov, Proc. Int. Sch. Phys. Fermi 130 (1996) 397 [hep-ph/9602375].
- [5] T. A. DeGrand and A. Hasenfratz, Phys. Rev. D 64 (2001) 034512 [hep-lat/0012021].
- [6] R. G. Edwards, U. M. Heller, J. E. Kiskis and R. Narayanan, Nucl. Phys. Proc. Suppl. 83 (2000) 479 [hep-lat/9908036].
- [7] R. V. Gavai, S. Gupta and R. Lacaze, Phys. Rev. D 65 (2002) 094504 [hep-lat/0107022].