Intra-chain organisation of hydrophobic residues controls inter-chain aggregation rates of amphiphilic polymers
Abstract
Aggregation of amphiphiles through the action of hydrophobic interactions is a common feature in soft condensed matter systems and is of particular importance in the context of biophysics as it underlies both the generation of functional biological machinery as well as the formation of pathological misassembled states of proteins. Here we explore the aggregation behaviour of amphiphilic polymers using lattice Monte-Carlo calculations and show that the distribution of hydrophobic residues within the polymer sequence determines the facility with which dry/wet interfaces can be created and that such interfaces drive the aggregation process.
Due to their importance in governing self-assembly of biological components, hydrophobic interactions and the mechanism of hydrophobic collapse leading to the aggregation of hydrophobic species in an aqueous environment have been studied in detail using approaches ranging from spectroscopy to atomistic and coarse-grained simulations wallqvist1995computer ; lum1999hydrophobicity ; huang2001scaling ; raschke2001quantification ; huang2002hydrophobic ; dixit2002molecular ; chandler2005interfaces ; granick2008chemistry ; rasaiah2008water ; WillardChandler2008 ; berne2009dewetting ; patel2010fluctuations ; hummer2010molecular ; garde2011unraveling ; patel2012sitting ; ben2015hydrophobic . The phenomenon of hydrophobic collapse by its very nature involves the removal of water molecules between adjacent hydrophobic entities in order to allow for them to come together, and therefore the creation of an interface with unsatisfied hydrogen-bonding separating ”wet” solvent from ”dry” aggregated hydrophobes in a manner reminiscent of a liquid-vapour phase transition. The picture that has emerged from computational studies of the collapse of hydrophobic chains is that it is the creation of such interfaces which controls the transition between solvated hydrophobes and their compact aggregated state tenWoldeChandler2002 ; miller2007solvent ; jamadagni2008interfaces . In biological systems, hydrophobic units rarely occur in isolation and are most commonly part of a macromolecular system. In the present work, we investigate using lattice Monte-Carlo calculations the nature of the hydrophobic collapse for polymers with a varying distribution of hydrophobic and hydrophilic elements and demonstrate that the clustering of hydrophobic entities is crucial for nucleating the formation of dry interfaces driving the eventual aggregation process.
I Off-lattice solutes in a lattice gas solvent model
Hydrophobic assembly is characterised by the expulsion of water molecules from aggregates of hydrophobic entities. This effect can be captured by considering the evolution of the local water density field. The short length scale density fluctuations contributing to the local density are characterised by rapid relaxation and follow to a very good approximation Gaussian statistics hummer1996information . These short scale fluctuations can therefore be integrated analytically chandler1993gaussian ; tenWoldeChandler2002 ; varilly2011improved , resulting in a coarse grained density field which is readily simulated with a discretized binary field which tracks the density fluctuations resulting in the appearance of cells with a lower density, ”vapour” cells , and ”wet” cells within the bulk solvent with . This description is particularly well suited for numerical evaluation as the computationally costly short length scale fluctuations characteristic of atomistic models have been treated analytically. Within this picture, there is a cost to create a wet/dry interface, given by nearest neighbour interactions of the form and an energy associated with the solvation of chemical species . This description is therefore equivalent to a 3D lattice gas system with the Hamiltonian:
| (1) |
where is the solvent chemical potential and indicates summation over nearest neighbours on the lattice. The presence of hydrophobic solutes at lattice sites with results in an excess chemical potential .
The values of the parameters governing the coarse grained water degrees of freedom, and , can be determined for a lattice size of nm through comparisons with the experimental bulk values for the isothermal compressibility and the surface tension of water at room temperature and 1 atm pressure. The value of represents the chemical potential of the solvent at phase coexistence with the vapour phase, and the small difference highlights the fact that water is close to phase coexistence under standard conditions. It has been shown that this description of water reproduces faithfully the key properties associated with hydrophobic interactions, in particular the characteristic solvation free energy changes with increasing solute sizes. This coarse-grained water description has previously been used to study the collapse of a single hydrophobic chain tenWoldeChandler2002 , and we extend this approach here to cover the aggregation of amphiphilic chains.
With the specific parameterization given above, the lattice solvent used here is below the roughening transition for the three-dimensional Ising model. As a result, there can be lattice artifacts due to a tendency of an interface to align with the orientation of the underlying lattice vectors Weeks1977 . A true liquid-vapor interface would not exhibit this behavior. Vaikuntanathan and Geissler have recently demonstrated that this tendency can give rise to inaccurate solvation free energies for hydrophobic solutes that are nanometer sized or larger Vaikuntanathan2014 . This inaccuracy is most significant for aspherical or irregularly shaped solutes, but grows less pronounced as the roughening transition is approached from below. In the case presented here the model is only slightly below the roughening transition, which is located at , and so lattice artifacts are only expected to manifest on length scales of about . Since the critical nucleus size for hydrophobic peptide aggregation is about 1nm, or , we expect any lattice artifacts associated with being below the roughening transition to be negligible for the results presented here. Indeed, the mechanism for collapse found for a hydrophobic chain with the lattice solvent model we employtenWoldeChandler2002 is consistent with that found for same hydrophobic chain with an atomistic solvent model.miller2007solvent For more generally shaped solutes, effects of lattice artifacts may best be avoided by adopting Vaikuntanathan and Geissler’s related lattice model, Vaikuntanathan2014 ; Vaikuntanathan2016 which is slightly more complicated than that of Ref. (tenWoldeChandler2002, ).
For the hydrophobic segments, the excess chemical potential is given by , where is taken to be the reversible work required to accommodate a hydrophobe of volume . Idealised hydrophilic segments are water like and as such the excess chemical potential due to the presence of hydrophobic solutes vanishes . Furthermore, weak depletion forces act between two hydrophobic particles and originate from the reduction of volume from which the solute excludes solvent molecules.
The solvent degrees of freedom in the model, , can be efficiently sampled using a Metropolis Monte Carlo algorithm. By contrast, sampling the solute degrees of freedom is more complex. The principal problem is to calculate the overlap volume between the excluded volume and a given fine cell . The volume is typically a union of overlapping spheres, one for each excluded volume associated with a solute particle, here a polymer segment. Previously in Refs. (tenWoldeChandler2002, ) and (WillardChandler2008, ), an interpolation scheme was used that only works if no point in space is within the solvent-excluding radius of more than two spheres simultaneously, and a solute geometry was chosen that avoids this situation. In the present paper we focus on aggregation of multiple chains where densely packed structures are expected and thus multiple overlaps will occur – thus the existing interpolation scheme is not suitable.
Here, we discuss a partial solution to the above problem. Specifically, we present an approximate method of calculating when is, as above, a union of possibly overlapping spheres of a few different sizes. The gradient of with respect to the centers of these spheres is also easy to calculate. In principle, propagating these gradients to obtain gradients of is then simply a (non-trivial) bookkeeping exercise. In describing our scheme, we treat cell indices as vectors that can be added and subtracted. We denote by the coordinates of the corner of cell with lowest Cartesian components. For a solvent-excluding sphere of radius centered at , we can pre-calculate the overlap volumes of all cells by any method, such as Monte Carlo integration. We do this once at the beginning of a simulation.
Generically, the center of a solvent-excluding sphere will not coincide with a cell corner. We denote the indices of the eight corners of the cell containing by , and their positions by . We construct eight non-negative weights , the sum of which is and whose value depends continuously on , such that . Any scheme with these characteristics, such as trilinear interpolation, can be used. The overlap volumes for cells near are then estimated by
| (2) |
This interpolation scheme has the desirable property that the total volume of a sphere, given by , is independent of .
When a solute is composed of multiple spheres, centered at , we simply add together the overlap volumes given by Equation (2) for each solute, but we cap the sum at the total volume of each fine cell, . In summary, we have
| (3) |
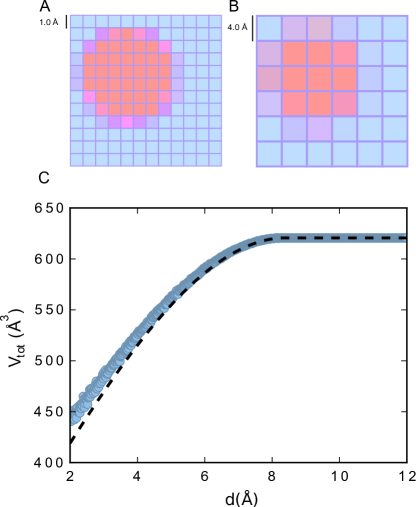
This scheme is exact whenever one or more spheres overlaps cell completely, as well as when two spheres both overlap cell but not each other. When two or more spheres both partially overlap cell and each other, our scheme mildly overestimates the overlap volume. We have evaluated the precision of our scheme by calculating the total volume of two spheres of radius whose position is varied, and the two spheres are placed at arbitrary positions with respect to the fine grid. The total volume can be calculated analytically when the two sphere centers are a distance apart,
| (4) |
The results of this comparison are shown in Figure 1C when Å and the fine grid resolution is Å. As expected, the exact and numerical results agree closely. Of equal importance, the spread in the numerical estimate of the total volume is small, which suggests that the lattice artifacts of our overlap-volume scheme are quite modest while offering a robust and computationally advantageous solution to the problem of computing overlap integrals for off-lattice solutes.
We note that if the solute needed to be propagated through some variant of molecular dynamics, such as Langevin dynamics tenWoldeChandler2002 , the gradient of with respect to solute positions would also be needed, and this is easy to calculate to the present approximation scheme.
II Results
The framework presented in this paper allows the study of solutes that can move freely in space in combination with an effective and computationally tractable explicit solvent model that exploits the statistical mechanics of lattice gas models. Using this approach, we have probed the aggregation behaviour of amphiphilic polymers with differing sequences of hydrophilic and hydrophobic residues. We model the dimensions of our chains on that of polypeptide chains; the excluded volume of the residues with a core volume , is chosen to match that determined experimentally for amino acids levitt1976simplified . Furthermore, the excess chemical potentials of solvation possess values which cover the range measured for hydrophilic and hydrophobic amino acidsRoseman1988 . The polymer is modeled as a Gaussian chain, and the simulation box with periodic boundary conditions has a volume of 216.0 . We used a polymer mass concentration of 79.6 mg/ml, a value comparable to the total protein concentration in many organisms.
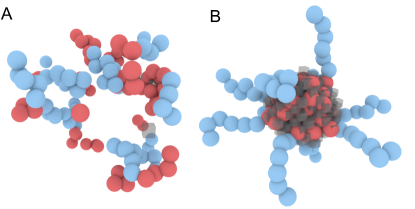
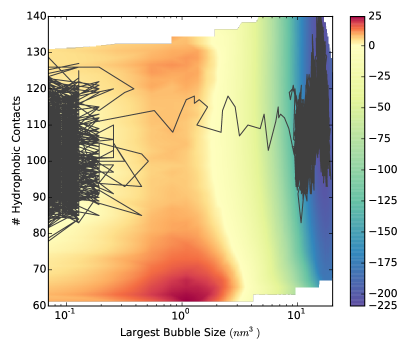
First, a solution of polymer chains composed of six hydrophobic residues followed by six hydrophilic residues spontaneously aggregates during unbiased simulations to form a cluster as shown in Fig. 2 where the hydrophobic sections form a dry core and the hydrophilic segments are solvated on the outside of this core. We follow the mechanism of aggregation of the chains by focusing on two coordinates: a solvent coordinate measuring the size of largest bubble of vapour sites, and a polymer coordinate which describes the number of hydrophobic residues that are in contact, defined as their centres lying within a distance less than , where is the residue radius. In this manner we have a reporter for both the changes in the conformations of the polymer chains as well as on the behaviour of the solvent. Unbiased trajectories show that during the aggregation process initially rapid fluctuations in the number of hydrophobic contacts are observed; this process in itself does not, however, lead to aggregation of the chains since any contacts formed are able to dissociate readily during the simulation. However, the system may undergo a critical fluctuation in the water coordinate leading to the drying of a hydrophobic contact. This fluctuation then drives the complete aggregation as other residues are subsequently recruited into this hydrophobic core. This mechanism is analogous to that observed for the formation of intra-molecular contacts in purely hydrophobic chains studied previously tenWoldeChandler2002 .
The importance of fluctuations in the solvent degrees of freedom, which allow hydrophobic contacts to be stabilised, raises the question of how the ease of generating such fluctuations depends on the sequence in which hydrophobic and hydrophilic residues are distributed within the polymer chain. This question is also motivated by the empirical observation that there is evidence from studies of protein sequences that significant evolutionary pressures govern the distributions of hydrophilic and hydrophobic residues in order to avoid unwanted aggregation DuBay2004a , in addition to the more conventional role of sequence in determining the final fold of the chain Anfinsen1973 .
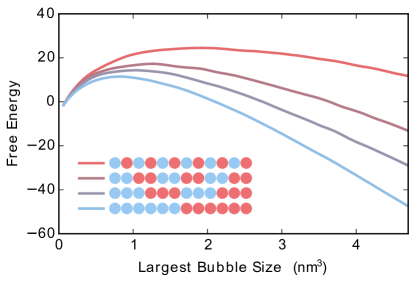
We investigated this question by generating different sequences of polymers which all share the same average composition of 50% hydrophilic residues and 50% hydrophobic residues. The evaluation of the free energy barriers in Fig. 4 against aggregation reveals that the sequence of the polymer, even for a constant average composition, has a major role in determining its propensity to aggregate. The free energy barriers are significantly larger for polymers which have only small hydrophobic clusters and where the residues are evenly distributed throughout the chain. By contrast, for polypeptide chains where the hydrophobic residues are segregated to one end of the chain, we observe a significantly reduced barrier and increased propensity to aggregate. The entropic penalty of bringing together a critical number of hydrophobic residues, that are required to observe a drying transition leading a stable hydrophobic contact, is significantly greater when these residues are not at adjacent positions in the chain but distributed throughout the sequence. In this manner, the interplay between polymer degrees of freedom and solvent degrees of freedom generates a very significant and sensitive dependency of the aggregation potential of the chain on the precise placement of the hydrophobic residues.
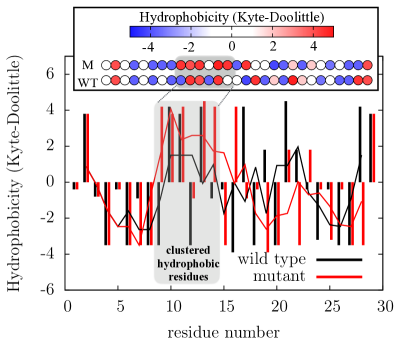
Interestingly, experiments designed to probe the aggregation propensity of sequence scrambled variants of the first 29 residues of horse heart apomyoglobin have been reportedMonsellier2007a . This system consists of a short peptide where the amino acid composition has been kept constant, but several mutants were generated where the position of the amino acids within the sequence was varied. It was observed that such mutants possessed markedly different aggregation propensities despite their common amino acid composition, with aggregation prone clusters of hydrophobic residues being particularly associated with a high propensity to aggregate. To facilitate a quantitative comparison between these different peptides we map their sequences onto a quantitative measure of hydrophobicity. The Kyte-Doolittle scaleKyte1982 is one such measure that associates a scalar hydrophobicity score with each amino acid. If we consider the local Kyte-Doolittle hydrophobicityKyte1982 of the most aggregation prone mutant reported in the study relative to the aggregation resistant wild type, as shown in Fig. 5, a marked difference in the distribution pattern of the hydrophobic residues is apparent, with the aggregation-prone mutant possessing a cluster of hydrophobic residues which are distributed more evenly throughout the sequence for the wild type. This type of observation is in close agreement with the importance of clusters of hydrophobic residues determined from simulations in the present work.
III Conclusions
In this paper we have developed and described an approach to use off-lattice solutes within a statistical mechanical model of lattice solvents. Our system is computationally tractable, yet includes the relevant solvent degrees of freedom. We have used this system to probe the role of the distribution within the sequence of amphiphilic polymers of the positions of hydrophobes. Our simulations show that highly aggregation prone chains result when the hydrophobes are not distributed evenly within the chain but cluster in close proximity along the chain. This clustering favours the nucleation of a dry hydrophobic core when two or more such chains come together, leading to an inter-molecular hydrophobic collapse stabilising the aggregated state.
Acknowledgements.
We thank the BBSRC, the Frances and Augustus Newman Foundation and the Wellcome Trust (TPJK) for financial support and Daan Frenkel and Suriyanarayanan Vaikuntanathan for helpful discussions. We are indebted to Michele Vendruscolo for bringing to our attention the data in Fig. 5. DC has been supported in part by Director, Office of Science, Office of Basic Energy Sciences, and by the Division of Chemical Sciences, Geosciences, and Biosciences of the U.S. Department of Energy at LBNL under Contract No. DE-AC02-05CH11231References
- (1) Wallqvist, A.; Berne, B. J. Chem.Phys. 1995, 99(9), 2893–2899.
- (2) Lum, K.; Chandler, D.; Weeks, J. D. J. Phys.Chem. B 1999, 103(22), 4570–4577.
- (3) Huang, D. M.; Geissler, P. L.; Chandler, D. J. Phys.Chem. B 2001, 105(28), 6704–6709.
- (4) Raschke, T. M.; Tsai, J.; Levitt, M. Proc. Natl. Acad. Sci 2001, 98(11), 5965–5969.
- (5) Huang, D. M.; Chandler, D. J. Phys. Chem. B 2002, 106(8), 2047–2053.
- (6) Dixit, S.; Crain, J.; Poon, W.; Finney, J.; Soper, A. Nature 2002, 416(6883), 829–832.
- (7) Chandler, D. Nature 2005, 437(7059), 640–647.
- (8) Granick, S.; Bae, S. C. Science (New York, NY) 2008, 322(5907), 1477–1478.
- (9) Rasaiah, J. C.; Garde, S.; Hummer, G. Annu. Rev. Phys. Chem. 2008, 59, 713–740.
- (10) Willard, A. P.; Chandler, D. J. Phys.Chem. B 2008, 112(19), 6187–6192.
- (11) Berne, B. J.; Weeks, J. D.; Zhou, R. Annu. Rev. Phys. Chem. 2009, 60, 85.
- (12) Patel, A. J.; Varilly, P.; Chandler, D. J. Phys.Chem. B 2010, 114(4), 1632–1637.
- (13) Hummer, G. Nature chemistry 2010, 2(11), 906–907.
- (14) Garde, S.; Patel, A. J. Proc. Natl. Acad. Sci 2011, 108(40), 16491–16492.
- (15) Patel, A. J.; Varilly, P.; Jamadagni, S. N.; Hagan, M. F.; Chandler, D.; Garde, S. J. Phys.Chem. B 2012, 116(8), 2498–2503.
- (16) Ben-Amotz, D. J. Phys. Chem. Lett 2015.
- (17) ten Wolde, P. R.; Chandler, D. Proc. Natl. Acad. Sci 2002, 99(10), 6539–6543.
- (18) Miller, T. F.; Vanden-Eijnden, E.; Chandler, D. Proc. Natl. Acad. Sci 2007, 104(37), 14559–14564.
- (19) Jamadagni, S. N.; Godawat, R.; Dordick, J. S.; Garde, S. J. Phys.Chem. B 2008, 113(13), 4093–4101.
- (20) Hummer, G.; Garde, S.; Garcia, A. E.; Pohorille, A.; Pratt, L. R. Proc. Natl. Acad. Sci 1996, 93(17), 8951–8955.
- (21) Chandler, D. Phys. Rev. E 1993, 48(4), 2898.
- (22) Varilly, P.; Patel, A. J.; Chandler, D. J. Chem. Phys. 2011, 134(7), 074109.
- (23) Weeks, J. D. J. Chem. Phys 1977, 67, 3106.
- (24) Vaikuntanathan, S.; Geissler, P. L. Phys. Rev. Lett. 2014, 112(2), 020603.
- (25) Vaikuntanathan, S.; Rotskoff, G.; Hudson, A.; Geissler, P. L. Proc. Natl. Acad. Sci 2016, 113(16), E2224–E2230.
- (26) Levitt, M. J. Mol. Biol. 1976, 104(1), 59–107.
- (27) Roseman, M. A. J. Mol. Biol 1988, 201(3), 621–623.
- (28) Monsellier, E.; Ramazzotti, M.; de Laureto, P. P.; Tartaglia, G.-G.; Taddei, N.; Fontana, A.; Vendruscolo, M.; Chiti, F. Biophys. J. 2007, 93(12), 4382 – 4391.
- (29) DuBay, K. F.; Pawar, A. P.; Chiti, F.; Zurdo, J.; Dobson, C. M.; Vendruscolo, M. J. Mol. Biol 2004, 341(5), 1317–1326.
- (30) Anfinsen, C. B. Science 1973, 181(96), 223–230.
- (31) Kyte, J.; Doolittle, R. F. J. Mol. Biol 1982, 157(1), 105–132.