Ice Formation on Kaolinite: Insights from Molecular Dynamics Simulations
Abstract
The formation of ice affects many aspects of our everyday life as well as important technologies such as cryotherapy and cryopreservation. Foreign substances almost always aid water freezing through heterogeneous ice nucleation, but the molecular details of this process remain largely unknown. In fact, insight into the microscopic mechanism of ice formation on different substrates is difficult to obtain even if state-of-the-art experimental techniques are used. At the same time, atomistic simulations of heterogeneous ice nucleation frequently face extraordinary challenges due to the complexity of the water-substrate interaction and the long timescales that characterize nucleation events. Here, we have investigated several aspects of molecular dynamics simulations of heterogeneous ice nucleation considering as a prototypical ice nucleating material the clay mineral kaolinite, which is of relevance in atmospheric science. We show via seeded molecular dynamics simulations that ice nucleation on the hydroxylated (001) face of kaolinite proceeds exclusively via the formation of the hexagonal ice polytype. The critical nucleus size is two times smaller than that obtained for homogeneous nucleation at the same supercooling. Previous findings suggested that the flexibility of the kaolinite surface can alter the time scale for ice nucleation within molecular dynamics simulations. However, we here demonstrate that equally flexible (or non flexible) kaolinite surfaces can lead to very different outcomes in terms of ice formation, according to whether or not the surface relaxation of the clay is taken into account. We show that very small structural changes upon relaxation dramatically alter the ability of kaolinite to provide a template for the formation of a hexagonal overlayer of water molecules at the water-kaolinite interface, and that this relaxation therefore determines the nucleation ability of this mineral.
I Introduction
From the immense extent of glaciers to the microscopic length scale of living cells, ice shapes life as we know it Bartels-Rausch (2013). For instance, the formation of clouds Tang, Cziczo, and Grassian (2016) and the weathering of rocks Bartels-Rausch et al. (2012) originate from water freezing in the atmosphere and on earth respectively. Moreover, technologies such as cryotherapy and cryopreservation Tam et al. (2009) are greatly influenced by the microscopic details of ice formation. It is surprising to discover that pure water freezes only at very strong supercooling, i.e. when it is brought to temperatures lower than -30C Sellberg et al. (2014). Water must, therefore, be freezing heterogeneously, as in a world where water would only freeze homogeneously, the Arctic Ocean would hardly turn into the icy playground of polar bears Martin (1981); Leppäranta (2015). Furthermore, if water only froze homogeneously, too much solar radiation would reach us as there would be no screening by ice-rich clouds Welch and Davis (1980); Yang et al. (2014). Luckily, ice can form at mild supercooling (i.e. at few degrees only below 0C) heterogeneously Murray et al. (2012), with the aid of foreign substances which lower the free energy cost needed to form a sufficiently large (or critical) nucleus of crystalline ice within supercooled liquid water. The nature of these impurities is astonishingly diverse Murray et al. (2012): for example, bacterial fragments, soot, pollen, volcanic ashes and mineral dust have all been shown to boost the rate of ice nucleation. Hence the question: what makes these very different substrates so effective in promoting ice formation? Surprisingly, a conclusive answer is yet to be found, mainly because the microscopic details of heterogeneous ice nucleation are still largely unresolved Slater et al. (2015).
Experiments can quantify the ability of a given substance to promote the formation of ice: for instance, a common approach consists of comparing the fraction of water droplets that freeze in a given time interval at a certain temperature with or without the presence of foreign particles Murray et al. (2010); Campbell, Meldrum, and Christenson (2015); Whale et al. (2015). However, the early stages and the atomistic mechanism of nucleation remain exceedingly challenging to probe experimentally. This is in large part because once the critical size (typically of the order of nanometers) of the ice nucleus has been reached, nucleation proceeds on very fast time scales (pico- or nanoseconds). This is why atomistic simulations can provide valuable insight, and complement experimental evidence by unraveling the details of the nucleation mechanism on different substrates at the molecular level. Having said that, however, nucleation is a rare event and seconds can pass before the spontaneous formation of a nucleus of critical size occurs. Running molecular simulations of these lengths is simply not tractable. This is why in the last few years substantial effort has been devoted to developing enhanced sampling techniques capable of tackling this time scale problem Chipot (2007); Sosso et al. (2016a). Moreover, equally serious issues often go unacknowledged, such as the ability of the interatomic potentials of choice to represent the water, the substrate, and the interaction between the two, or the extent to which simulations of ice nucleation are affected by specific computational details, such as the flexibility of the substrate.
Probing the importance of such aspects would require to investigate heterogeneous ice formation across a collection of different substrates: this is currently possible only by taking advantage of the computational speed granted by the coarse grained mW model Molinero and Moore (2009) for water. This approach led to many important findings, such as the influence of the hydrophobicity and/or lattice mismatch of different crystalline surfaces in promoting ice formation Fitzner et al. (2015) and the characterization of ice formation on carbonaceous particles Lupi and Molinero (2014); Lupi, Hudait, and Molinero (2014); Cabriolu and Li (2015); Lupi, Peters, and Molinero (2016); Bi, Cabriolu, and Li (2016). However, fully atomistic models are needed to deal with water at complex interfaces, such as crystalline surfaces of organic crystals or mineral dust particles. In these cases, it remains to be seen whether the description of the surface and most importantly of the water-surface interaction is accurate enough to allow for reliable results to be obtained.
Only a few works have probed ice formation on crystalline substrates by means of all-atom models Yan and Patey (2011a, 2013a); Zielke, Bertram, and Patey (2014); Cox et al. (2014); Sosso et al. (2016b). Here, we study heterogeneous ice nucleation at strong supercooling (=42K, where is the melting temperature) on the (001) surface of kaolinite using molecular dynamics (MD). Kaolinite is of great relevance in atmospheric science, and its surface structure and ice nucleation ability have been extensively investigated in both experiments Murray et al. (2011, 2012); Tobo et al. (2012); Welti et al. (2013); Wex et al. (2014) and simulations Hu and Michaelides (2010); Tunega, Gerzabek, and Lischka (2004); Cox et al. (2014); Zielke, Bertram, and Patey (2016). In particular, Cox and coworkers Cox et al. (2014) performed brute-force MD simulations of ice nucleation on kaolinite using small (102 molecules) models of the clay-water interface. Despite the substantial finite-size effects affecting these simulations, the results suggested that non-basal faces of ice, specifically the primary prism face of the hexagonal ice polytype, can nucleate on the hydroxylated basal face of kaolinite. This evidence has also been observed in brute-force MD simulations Zielke, Bertram, and Patey (2016) employing much larger (104 molecules) models. However, in that case nucleation was observed when the kaolinite surface was almost entirely kept frozen, i.e. atoms have been kept fixed at the experimental atomic positions of the bulk phase. In fact, it has been suggested Zielke, Bertram, and Patey (2016) that the flexibility of the kaolinite surface can substantially affect the time scale over which heterogeneous ice nucleation occurs. Moreover, we have recently succeeded in elucidating the kinetics of ice formation on this mineral Sosso et al. (2016b) by means of forward flux sampling (FFS) simulations Allen, Valeriani, and Rein ten Wolde (2009), an accurate path sampling technique which has been successfully employed to investigate crystal nucleation and growth in different systems Li, Donadio, and Galli (2013); Bi and Li (2014); Gianetti et al. (2016).
In this work, we investigate: (i.) the type of ice (cubic, , or hexagonal, ) that forms on the hydroxylated basal face of kaolinite; (ii.) how the surface relaxation of the clay alters ice formation at the water-kaolinite interface; (iii.) some aspects of how the force fields used perform for this system.
We demonstrate by seeded MD simulations that the hexagonal polytype of ice is likely to be the only one involved in the nucleation process, due to the favorable interaction between the hydroxylated (001) surface of kaolinite and the prism face of hexagonal ice. In fact, while large ( 450 molecules) seeds dissolve into liquid water, nuclei of the same size or smaller ( 250 molecules) grow within a wide temperature range. In addition, we show by means of very long (up to 2 s) unbiased MD simulations that nuclei of hexagonal ice exposing the prism face to the clay surface spontaneously occur as natural fluctuations of the water network. These findings are consistent with previous computational studies Cox et al. (2014); Zielke, Bertram, and Patey (2016); Sosso et al. (2016b), and provide conclusive evidence of the dominant role of the hexagonal polytype in the early stages of ice nucleation on the hydroxylated (001) surface of kaolinite.
We have also addressed whether the flexibility of the substrate, in this case the kaolinite surface, can affect the kinetics of ice formation within MD simulations. We find that equally flexible (or non-flexible) kaolinite surfaces can lead to very different outcomes in terms of ice formation. In particular, it seems that small structural changes can significantly alter the nucleation ability of this mineral. Thus, we assess the sensitivity of the nucleation mechanism to the microscopic structural features of the water-kaolinite interface. We find that surface relaxation, however small, can substantially alter the templating effect of kaolinite and that these effects can facilitate the heterogeneous formation of ice. Specifically, small structural changes in the arrangement of the hydroxyl groups at the surface affect the free energy cost needed to form a hexagonal motif of water molecules within the first overlayer: this templating structure is in turn very effective in promoting the formation of ice.
Finally, we briefly investigate whether the TIP4P/Ice and CLAY_FF force fields are capable to describe supercooled water and kaolinite respectively. We find that the CLAY_FF force field seems to provide a reliable description of ice nucleation at the water-KAOOH interface. However, the surface relaxation of the siloxane (001) surface of kaolinite predicted by the CLAY_FF is not consistent with first principles calculations results, thus putting into question the ability of this force field to deal with ice nucleation and growth on the siloxane face of kaolinite.
II Computational Methods
MD simulations have been performed using the GROMACS simulation package Van Der Spoel et al. (2005). The CLAY_FF Cygan, Liang, and Kalinichev (2004) and the TIP4P/Ice Abascal et al. (2005) force fields were used to model kaolinite and water respectively. We have not included the optional angular term (see Ref. 41) in the CLAY_FF force field, as we have verified that it does not affect the structure of the surface. So as to address the question of surface flexibility and relaxation, we have considered three different water-kaolinite interfaces, where water molecules are in contact with the hydroxylated (001) face of kaolinite (KAOOH):
-
S1 -
Frozen Surface, Unrelaxed: all the kaolinite atoms are kept fixed during the MD simulations at the experimental positions of the bulk system, except for the hydrogen atoms of the hydroxyl groups on the outer layer of the slab. These hydrogen atoms are bonded to the corresponding oxygen atoms via a harmonic constraint characterized by a spring constant of 2.3185 kJ/mol Å-2 acting on the O-H bond length (1.0 Å), as required by the CLAY_FF force field Cygan, Liang, and Kalinichev (2004). About 6000 water molecules have been placed between two kaolinite slabs mirroring each other. This interface is identical to that reported in Ref. 35.
-
S2 -
Frozen Surface, Relaxed: all the kaolinite atoms are kept fixed during the MD simulations at the average atomic positions of the system previously equilibrated in the absence of restraints at 230 K, except for the hydrogen atoms of the hydroxyl groups on the outer layer of the slab. The O-H bonds are treated with the same harmonic constraint of S1. Again in this system about 6000 water molecules have been placed between two kaolinite slabs mirroring each other.
-
S3 -
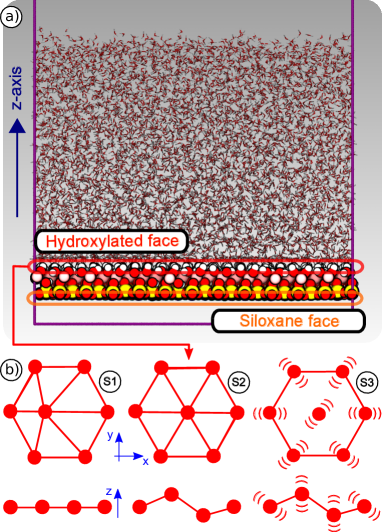
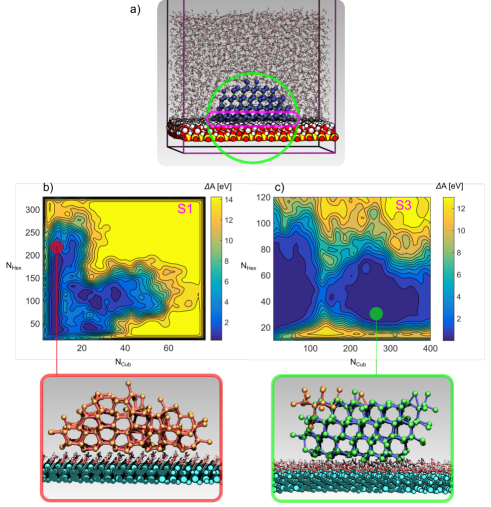
Flexible Surface: the positions of the silicon atoms within the kaolinite slab are restrained during the MD simulations by means of a harmonic potential characterized by a spring constant of 1.0 kJ/mol Å-2. The O-H bonds are treated with the same harmonic constraint of S1 and S2. All the other kaolinite atoms are unrestrained. About 6000 water molecules have been placed on top of a single kaolinite slab, as depicted in Fig. 1a.
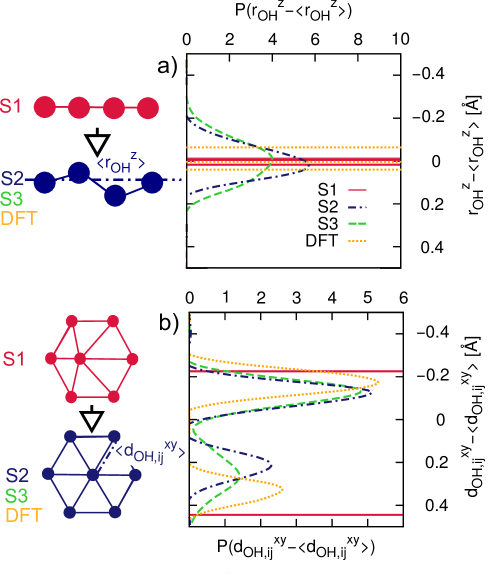
Schematic representations of S1, S2 and S3 are shown in Fig. 1b. Note that upon surface relaxation the arrangement of the hydroxyl groups becomes more symmetric in the xy plane and more corrugated with respect to the z axis (normal to the 001 plane). Additional details about S1, S2 and S3 as well as about additional models for the water-kaolinite interfaces are discussed in the Supplementary Material (SM). The interaction parameters between the clay and the water were obtained using the standard Lorentz-Berthelot mixing rules Lorentz (1881); Berthelot and Hebd (1898), which yields water-surface interaction energies in good agreement with high quality reference data from quantum Monte Carlo calculations 111Specifically, the adsorption energy of a single water molecule on top of the hydroxylated (001) surface of kaolinite (calculated as where , and are the total energy of a kaolinite slab with a water molecule on top, the energy of the slab alone and the energy of the water molecule in vacuum respectively) on its most favorable adsorption site is -646 60 meV, in excellent agreement with the quantum Monte Carlo result of -648 18 meV AND . The equations of motion were integrated using a leap-frog integrator with a timestep of 2 fs. The van der Waals (non bonded) interactions were considered up to 10 Å, where a switching function was used to bring them to zero at 12 Å. Electrostatic interactions have been dealt with by means of an Ewald summation with a real space cutoff at 14 Å. The NVT ensemble was sampled at 230 K using a stochastic velocity rescaling thermostat Bussi, Donadio, and Parrinello (2007) with a very weak coupling constant of 4 ps in order to avoid temperature inhomogeneities throughout the system. The geometry of the water molecules (TIP4P/Ice being a rigid model) was constrained using the SETTLE algorithm Miyamoto and Kollman (1992) while the P_LINCS algorithm Hess et al. (1997) was used to constrain the O-H bonds within the clay. The system was equilibrated at 300 K for 10 ns, before being quenched to 230 K over 50 ns. For each interface S1, S2 and S3 (plus the other interfaces discussed in the SM), 10 independent MD simulations have been performed to look for nucleation events and in order to extract the equilibrium canonical averages used to compute free energies. Details concerning the order parameter used to identify ice-like water molecules are reported in the SM.
We have also performed density functional theory (DFT) calculations as part of this study: periodic kaolinite slab models were used within the plane wave pseudopotential approach, using both GGA (Generalized Gradient Approximation) and dispersion inclusive GGA exchange-correlation functionals. Full details are included in the SM.
III Results
III.1 Ice Nucleation on Kaolinite: Hexagonal vs Cubic Ice
At strong supercooling ( 40 K ), homogeneous water freezing results in a mixture of and that is known as stacking disordered ice Moore and Molinero (2011); Hansen et al. (2008); Malkin et al. (2014); Slater and Quigley (2014); Quigley (2014) (). However, previous computational studies Cox et al. (2014); Zielke, Bertram, and Patey (2016) suggest that the formation of ice at the water-kaolinite interface proceeds via the nucleation of only, possibly due to the favorable interaction between its prism face and the hydroxyl groups on the clay surface.
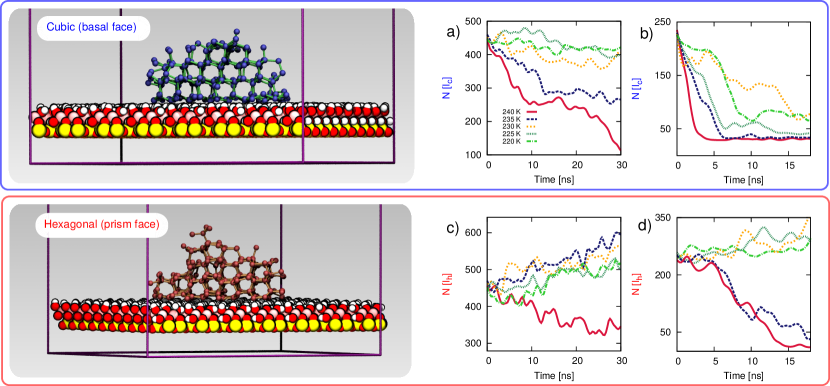
Here, we have explicitly compared the preference of the hydroxylated (001) surface of kaolinite for nucleating either or by means of seeded MD simulations. Specifically, we have inserted several crystalline nuclei of either cubic or hexagonal ice into the system, and then subsequently observed at which temperature they shrink into the liquid phase and at which temperatures they proceed toward full crystallization. Seeded MD simulations are an efficient way of obtaining a qualitative picture of crystal nucleation and growth, having been successfully used recently to explore homogeneous water freezing Sanz et al. (2013); Espinosa et al. (2014, 2016). In the case of heterogeneous ice nucleation, however, one serious issue with seeded MD simulations is the choice/construction of the crystalline seeds. In fact, it is: (i.) rather difficult to guess a priori which crystallographic face - if any - of a certain ice polytype will form at the water-kaolinite interface and; (ii.) it is even more challenging to construct a feasible hydrogen bond network between the ice seed and the surface. In this work it is clear how to resolve problem (i.) as we already know that the prism face of and the basal face of bind to kaolinite most strongly Cox et al. (2014). As for the hydrogen bond network, we have employed metadynamics simulations Laio and Parrinello (2002); Laio and Gervasio (2008) to generate reasonable models of and spherical caps in contact with the kaolinite surface, as depicted in Fig. 2. The ice nuclei obtained in this way (details are discussed in the SM) have a very good match between the crystalline ice seeds and the kaolinite surface, that would be very difficult to obtain otherwise. We have considered ice nuclei containing 250 or 450 water molecules at a flexible interface (model S3, as discussed below). A criterion based on the Steinhardt order parameter Steinhardt, Nelson, and Ronchetti (1983) has been used to label each water molecule in the system as liquid, ice-like, and/or belonging to the cubic or hexagonal polytype, as described in the SM. The starting configurations that were obtained from the metadynamics simulations have been equilibrated at 220 K for 200 ps, before collecting a series of unbiased MD runs at different temperatures (220, 225, 230, 235 and 240 K), that were initiated by randomizing the initial atomic velocities in a manner consistent with the corresponding Maxwell-Boltzmann distribution at the temperature of interest.
The results are summarized in Fig. 2, where we report the number of and molecules within the ice seeds as a function of simulation time. We find that seeds containing as many as 450 molecules are not stabilized by the presence of the surface and dissolve at any temperature we have probed (see Fig. 2a and Fig. 2b). In contrast, 450-molecule seeds clearly grow up to 235 K (see Fig. 2c), and even small 250-molecule nuclei proceed toward crystallization below 235 K (see Fig. 2d). These findings indicate that the basal face of cubic ice is exceedingly unlikely to form on the KAOOH surface, and that the heterogeneous critical nucleus size for ice on top of this kaolinite surface is of the order of 250 molecules at 230 K. This is consistent with the estimate of 22525 molecules obtained via the FFS simulations reported in Ref. 28. Note that the homogeneous critical nucleus size at the same supercooling is more than two times larger: 540 molecules Haji-Akbari and Debenedetti (2015), where the same order parameter has to be used to compare our results with those of Ref. 60, as discussed in the SM. Thus, our findings suggest that ice nucleation on the KAOOH surface most likely proceeds via the formation of the prism face of , in agreement with the simulations of Cox et al. Cox et al. (2014) and Zielke et al. Zielke, Bertram, and Patey (2016) as well as with our FFS simulations Sosso et al. (2016b).
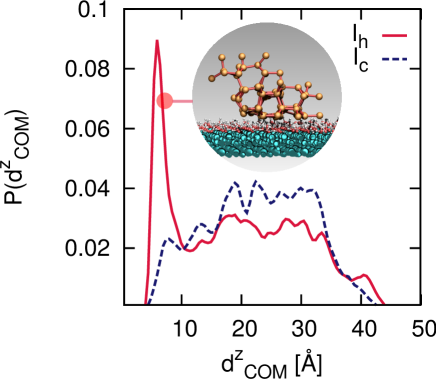
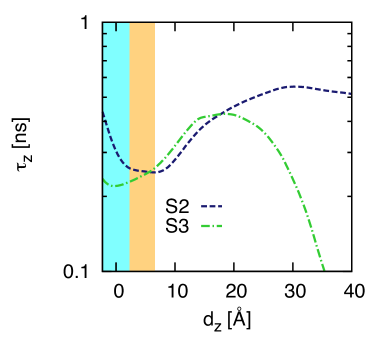
Before moving on we stress, however, one drawback of seeded MD simulation: they assume a priori the composition, the structure, the size and the shape of the crystalline seeds. Thus, even if the latter do grow, one has to verify that such seeds are compatible with the spontaneous, fluctuations of the system, in this case of the water network. To explore this, we have performed a very long (2 s long) unbiased MD simulation, looking at the natural, pre-critical fluctuations of the water network toward the ice phase. In particular, we have determined for each configuration along the trajectory whether the largest ice nucleus in the system is predominantly mos made of either or . The probability density of the distance of the center of mass of the ice nuclei from the kaolinite surface (along the z direction normal to the surface) is reported in Fig. 3 for both and nuclei. While a similar fraction of and nuclei can be observed within the bulk of the water slab, close to the water-kaolinite interface there is a very clear preference for nuclei, while the probability for the polytype drops sharply. Importantly, we find that of all the large (i.e. containing more than 60 water molecules) pre-critical ice nuclei, a substantial fraction (25%) still sit on top of the kaolinite surface (that is, at least one water molecule that belongs to the ice nucleus sits within the first overlayer on the clay). In addition, 98% of this subset consists of nuclei of that expose the prism face to the kaolinite surface (as illustrated in the inset of Fig. 3). We can thus safely assert that the nuclei we have investigated with seeded MD can indeed form on the face within spontaneous, pre-critical fluctuations of the water network, and that nuclei exposing the prism face to the kaolinite surface are the most likely to nucleate at this supercooling.
III.2 Surface Relaxation and Ice Nucleating Ability
It has been suggested that the ability of the KAOOH face to promote the formation of ice nuclei stems from the templating effect of the hexagonal arrangement of hydroxyl groups Pruppacher and Klett (1997); Cox et al. (2014), as depicted in Fig. 1. Moreover, recent MD simulations Zielke, Bertram, and Patey (2016) performed at strong supercooling (=42 K) that employed the TIP4P/Ice water model indicate that the flexibility of these hydroxyl groups is crucial when it comes to promoting heterogeneous ice nucleation. Specifically, the formation of ice on the KAOOH face happens spontaneously in unbiased MD simulations within 100 ns, provided that all the kaolinite atoms except for the hydrogen atoms of the hydroxyl groups at the water-kaolinite interface are frozen at the experimental positions of the bulk system. We refer to this setup as interface S1 (see Sec. II). On the other hand, restraining the dynamics of the oxygen atoms of the same hydroxyl groups using a harmonic potential, as opposed to completely freezing the atomic positions, prevented the formation of ice within the s time scale.
In order to investigate how exactly the flexibility of the substrate influences the formation of ice in MD simulations, we have considered in addition to the S1 interface discussed in Ref. 35 two different water-kaolinite interfaces S2 and S3 (see Sec. II). In S2, kaolinite atoms are kept frozen during the MD simulations exactly as for S1, but the starting configuration has been obtained from a kaolinite slab previously equilibrated (without imposing any restraint) at 230 K. In S3, the kaolinite atoms are instead unconstrained and the surface is flexible. Upon running unbiased MD simulations on these three substrates, we found that no nucleation events occur for both S2 and S3 up to 2 s, whereas on S1 ice formation occurs rapidly (within 100 ns). We expected this result for S3, as according to Ref. 35 the flexibility of the surface should prevent ice formation on this timescale. However, the fact that we do not observe ice nucleation on the S2 surface is surprising, as they are both frozen surfaces and the only difference between S1 and S2 is that the latter was relaxed prior to the MD simulation of the frozen substrate.
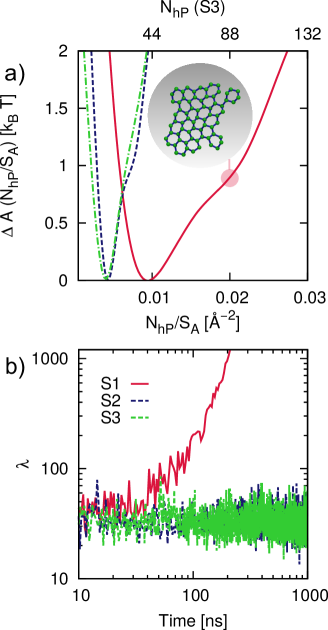
The structure of the KAOOH face facilitates the formation of a hexagonal motif of water molecules within the first overlayer (depicted in the inset of Fig. 4a). This structure is in turn compatible with the prism face of hexagonal ice or the basal face of cubic ice Cox et al. (2014); Zielke, Bertram, and Patey (2016). The likelihood for formation of ice on the KAOOH face is related to the free energy cost needed to form a hexagonal patch (or connected cluster of water molecule hexagons) containing water molecules at the water-clay interface. Here we have quantified this free energy cost for the three interfaces S1, S2 and S3 as follows: we start by pinpointing six-membered rings of oxygen atoms within the first water over layer on the surface. To do that, we took advantage of the R.I.N.G.S. Le Roux and Jund (2010) code, and analyzed our simulations with a nearest-neighbors distance set to 3.2 Å and King’s shortest path criterion King (1967); Franzblau (1991). We then selected only those rings for which each triplet of adjacent oxygen atoms is characterized by an in plane angle = 120 20, where
| (1) |
Here, is the component of the distance vector between oxygen atoms and . We then calculate the number of water molecules within the largest connected clusters of hexagonal rings. We have collected about 104 values of from the first 10 ns of 10 independent MD runs for each interface. As S1, S2 and S3 have slightly different surface area , we have normalized by the latter the value of . We subsequently evaluate the free energy profile as a function of as:
| (2) |
where is the Boltzmann constant and is the equilibrium equ probability density distribution for . The results, obtained by taking into account the first 10 ns of 10 independent simulations for each interface (in order to avoid the onset of ice formation for S1) are reported in Fig. 4a. In the case of S1, the free energy profile is rather shallow: for instance, 1 is sufficient to produce a rather large hexagonal patch containing 90 water molecules. As a result, the whole first overlayer of water molecules relaxes into this hexagonal pattern within 50-100 ns, quickly triggering crystallization (as shown in Fig. 4b). This is why at this interface the formation of ice does not proceed via nucleation events, but instead through a relaxation process. In fact, the onset of crystallization is determined by the time needed for the first water overlayer to relax into the hexagonal template. We have verified that for ten independent simulations the induction times for ”nucleation” at the S1 surface are all very similar, thus resulting in a survival probability for the liquid phase (reported in the SM) which is typical of a relaxation process, as opposed to the stochastic nature of nucleation events. We also note that the kinetics of ice formation on S1 is nonphysical, being about six orders of magnitude faster than the nucleation rate we have obtained for S3 via FFS calculations Sosso et al. (2016b).
On the other hand, the occurrence of large (50) hexagonal patches for S2 and S3 is exceedingly rare compared to S1: for instance, the same free energy cost needed for S1 to form a hexagonal patch containing 90 water molecules results for both S2 and S3 in a patch about two times smaller. Hence, despite the fact that S2 is kept frozen while S3 is fully flexible, the two interfaces show very similar free energy profiles. Indeed the free energy cost needed for the interface to form a templating water overlayer is the same for S2 and S3, and as a consequence, no ice nucleation is observed for either interface on the s timescale (as illustrated in Fig. 4b). We note that we observe a very similar scenario for S1 when we restrain the oxygen atoms of the hydroxyl groups using a harmonic potential instead of freezing them completely: consistent with Ref. 35, we do not observe ice formation. This happens because the harmonic restraints do not prevent surface relaxation from taking place. Consequently, this constrained S1 surface resembles S2. This relaxation, however small, is enough to alter the ability of KAOOH to produce a large enough hexagonal patch. In fact, we have also verified that by just relaxing the S1 interface at zero K - without equilibrating the kaolinite surface at 230 K, and subsequently freezing the atomic position exactly as we did for S1, we obtain results very similar to what we observe for S2. In particular, ice does not form within the s timescale, and the extent of surface relaxation and the free energy cost to create the templating hexagonal overlayer are comparable to the outcomes of the S2 scenario.
To understand these results we have examined the structures of the various slabs with the CLAY_FF force field and also DFT. The changes in the structure of the KAOOH (001) surface upon relaxation, particularly the arrangement of the hydroxyl groups, are summarized in Fig. 5. We have quantified the corrugation (or surface roughness) of the surface in terms of the deviation of the height (along the z direction normal to the slab) of the oxygen atoms of the hydroxyl groups from their mean height , as shown in Fig. 5a. While S1 is basically flat, we observe a small degree of corrugation, up to 0.2 Å, for S2 and S3. Relaxing S1 at the DFT level leads to a very similar degree of corrugation. The in-plane arrangement of the hydroxyl groups at the surface is also affected by surface relaxation. Fig. 5b shows the probability density distribution for the deviation of the in-plane (xy plane parallel to the slab) nearest neighbor distance of the oxygen atoms of the hydroxyl groups from their mean nearest neighbor distance for S1, S2 and S3. Both S2 and S3 are characterized by a non negligible spread of , which in turn leads to a more symmetric arrangement (see Fig. 5b). The same conclusion holds for the structure obtained upon DFT relaxation of S1, albeit the extent of surface relaxation appears to be less pronounced. Despite the fact that the overall extent of surface relaxation for the KAOOH surface appears to be quite small (ca. 0.1 Å), these marginal structural changes can play a significant role when it comes to the formation of ice on this clay. This is not entirely unexpected, as we have recently shown Fitzner et al. (2015) that the ice nucleation rate for the coarse grained mW model of water Molinero and Moore (2009) on Lennard-Jones crystals (at = 70 K) can change by several orders of magnitude just because of deviations of ca. 0.2 Å in the lattice parameter of the crystalline surface.
It is important to note that S2 differs from S3 in terms of dynamical properties. For instance, the structural relaxation time (defined and discussed in the SM) of the water network within the first overlayer for S2 is two times larger than that obtained for S3. This means that water dynamics at the interface with the KAOOH face is slower for S2 (and qualitatively for S1 as well, as discussed in the SM), as the frozen surface interacts more strongly with the water molecules, in a manner which is consistent with early findings for Lennard-Jones interfaces Haji-Akbari and Debenedetti (2014). The absence of nucleation for S2 and S3 on the same s timescale indicates that the dynamics of water at the kaolinite-water interface has a lesser impact than the structure of the clay on the tendency for ice to form.
This observation that the degree of surface relaxation can strongly affect the nucleation dynamics leads one to ask whether other technicalities play a role. For instance, kaolinite slabs have a non-zero dipole moment, which in principle can affect the nucleation process: in fact, it has been reported that electric fields can affect the freezing of water Yan and Patey (2011b, 2013b). Moreover, water-surface and/or water-vacuum interfaces introduce structural and dynamical fluctuations into the water network, which must decay within the thickness of the water film on top of the mineral. However, it seems that these issues do not affect the outcome of MD simulations of ice formation in the case of kaolinite. In fact, we have been able to reproduce the results of the MD simulations of ice formation on kaolinite reported in Ref. 35 (at the same supercooling and employing the same water model) using a number of different computational setups, as discussed in the SM. In contrast, we argue that the tiniest structural details of the surface are crucial in determining the kinetics of ice formation on crystalline surfaces within atomistic simulations, and that surface relaxation can play an even more relevant role than the flexibility of the surface in promoting the formation of ice on this particular kaolinite surface. At this stage, it is reasonable to speculate that both flexibility and surface relaxation are likely to be a general issue when dealing with MD simulations of heterogeneous ice nucleation. It could be that the structural details of a particular substrate will determinate which one of the two would be the dominant factor in ruling the kinetics of ice formation.
III.3 The Impact of the Force Field
Before ending we briefly comment on the force field models employed. Many options are available to simulate water Vega, Sanz, and Abascal (2005); Molinero and Moore (2009); Orsi (2014); Sosso et al. (2016a). The coarse grained mW model Molinero and Moore (2009) is computationally very fast and as such it has been extensively used to model heterogeneous ice nucleation on e.g. carbonaceous particles Lupi and Molinero (2014); Lupi, Hudait, and Molinero (2014); Cabriolu and Li (2015) and Lennard-Jones crystals Fitzner et al. (2015). However, with coarse grained approaches a truly atomistic description of the nucleation mechanism cannot be achieved, and more importantly it is difficult to describe the interaction between water and a complex material. This is why here we have employed the atomistic TIP4P/Ice rigid model Abascal et al. (2005) for water in this work. This model reproduces many structural and dynamical properties of liquid water as well as of different ice phases correctly Abascal et al. (2005), and it has been recently used to obtain an accurate reference for the thermodynamics and kinetics of homogeneous freezing Haji-Akbari et al. (2014) at 230 K, corresponding to a supercooling =42 K (TIP4P/Ice water melts at 272 K). At this supercooling, the dynamics of the water network is far from being homogeneous Mazza et al. (2006); Kumar et al. (2007) and special care has to be taken to correctly reproduce quantities like the self-diffusion coefficient and the structural relaxation time, as detailed in the SM.
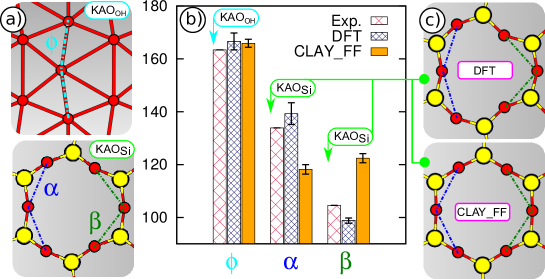
The CLAY_FF force field Cygan, Liang, and Kalinichev (2004) is widely used to model clays as well as the interaction between clays and water, including swelling properties Liu and Lu (2006) and confinement effects Haria, Grest, and Lorenz (2013). As we are interested in having a reliable description of the water-surface interface, we have investigated the extent of surface relaxation for two kaolinite surfaces customarily investigated in the context of heterogeneous ice nucleation: the hydroxylated (KAOOH) and siloxane (KAOSi) (001) faces (see Fig. 1a). As shown in Fig. 6a, the arrangement of oxygen atoms at the surface, which is critical in templating ice formation Hu and Michaelides (2007); Cox et al. (2014); Zielke, Bertram, and Patey (2016), can be described by the O-O-O angles (for KAOOH), and (for KAOSi). We compare in Fig. 6b the values of , and at the experimental atomic positions (Exp., as obtained upon cleavage of the bulk crystal) with those obtained for the relaxed configurations of KAOOH and KAOSi, calculated by DFT and CLAY_FF. In the case of the KAOOH face, changes by 3 for both DFT and CLAY_FF. However, DFT and CLAY_FF simulations give substantially different results for the KAOSi face: DFT predicts a marginal increase of the asymmetric buckling between oxygen and silicon atoms (140 and 100), as depicted in the inset of Fig. 6b; in contrast, the CLAY_FF relaxed structure is almost perfectly symmetric (120), the buckling is absent and the atoms at the surface form regular hexagonal patterns. Note that this symmetric arrangement of oxygen atoms at the KAOSi surface has also been predicted by the CLAY_FF force field for materials such as mica Wang et al. (2005), while DFT calculations on the same system Odelius, Bernasconi, and Parrinello (1997) resulted in buckled arrangements, in line with what we have observed in here. We remark that different starting structures and/or different DFT exchange-correlation functionals do not affect these findings, as reported in the SM. Whether the actual structure of the KAOSi face upon surface relaxation is closer to the CLAY_FF or the DFT prediction remains to be seen. This is one reason why here we have limited the discussion to the KAOOH (001) surface.
IV Discussion
We have investigated several aspects of atomistic simulations of heterogeneous ice nucleation on a realistic surface, choosing as an example the well-characterized (001) surface of kaolinite, a prototypical clay mineral of relevance to ice formation in the atmosphere.
Previous MD simulations Cox et al. (2014); Zielke, Bertram, and Patey (2016) suggest that ice nucleation occurs on the hydroxylated (001) kaolinite surface via the formation of hexagonal ice, due to the favorable interaction between its prism face and the hexagonal arrangement of the hydroxyl groups at the surface of the clay. Here, we have established the preference of the surface for hexagonal ice over the cubic polytype by means of seeded MD simulations using a fully flexible model of kaolinite. We find that nuclei of cubic ice exposing the basal face to the clay are not stabilized by the presence of the surface and that these nuclei therefore tend to shrink back into the liquid phase. On the other hand, nuclei of hexagonal ice substantially wet the kaolinite surface and proceed to grow. We have estimated the critical nucleus size for these nuclei of hexagonal ice to be roughly two times smaller than what has been reported for homogeneous water freezing at the same supercooling.
We have also verified by looking at the natural fluctuations of the water network at a flexible water-kaolinite interface using a very long (s) unbiased MD simulation that the overwhelming majority of pre-critical ice nuclei that form on top of the clay are indeed made of hexagonal ice exposing the prism face to the surface. This demonstrates that such nuclei spontaneously form at the surface, and that indeed the hexagonal polytype is the only one involved in the early stages of heterogeneous ice nucleation on this particular kaolinite surface.
As discussed, it has recently been reported Zielke, Bertram, and Patey (2016) that the flexibility of the clay surface influences the rate of ice formation. In this work, we find that surface relaxation can be equally important. In particular, small changes in the structure of the hydroxylated (001) kaolinite face drastically alter the free energy cost needed to form an extended hexagonal motif of ice-like molecules at the water-kaolinite interface. The occurrence of this templating layer leads to the formation of ice within 100 ns if the atoms of the kaolinite surface are frozen at the experimental positions of the bulk phase. However, upon surface relaxation the free energy cost for creating such a template is much higher and nucleation does not take place on the s timescale. Note that of all the water-kaolinite interfaces considered in this work, S3 is arguably the best representation of the system, as actual surfaces are not frozen and/or unrelaxed.
In addition, we note that the CLAY_FF force field, customarily used to model clays as well as water interacting with clays, seems to provide a reliable description of ice nucleation at the water-KAOOH interface. However, this classical force field predicts, in the case of the siloxane (001) surface of kaolinite, a surface relaxation which is not consistent with the outcome of DFT calculations. Thus, we argue that at this stage is not clear whether the formation of ice on this particular surface can be safely modeled using the CLAY_FF force field.
We also remark that the fact that the nucleation process is so sensitive to the structure of the interface strongly suggests that future efforts should be devoted to produce more accurate interatomic force fields for water at complex interfaces. In fact, we have seen that subtle effects such as surface relaxation can truly affect the nucleation kinetics to an point where it becomes rather difficult to benchmark computational results and most importantly to compare them with experimental data.
Acknowledgements.
This work was supported by the European Research Council under the European Union’s Seventh Framework Programme (FP/2007-2013)/ERC Grant Agreement number 616121 (HeteroIce project). A.M. is also supported by a Royal Society Wolfson Research Merit Award. AM and AZ work has also been sponsored by the Air Force Office of Scientific Research, Air Force Material Command, USAF, under grant number FA8655-12-1-2099. The authors acknowledge the use of the UCL Grace and Legion High Performance Computing Facilities, the use of Emerald, a GPU-accelerated High Performance Computer, made available by the Science & Engineering South Consortium operated in partnership with the STFC Rutherford-Appleton Laboratory and the use of ARCHER UK National Supercomputing Service (http://www.archer.ac.uk) through the Materials Chemistry Consortium through the EPSRC grant number EP/L000202.SUPPLEMENTARY MATERIAL
| Interface | N. of water mol. | Cell vectors [Å] | Slab geometry | Restraints | Starting conf. | Ice nucl. within 100 ns | ||
|---|---|---|---|---|---|---|---|---|
| A | B | C | ||||||
| S1 | 6464 | 51.5 | 62.6 | 84.2 | 2SM | F | Exp. | Y |
| S1R | 6464 | 51.5 | 62.6 | 84.2 | 2SM | F | Relax | N |
| S2 | 6464 | 51.8 | 62.9 | 84.2 | 2SM | F | 230K | N |
| S3 | 6144 | 61.8 | 71.5 | 150 | 1S | N | Exp. | N |
| SE_2 | 6464 | 51.5 | 62.6 | 84.2 | 2SM | FH | Exp. | N |
| SE_3 | 6464 | 51.5 | 62.6 | 84.2 | 1S | F | Exp. | Y |
| SE_4 | 6464 | 51.5 | 62.6 | 84.2 | 1S | F | Exp. | Y |
| SE_5 | 6464 | 51.5 | 62.6 | 84.2 | 2SML | F | Exp. | Y |
| SE_6 | 6464 | 51.5 | 62.6 | 84.2 | 2SML | F | Exp. | Y |
We provide supplementary material about the atomistic simulation of the water-kaolinite interface. We discuss:
-
•
The dynamical properties of the supercooled water network
-
•
The DFT calculations of kaolinite surface relaxation
-
•
The computational geometries used to model the water-kaolinite interface and how they affect the formation of ice
-
•
The formulation of the order parameter used to pinpoint ice nuclei
-
•
The ice formation on the interface S1, where structural relaxation is faster than ice nucleation
-
•
The details of the metadynamics simulations used to generate the ice nuclei for seeded molecular dynamics
I Dynamical properties of supercooled water
At the strong supercooling =42 K considered in this work, the dynamics of the water network is heterogeneous. Thus, special care must be taken to ensure the computational setup used is able to capture the correct dynamical properties of the system. To this end, we have calculated the self-diffusion coefficient for a 4096-molecule model of TIP4P/Ice water, simulated within the NPT ensemble. The usual Einstein relation:
| (3) |
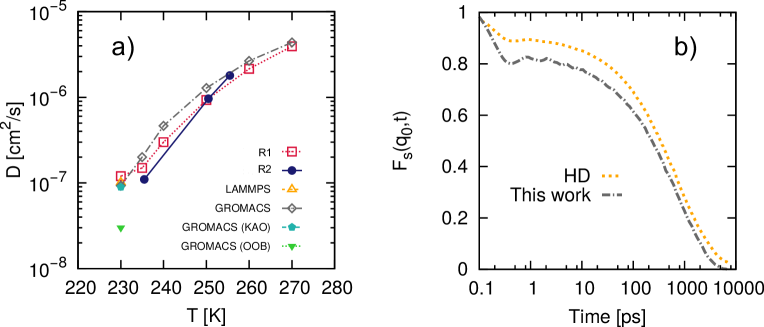
has been used, where is the time average of the position vector for all the oxygen atoms in the system and is the dimensionality of the system, equal to three or two for bulk or bi-dimensional systems respectively. The same computational details reported in Sec. 2 of the main text have been used. The system has been equilibrated for 10 ns at 300 K, and subsequently quenched at the temperature of interest in 20 ns. Production runs lasted 40 ns. We found that in this case dynamical properties are not affected by the choice of the pressure control algorithm, the Berendsen or the Parrinello-Rahman barostats giving identical results which are reported in Fig. 1a as the GROMACS dataset. Literature data (R1 and R2 in Fig. 1a) are also reported. The agreement between the different sets of data is very good at mild supercooling, but it gets worse at low temperatures (e.g. at 235 K). The value of obtained by a cross-check calculation performed via LAMMPS, also reported, is in excellent agreement with the result obtained via our setup (GROMACS) and the GROMACS(KAO) results in Fig. 1a. These refer to the computational setup we have used to model the water-KAOOH interface, where the diffusion coefficient has been evaluated within the bulk-like region of the water film on top of the KAOOH slab via NVT MD simulations. Finally, we note that using the default GROMACS settings, a substantially smaller value of has been obtained - GROMACS(OOB) in Fig. 1a. We have also computed the incoherent intermediate scattering function as:
| (4) |
where the sum runs over all the oxygen atoms having position at time and is a vector in reciprocal space. In an isotropic system, depends only on the magnitude of the vector , which selects the length scale (within the water network) probed by the scattering function. The most common choice is to take equal to the position in reciprocal space of the maximum of the structure factor S(q), which for our model at 230 K corresponds to 1.845 Å-1. contains several information about the dynamics of the system. The interested reader is referred to e.g. Refs. 82; 83. Here we just note that the time for which gives a measure of the structural relaxation time of - in this case - the water network. Our result for bulk water at 230 K is reported in Fig. 1 together with the calculated for the same model and slightly different settings (different MD code and possibly different values of ) in Ref. 60. We obtain a structural relaxation time 0.5 ns to be compared with the value of 0.6 ns reported in Ref. 60. This result gives us confidence in the reliability of our MD simulations setup in describing the dynamics of the system.
II DFT calculations of surface relaxation
In the main text we have discussed the surface relaxation of kaolinite. Specifically, we have shown that classical simulations using the CLAY_FF force field and first principles simulations using density functional theory (DFT) give very similar result for the hydroxylated face (KAOOH), but they disagree with respect to the relaxation of the siloxane (KAOSi) face of kaolinite. To date, there are no experimental indications about surface relaxation for kaolinite surfaces, so that we cannot establish whether DFT calculations do a better job than the CLAY_FF in reproducing the geometry of the KAOSi face. As a rule of thumb, DFT calculations are likely to outperform conventional classical force fields such as CLAY_FF. However, it has to be said that DFT results can be particularly sensitive in this case to:
-
•
The setup by which we model the kaolinite slab. We used a three dimensional periodicity with a vacuum region between slabs of 15 Å, and the nonphysical dipole interaction across the slab (kaolinite has a dipole orthogonal to the (001) plane) was corrected with the scheme of Neugebauer and Scheffler, Makov and Payne (1995); Neugebauer and Scheffler (1992) in order to mimic a 2D system. We have performed geometry relaxations keeping the cell shape and volume fixed: in order to demonstrate that our results are not affected by different simulation boxes, we have considered three different starting points: (1) the cell of the experimental bulk kaolinite, adding the vacuum on the direction orthogonal to the layer; (2) as 1, but starting from the cell of the bulk kaolinite obtained upon full relaxation (of ions, cell shape and volume) via DFT with the PBE functional Perdew, Burke, and Ernzerhof (1996, 1997); (3) as 2, but using the optPBE-vdW functional Klimeš, Bowler, and Michaelides (2010).
-
•
The choice of the exchange-correlation (XC) functional. In order to rule out spurious artifacts due to the unlucky choice of a specific XC functional, we have performed geometry optimization considering several different commonly used XC functionals. Specifically, two GGA functionals: PBE Perdew, Burke, and Ernzerhof (1996, 1997) and RPBE Hammer, Hansen, and Nørskov (1999); three vdW corrected PBE functionals: PBE-D2 Grimme (2006), PBE-D3 Grimme et al. (2010) and vdW(TS) Tkatchenko and Scheffler (2009); and four recently developed fully self-consistent non-local functionals: vdW-DF2 Lee et al. (2010), revPBE-vdW Zhang and Yang (1998); Dion et al. (2004), optB86b-vdW Klimeš, Bowler, and Michaelides (2011) and optPBE-vdW Klimeš, Bowler, and Michaelides (2010).
Concerning the computational details: DFT calculations were performed using the plane-wave code VASP 5.4.Kresse and Hafner (1993, 1994); Kresse and Furthmuller (1996a, b). Calculations using the van der Waals density functionals were carried out self-consistently using the approach of Román-Pérez and SolerRomán-Pérez and Soler (2009) as implemented in VASP by Klimeš et al.Klimeš, Bowler, and Michaelides (2011). Electron-core interactions were described using the projector-augmented waveBlochl (1994); Kresse and Joubert (1999) (PAW) potentials supplied with VASP. PBE potentials for all functionals were used. It has been shown on a range of systems for the van der Waals functionals that this approximation with the PAW potentials does not introduce any significant errors in the energies and structures.Klimeš, Bowler, and Michaelides (2011); Graziano et al. (2012) The plane-wave energy cut-off is 500 eV. The sampling of the reciprocal space was performed using a Monkhorst-Pack -point meshMonkhorst and Pack (1976) per simulated supercell of for the bulk calculations, and for the slab calculations with PBE functional. We verified that a Monkhorst-Pack -point mesh is already at convergence for the geometrical properties of the slab, thus we used that for all the other XC functionals considered.
With respect to the CLAY_FF results, we have verified that surface relaxation is not affected by different simulation boxes, nor by the inclusion of the angular term described in Ref. 41. The numbers reported in Table 2 are obtained as an average over all the angles of interest within the S3 kaolinite slab (see main text).
The results for all the performed DFT evaluations, in comparison with those from the CLAY_FF model, are summarized in Table 2, demonstrating that the disagreement between DFT and CLAY_FF with respect to the surface relaxation of the KAOSi face is a solid result that holds for a diverse portfolio of computational setups.
| KAOSi | KAOOH | ||||
| System | Method | Cell | |||
| Bulk | Exp. | 133.9 | 104.6 | 163.4 | |
| Bulk | PBE | 132.7 | 106.1 | 162.6 | |
| Slab | CLAY_FF | S3 | 118.2 | 122.4 | 165.9 |
| Slab | PBE | Exp. | 144.8 | 93.3 | 168.2 |
| Slab | PBE | PBE | 139.3 | 98.8 | 166.6 |
| Slab | PBE | optPBE-vdW | 141.0 | 97.0 | 166.8 |
| Slab | RPBE | optPBE-vdW | 141.9 | 96.0 | 167.1 |
| Slab | PBE-D2 | optPBE-vdW | 141.8 | 96.2 | 167.5 |
| Slab | PBE-D3 | optPBE-vdW | 141.3 | 96.7 | 167.1 |
| Slab | vdW(TS) | optPBE-vdW | 141.3 | 96.6 | 167.0 |
| Slab | vdW-DF2 | optPBE-vdW | 143.4 | 94.6 | 167.8 |
| Slab | revPBE-vdW | optPBE-vdW | 143.2 | 94.8 | 167.7 |
| Slab | optB86b-vdW | optPBE-vdW | 142.1 | 95.9 | 167.1 |
| Slab | optPBE-vdW | optPBE-vdW | 142.6 | 95.3 | 167.5 |
III Computational geometries
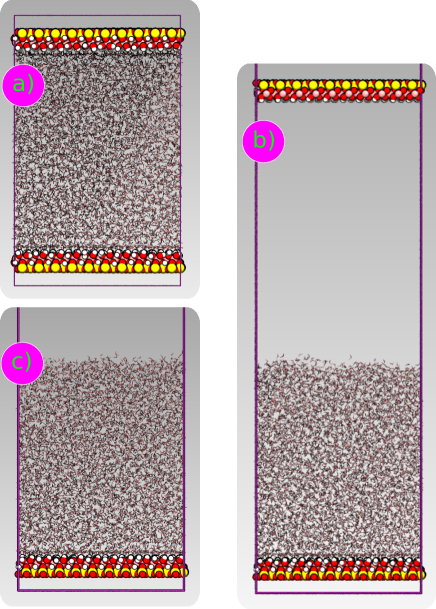
In order to assess whether different computational geometries affect the results of our MD simulations of ice formation, we have considered the setups described in Table II, also depicted in Fig. 2. 2SM refers to mirrored two-slabs setup described in Ref. 35 (Fig. 2a), while the setup where water is put on top of a single kaolinite slab is labeled as 1S (Fig. 2c). The 2SML setup refers to the 2SM setup where the upper slab has been moved far away from the water film on top of the lower slab (Fig. 2b). In this way, the dipole moments of the two slabs still compensate each other while the water network is free to relax at its natural density. Concerning restraints: F refers to the situation where all the atoms in the kaolinite slab are kept frozen, avoiding the integration of the equations of motion. Hydrogen atoms belonging to the hydroxyl groups on top of the KAOOH face are still allowed to move, though, as they are bonded to the correspondent oxygen atoms via an harmonic constraint characterized by a spring constant of 2.3185 kJ/mol Å-2 acting on the O-H bond length (1.0 Å), as required by the CLAY_FF force field Cygan, Liang, and Kalinichev (2004). In the case of N, the positions of silicon atoms within the kaolinite slab are restrained during the MD simulations by means of a harmonic potential characterized by a spring constant of 1.0 kJ/mol Å-2. The O-H bonds are treated with the same harmonic constraint of F. All the other kaolinite atoms are unrestrained. Note that we have chosen to restrain the silicon atoms at the bottom of the KAOOH slab just in order to mimic the presence of additional kaolinite slabs below. In contrast to what has been reported in Ref. 35, we have been able to simulate a completely unrestrained slab without observing the disruption of the system. The FH case corresponds instead to the same setup as F, with the difference that the dynamics of oxygen atoms of the hydroxyl groups is constrained via an harmonic potential characterized by a spring constant of 1.0 kJ/mol Å-2, consistent with the ”free-OH” setup described in Ref. 35. As we have discussed in the main text, such restraint is rather mild, and does not prevent surface relaxation to take place.
IV Order Parameter
In order to locate and characterize ice nuclei within our MD simulations, we have employed the following order parameter : we start by labeling as ice-like any water molecule whose oxygen atom displays a value of 0.45, where is constructed as follows: we first select only those oxygens which are hydrogen-bonded to four other oxygens. For each of the th atoms of this subset , we calculate the local order parameter:
| (5) |
where is a switching function tuned so that =1 when atom lies within the first coordination shell of atom and which is zero otherwise. is the Steinhardt vector Steinhardt, Nelson, and Ronchetti (1983)
| (6) |
being one of the 6th order spherical harmonics. We have used 3.2 Å as the cutoff for to be consistent with Ref. 60. Notice that by selecting oxygen atoms within the subset exclusively we ensure that the hydrogen bond network within the ice nuclei is reasonable. Having identified a set of ice-like water molecules, we pinpoint all the connected clusters of oxygen atoms which: i) belong to the subset; ii) have a value of 0.45 and; iii) are separated by a distance 3.2 Å. We then select the largest of these clusters (i.e. the one containing the largest number of oxygen atoms or equivalently water molecules). The final step is to find all the surface molecules that are connected to this cluster, as this procedure allows us to account for the diffuse interface between the solid and the liquid. Surface molecules are defined as the water molecules that lie within 3.2 Å of the molecules in the cluster. The final order parameter used in this work is thus the number of water molecules within the largest ice-like cluster plus the number of surface molecules. This approach allow us to account for ice-like atoms sitting directly on top of the kaolinite surface, which are never labeled as ice-like (and which would thus never be included into the ice nuclei) because they are under coordinated and because they display a different symmetry to the molecules within bulk water (which in turn leads to different values of ).
As discussed in the main text, our seeded MD simulations allowed a very crude estimate of the critical nucleus size which is consistent with our forward flux sampling (FFS) simulations Sosso et al. (2016b). The comparison between our numbers ( 250 and 225 25 water molecules as obtained by seeded MD and FFS simulations respectively) and the critical nucleus size for the homogeneous case at the same supercooling (and the same water model) reported in Ref. 60 requires exactly the same order parameter to be used. In particular, the order parameter used in Ref. 60 differs with respect to our formulation of (see Sec. IV) in that (i) a slightly stricter criterion has been used to label molecules as ice-like, namely 0.5 to be compared with our choice of 0.45; and (ii) surface molecules are not included in the largest ice-like nucleus. This means that in order to compare quantitatively our results in terms of e.g. the size of the critical nucleus, the average number of surface molecules for a nucleus of a given size has to be added to the value of reported in Ref. 60, resulting in an estimate of the homogeneous critical nucleus size of 540 water molecules.
Finally, we note that in order to discriminate between ice-like molecules belonging to either the cubic of the hexagonal polytype, we have employed the same approach outlined above but for the fact that we have used 3rd (instead of 6th) order spherical harmonics. The values of the resulting order parameter can then be used Li et al. (2011) to label and molecules according to -0.85 and -0.85 -0.70.
V Structural relaxation time at the water-kaolinite interface
The dynamics of the water-KAOOH interface can be characterized by computing the structural relaxation time of the water network similarly to what we have done for bulk water (see Sec. I). However, such a calculation presents two challenges:
-
•
The water-KAOOH interface is a non-homogeneous system. As such, we need a different formulation for the intermediate scattering function. To this end, we have adopted the approach described in the excellent work of Haji-Akbari and Debenedetti Haji-Akbari and Debenedetti (2014): the system is partitioned in slices along the normal to the substrate, and the dynamical quantities of interest are computed within each of these regions taking into account the contributions of molecules that are found within each slice at the beginning and at the end of the time window considered (see Eq.13 in Ref. 68). In this way, the relaxation time discussed in Sec. I becomes a function of the distance from the substrate , so that we can probe the water dynamics in different region of the water-kaolinite interface.
-
•
Dynamical quantities typically require much more statistics than structural ones to obtain converged results. In particular, we are interested in equilibrium averages, so that we have to be sure that we are computing properties within a timescale where the -metastable - liquid can be considered in equilibrium conditions. Thus, we here face an issue when dealing with the S1 interface: in this case, the onset of crystallization takes place within 50-100 ns, and while we have verified that structural properties can be converged within that time window, the same does not hold for quantities such as the structural relaxation time
In Fig. 3 we report the relaxation time of the water network as a function of the distance from the kaolinite surface for S2 and S3. Water dynamics is slower for S2 (and qualitatively for S1 as well, albeit we could not obtain converged results), as the frozen surface interacts more strongly with the water molecules with respect to S3 at least within the first over layer (light blue region in Fig. 3), consistently with early findings for Lennard-Jones interfaces Haji-Akbari and Debenedetti (2014). The relaxation times are very similar for S2 and S3 within the second over layer, albeit they converge to a different value within the bulk of the water film. This is due the different computational geometry: in S2 the water film is sandwiched between two kaolinite slab, while for S3 the presence of the water-vacuum interface affect substantially the dynamics of the system starting from 20Å. Note that despite these differences, the free energy cost needed to create a templating hexagonal patch of water molecules within the first water over layer is very similar for S2 and S3 (see main text). Moreover, the absence of nucleation events on the same timescale for both of these two interfaces suggest the that the dynamics of the interface is far less relevant than its structure in affecting ice formation.
VI Nucleation or structural relaxation?

In the main text we have discussed ice formation at the S1 interface, where all the kaolinite atoms, but for the hydrogens of the hydroxyl groups, are kept frozen during the MD simulations at the experimental positions of bulk kaolinite. In this case, we have observed ice formation at the water-kaolinite interface within 100 ns for each of the ten independent MD runs we have performed.
We have determined the onset time of ”nucleation” by fitting the time evolution of the order parameter described in Sec. IV with the following expression:
| (7) |
where , and are fitting parameters. The survival probability of the liquid can then be constructed from the distribution of as:
| (8) |
where the sum runs over the MD simulations we have performed and is a Heaviside step function. The obtained for S1 is reported in Fig. 4 together with the fitting of the data points with respect to the following expression:
| (9) |
where is the nucleation rate and is a parameter accounting for non-exponential kinetics. For a proper nucleation process, =1, which is consistent with a distribution of nucleation times following a Poisson distribution due to the stochastic nature of the nucleation events. Deviation from the ideal value of can be observed in many cases even experimentally, as nicely discussed in Ref, 106. However, we have shown in Ref. 18 that values of 1 are often observed in atomistic simulations when nucleation times are of the same order of the relaxation time of the parent phase (in this case, the supercooled water network). This is exactly the situation we observe in here: we obtain =8, spectacularly different from the value of 1 expected, as are of the same order of the time scale needed for S1 to create a complete hexagonal motif of water molecules within the first over layer, thus triggering ice formation in a non-stochastic fashion. As such, we argue that S1 is unstable with respect to the formation of the hexagonal templating over layer, and thus with respect to the formation of ice itself.
VII Metadynamics simulations
Metadynamics simulations have been performed using the PLUMED metadynamics plugin interfaced with the GROMACS MD package. The best choice in terms of the collective variable (CV) is probably the order parameter we have discussed in Sec. IV. This approach is now possible thanks to recent computational advancements tri capable of dealing with clusters of particles as CVs. However, this option is unfeasible here due to the very large (106) number of water molecules we have to take into account. In fact, the forces acting on the atoms due to the metadynamics bias are computed as the analytic derivatives of the CV with respect to the atomic positions: unfortunately, this calculation is still exceedingly computationally expensive in the case of when dealing with systems containing more than 102 particles. Thus, we have used as CV the mean value of (described in Eq. 5), that is the value of averaged over all the water molecules of interest.
However, considering all the water molecules in the system ( 6000) is still too costly from a computational point of view. Thus, we have chosen to take into account at each metadynamics setup only those water molecules within a spherical region or radius 16.0 Å centered on a dummy, fixed atom, as depicted in Fig. 5. In addition, in order to (i) avoid the contribution of those water molecules on top of the kaolinite, which values will be ill-defined because of the different coordination and topology and (ii) ensure that water molecules are free to re-arrange themselves as they see fit at the water-kaolinite interface, we have excluded from the above mentioned spherical region those water molecules within the first over layer on the surface, as illustrated in Fig. 5. By means of this strategy we reduce the number of molecules for which we have to calculate the expensive derivatives of the CV from 103 to to , and we drive explicitly nucleation events within a spherical cap on the surface, consistent with the prescription of classical nucleation theory. The expression for the CV we have used thus reads:
| (10) |
where the sum runs over the atoms within the spherical cap described in Fig. 5. This CV is 0 and 1 for a perfectly disordered and network respectively. See Ref. 105 for the distribution of the local order parameter as obtained for supercooled water and ice.
The dynamics of the water network at the strong supercooling =42 K considered is very slow. Thus, in order to observe transitions from liquid water to ice and viceversa, as required to converge the resulting free energy surface, we have been forced to drive nucleation events quite harshly: specifically, we have chosen Gaussians with width equal to of the extent of the natural fluctuations of the CV. The initial height of the Gaussians was 10 , which decays in time according to the well-tempered metadynamics framework Barducci, Bussi, and Parrinello (2008) with a bias factor of 200. The bias was applied every 2000 MD steps, corresponding to 4 ps in terms of simulation time. We have also restrained the value of the CV to be 0.1, in order to avoid non-relevant regions of the liquid basin. As a result, the free energy profiles we have obtained for S1 and S3 are converged within 0.4 eV. This level of accuracy prevents us to draw conclusions about the thermodynamics of nucleation, but it is enough to provide a qualitative picture in terms of the different polytypes involved, as illustrated in Fig. 5 in the main text. There, we report free energy surfaces as a function of the number of water molecules in the largest nucleus of and . These results have been obtained by re-weighting the free energy profiles in terms of the original CV as detailed in Ref. 109.
The resulting free energy surfaces in terms of the number of water molecules within the largest cluster of hexagonal and cubic ice ( and ) are shown in Fig. 5. In the case of S1, creating a nucleus of hexagonal ice containing as many as 250 water molecules is a barrier less process, consistent with what we have observed in the unbiased MD simulations. In contrast, for S3 we observe the exclusive occurrence of the cubic polytype, which forms when the system overcomes a well-defined free energy barrier. Thus, one could think that structural relaxation can promote the formation of different ice polytypes on the very same surface. However, this is not the case, as the formation of cubic ice for S3 leads to nuclei which do not proceed toward further crystallization. The shape of the nuclei as obtained by metadynamics simulations already suggests that the basal plane of is not favored to be in contact with the clay. In fact, as depicted in Fig. 5 nuclei tend no to wet the kaolinite surface, as opposite to what we have observed for nuclei on the S1 surface, where the prism face of easily spread on the clay.
We remark that using a different CV (taking into account instead of , that is, using a different angular momentum channel for the spherical harmonics) resulted in the same outcome. Thus, it is very much possible that there is still room for improvement in terms of order parameters to drive crystal nucleation at complex interfaces.
References
- Bartels-Rausch (2013) T. Bartels-Rausch, Nature 494, 27 (2013).
- Tang, Cziczo, and Grassian (2016) M. Tang, D. J. Cziczo, and V. H. Grassian, Chem. Rev. 116, 4205 (2016).
- Bartels-Rausch et al. (2012) T. Bartels-Rausch, V. Bergeron, J. H. E. Cartwright, R. Escribano, J. L. Finney, H. Grothe, P. J. Gutiérrez, J. Haapala, W. F. Kuhs, J. B. C. Pettersson, S. D. Price, C. I. Sainz-Díaz, D. J. Stokes, G. Strazzulla, E. S. Thomson, H. Trinks, and N. Uras-Aytemiz, Rev. Mod. Phys. 84, 885 (2012).
- Tam et al. (2009) R. Y. Tam, C. N. Rowley, I. Petrov, T. Zhang, N. A. Afagh, T. K. Woo, and R. N. Ben, J. Am. Chem. Soc. 131, 15745 (2009).
- Sellberg et al. (2014) J. A. Sellberg, C. Huang, T. A. McQueen, N. D. Loh, H. Laksmono, D. Schlesinger, R. G. Sierra, D. Nordlund, C. Y. Hampton, D. Starodub, D. P. DePonte, M. Beye, C. Chen, A. V. Martin, A. Barty, K. T. Wikfeldt, T. M. Weiss, C. Caronna, J. Feldkamp, L. B. Skinner, M. M. Seibert, M. Messerschmidt, G. J. Williams, S. Boutet, L. G. M. Pettersson, M. J. Bogan, and A. Nilsson, Nature 510, 381 (2014).
- Martin (1981) S. Martin, Ann. Rev. of Flu. Mech. 13, 379 (1981).
- Leppäranta (2015) M. Leppäranta, Freezing of lakes and the evolution of their ice cover (Heidelberg : Springer, 2015).
- Welch and Davis (1980) S. Welch, R.M.; Cox and J. Davis, Solar Radiation and Clouds (Boston : American Meteorological Society, 1980).
- Yang et al. (2014) P. Yang, K.-N. Liou, L. Bi, C. Liu, B. Yi, and B. A. Baum, Adv. Atmos. Sci. 32, 32 (2014).
- Murray et al. (2012) B. J. Murray, D. O’Sullivan, J. D. Atkinson, and M. E. Webb, Chem. Soc. Rev. 41, 6519 (2012).
- Slater et al. (2015) B. Slater, A. Michaelides, C. G. Salzmann, and U. Lohmann, Bull. Amer. Meteor. Soc. (2015), 10.1175/BAMS-D-15-00131.1.
- Murray et al. (2010) B. J. Murray, T. W. Wilson, S. Dobbie, Z. Cui, S. M. R. K. Al-Jumur, O. Möhler, M. Schnaiter, R. Wagner, S. Benz, M. Niemand, H. Saathoff, V. Ebert, S. Wagner, and B. Kärcher, Nat. Geosci. 3, 233 (2010).
- Campbell, Meldrum, and Christenson (2015) J. M. Campbell, F. C. Meldrum, and H. K. Christenson, J. Phys. Chem. C 119, 1164 (2015).
- Whale et al. (2015) T. F. Whale, M. Rosillo-Lopez, B. J. Murray, and C. G. Salzmann, J. Phys. Chem. Lett. 6, 3012 (2015).
- Chipot (2007) A. Chipot, C; Pohorille, Free Energy Calculations : Theory and Applications in Chemistry and Biology (Berlin : Springer, 2007).
- Sosso et al. (2016a) G. C. Sosso, J. Chen, S. J. Cox, M. Fitzner, P. Pedevilla, A. Zen, and A. Michaelides, Chem. Rev. 116, 7078 (2016a).
- Molinero and Moore (2009) V. Molinero and E. B. Moore, J. Phys. Chem. 113, 4008 (2009).
- Fitzner et al. (2015) M. Fitzner, G. C. Sosso, S. J. Cox, and A. Michaelides, J. Am. Chem. Soc. 137, 13658 (2015).
- Lupi and Molinero (2014) L. Lupi and V. Molinero, J. Phys. Chem. A 118, 7330 (2014).
- Lupi, Hudait, and Molinero (2014) L. Lupi, A. Hudait, and V. Molinero, J. Am. Chem. Soc. 136, 3156 (2014).
- Cabriolu and Li (2015) R. Cabriolu and T. Li, Phys. Rev. E 91, 052402 (2015).
- Lupi, Peters, and Molinero (2016) L. Lupi, B. Peters, and V. Molinero, J. Chem. Phys. 145, 211910 (2016).
- Bi, Cabriolu, and Li (2016) Y. Bi, R. Cabriolu, and T. Li, J. Phys. Chem. C 120, 1507 (2016).
- Yan and Patey (2011a) J. Y. Yan and G. N. Patey, J. Phys. Chem. Lett. 2, 2555 (2011a).
- Yan and Patey (2013a) J. Y. Yan and G. N. Patey, J. Chem. Phys. 139, 144501 (2013a).
- Zielke, Bertram, and Patey (2014) S. A. Zielke, A. K. Bertram, and G. N. Patey, J. Phys. Chem. B 119, 9049 (2014).
- Cox et al. (2014) S. J. Cox, Z. Raza, S. M. Kathmann, B. Slater, and A. Michaelides, Farad. Discuss. 167, 389 (2014).
- Sosso et al. (2016b) G. C. Sosso, T. Li, D. Donadio, G. A. Tribello, and A. Michaelides, J. Phys. Chem. Lett. 7, 2350 (2016b).
- Murray et al. (2011) B. J. Murray, S. L. Broadley, T. W. Wilson, J. D. Atkinson, and R. H. Wills, Atmos. Chem. Phys. 11, 4191 (2011).
- Tobo et al. (2012) Y. Tobo, P. J. DeMott, M. Raddatz, D. Niedermeier, S. Hartmann, S. M. Kreidenweis, F. Stratmann, and H. Wex, Geophys. Res. Lett. 39, L19803 (2012).
- Welti et al. (2013) A. Welti, Z. A. Kanji, F. Lüöd, O. Stetzer, and U. Lohmann, J. Atmos. Sci. 71, 16 (2013).
- Wex et al. (2014) H. Wex, P. J. DeMott, Y. Tobo, S. Hartmann, M. Rösch, T. Clauss, L. Tomsche, D. Niedermeier, and F. Stratmann, Atmos. Chem. Phys. 14, 5529 (2014).
- Hu and Michaelides (2010) X. L. Hu and A. Michaelides, Surf. Sci. 604, 111 (2010).
- Tunega, Gerzabek, and Lischka (2004) D. Tunega, M. H. Gerzabek, and H. Lischka, J. Phys. Chem. B 108, 5930 (2004).
- Zielke, Bertram, and Patey (2016) S. A. Zielke, A. K. Bertram, and G. N. Patey, J. Phys. Chem. B 120, 1726 (2016).
- Allen, Valeriani, and Rein ten Wolde (2009) R. J. Allen, C. Valeriani, and P. Rein ten Wolde, J. Phys. Cond. Matt. 21, 463102 (2009).
- Li, Donadio, and Galli (2013) T. Li, D. Donadio, and G. Galli, Nat. Comm. 4, 1887 (2013).
- Bi and Li (2014) Y. Bi and T. Li, J. Phys. Chem. B 118, 13324 (2014).
- Gianetti et al. (2016) M. M. Gianetti, A. Haji-Akbari, M. P. Longinotti, and P. G. Debenedetti, Phys. Chem. Chem. Phys. 18, 4102 (2016).
- Van Der Spoel et al. (2005) D. Van Der Spoel, E. Lindahl, B. Hess, G. Groenhof, A. E. Mark, and H. J. C. Berendsen, J. Comp. Chem. 26, 1701 (2005).
- Cygan, Liang, and Kalinichev (2004) R. T. Cygan, J.-J. Liang, and A. G. Kalinichev, J. Phys. Chem. B 108, 1255 (2004).
- Abascal et al. (2005) J. L. F. Abascal, E. Sanz, R. G. Fernandez, and C. Vega, J. Chem. Phys. 122, 234511 (2005).
- Lorentz (1881) H. A. Lorentz, Ann. der Physik 248, 127 (1881).
- Berthelot and Hebd (1898) D. Berthelot and C. R. Hebd, Seanc. Acad. Sci. 126, 1703 (1898).
- Note (1) Specifically, the adsorption energy of a single water molecule on top of the hydroxylated (001) surface of kaolinite (calculated as where , and are the total energy of a kaolinite slab with a water molecule on top, the energy of the slab alone and the energy of the water molecule in vacuum respectively) on its most favorable adsorption site is -646 60 meV, in excellent agreement with the quantum Monte Carlo result of -648 18 meV AND .
- Bussi, Donadio, and Parrinello (2007) G. Bussi, D. Donadio, and M. Parrinello, J. Chem. Phys. 126, 014101 (2007).
- Miyamoto and Kollman (1992) S. Miyamoto and P. A. Kollman, J. Comp. Chem. 13, 952 (1992).
- Hess et al. (1997) B. Hess, H. Bekker, H. J. C. Berendsen, and J. G. E. M. Fraaije, J. Comp. Chem. 18, 1463 (1997).
- Moore and Molinero (2011) E. B. Moore and V. Molinero, Phys. Chem. Chem. Phys. 13, 20008 (2011).
- Hansen et al. (2008) T. C. Hansen, M. M. Koza, P. Lindner, and W. F. Kuhs, J. Phys. Cond. Matt. 20, 285105 (2008).
- Malkin et al. (2014) T. L. Malkin, B. J. Murray, C. G. Salzmann, V. Molinero, S. J. Pickering, and T. F. Whale, Phys. Chem. Chem. Phys. 17, 60 (2014).
- Slater and Quigley (2014) B. Slater and D. Quigley, Nat. Mat. 13, 670 (2014).
- Quigley (2014) D. Quigley, J. Chem. Phys. 141, 121101 (2014).
- Sanz et al. (2013) E. Sanz, C. Vega, J. R. Espinosa, R. Caballero-Bernal, J. L. F. Abascal, and C. Valeriani, J. Am. Chem. Soc. 135, 15008 (2013).
- Espinosa et al. (2014) J. R. Espinosa, E. Sanz, C. Valeriani, and C. Vega, J. Chem. Phys. 141, 18C529 (2014).
- Espinosa et al. (2016) J. R. Espinosa, C. Vega, C. Valeriani, and E. Sanz, J. Chem. Phys. 144, 034501 (2016).
- Laio and Parrinello (2002) A. Laio and M. Parrinello, Proc. Natl. Acad. Sci. U.S.A. 99, 12562 (2002).
- Laio and Gervasio (2008) A. Laio and F. L. Gervasio, Rep. Prog. Phys. 71, 126601 (2008).
- Steinhardt, Nelson, and Ronchetti (1983) P. J. Steinhardt, D. R. Nelson, and M. Ronchetti, Phys. Rev. B 28, 784 (1983).
- Haji-Akbari and Debenedetti (2015) A. Haji-Akbari and P. G. Debenedetti, Proc. Natl. Acad. Sci. U.S.A. 112, 10582 (2015).
- (61) Water molecules within each nucleus have been labelled as or according to the order parameter illustrated in the SM. We consider a nucleus to be made predominantely of e.g. if the fraction of molecules is at least 1.5 times larger than that of . We have also verified that by using a topological criterion Haji-Akbari and Debenedetti (2015) for identifying the building blocks of and the probability densities reported in Fig. 3 remain basically unchanged.
- Klimeš, Bowler, and Michaelides (2010) J. Klimeš, D. R. Bowler, and A. Michaelides, J. Phys. Cond. Mat. 22, 022201 (2010).
- Pruppacher and Klett (1997) H. R. Pruppacher and J. D. Klett, Microphysics Of Clouds And Precipitation - Second Revised And Enlarged Edition with an Introduction to Cloud Chemistry and Cloud Electricity (Kluwer Academic Publishers, Dordrecht, The Netherlands, 1997).
- Le Roux and Jund (2010) S. Le Roux and P. Jund, Comp. Mat. Sci. 49, 70 (2010).
- King (1967) S. V. King, Nature 213, 1112 (1967).
- Franzblau (1991) D. S. Franzblau, Phys. Rev. B 44, 4925 (1991).
- (67) The system is obviously in a metastable state. In fact, S1 is even unstable with respect to ice formation on the 100 ns timescale. However, we here seek to compare the different interfaces S1 S2 S3 before the onset of ice formation, where the system can be considered in equilibrium with respect to the computation of the free energy profiles reported in Fig. 4a. This is why we have considered 10 independent simulations for each interface, each 10 ns long, in order to ensure a meaningful equilibrium statistics.
- Haji-Akbari and Debenedetti (2014) A. Haji-Akbari and P. G. Debenedetti, J. Chem. Phys. 141, 024506 (2014).
- Yan and Patey (2011b) J. Y. Yan and G. N. Patey, J. Phys. Chem. Lett. 2, 2555 (2011b).
- Yan and Patey (2013b) J. Y. Yan and G. N. Patey, J. Chem. Phys. 139, 144501 (2013b).
- Vega, Sanz, and Abascal (2005) C. Vega, E. Sanz, and J. L. F. Abascal, J. Chem. Phys. 122, 114507 (2005).
- Orsi (2014) M. Orsi, Mol. Phys. 112, 1566 (2014).
- Haji-Akbari et al. (2014) A. Haji-Akbari, R. S. DeFever, S. Sarupria, and P. G. Debenedetti, Phys. Chem. Chem. Phys. 16, 25916 (2014).
- Mazza et al. (2006) M. G. Mazza, N. Giovambattista, F. W. Starr, and H. E. Stanley, Phys. Rev. Lett. 96, 057803 (2006).
- Kumar et al. (2007) P. Kumar, S. V. Buldyrev, S. R. Becker, P. H. Poole, F. W. Starr, and H. E. Stanley, Proc. Nat. Acad. Sci. 104, 9575 (2007).
- Liu and Lu (2006) X.-D. Liu and X.-C. Lu, Angew. Chem. Int. Ed. 45, 6300 (2006).
- Haria, Grest, and Lorenz (2013) N. R. Haria, G. S. Grest, and C. D. Lorenz, J. Phys. Chem. C 117, 6096 (2013).
- Hu and Michaelides (2007) X. L. Hu and A. Michaelides, Surf. Sci. 601, 5378 (2007).
- Wang et al. (2005) J. Wang, A. G. Kalinichev, R. J. Kirkpatrick, and R. T. Cygan, J. Phys. Chem. B 109, 15893 (2005).
- Odelius, Bernasconi, and Parrinello (1997) M. Odelius, M. Bernasconi, and M. Parrinello, Phys. Rev. Lett. 78, 2855 (1997).
- Weiss et al. (2011) V. C. Weiss, M. Rullich, C. Köhler, and T. Frauenheim, J. Chem. Phys. 135, 034701 (2011).
- Berthier and Biroli (2011) L. Berthier and G. Biroli, Rev. Mod. Phys. 83, 587 (2011).
- Sosso et al. (2014) G. C. Sosso, J. Colombo, J. Behler, E. Del Gado, and M. Bernasconi, J. Phys. Chem. B 118, 13621 (2014).
- Makov and Payne (1995) G. Makov and M. C. Payne, Phys. Rev. B 51, 4014 (1995).
- Neugebauer and Scheffler (1992) J. Neugebauer and M. Scheffler, Phys. Rev. B 42, 16967 (1992).
- Perdew, Burke, and Ernzerhof (1996) J. P. Perdew, K. Burke, and M. Ernzerhof, Phys. Rev. Lett. 77, 3865 (1996).
- Perdew, Burke, and Ernzerhof (1997) J. P. Perdew, K. Burke, and M. Ernzerhof, Phys. Rev. Lett. 78, 1396 (1997).
- Hammer, Hansen, and Nørskov (1999) B. Hammer, L. B. Hansen, and J. K. Nørskov, Phys. Rev. B 59, 7413 (1999).
- Grimme (2006) S. Grimme, J. Comp. Chem. 27, 1787 (2006).
- Grimme et al. (2010) S. Grimme, J. Antony, S. Ehrlich, and H. Krieg, J. Chem. Phys. 132, 154104 (2010).
- Tkatchenko and Scheffler (2009) A. Tkatchenko and M. Scheffler, Phys. Rev. Lett. 102, 073005 (2009).
- Lee et al. (2010) K. Lee, E. D. Murray, L. Kong, B. I. Lundqvist, and D. C. Langreth, Phys. Rev. B 82, 081101 (2010).
- Zhang and Yang (1998) Y. Zhang and W. Yang, Phys. Rev. Lett. 80, 890 (1998).
- Dion et al. (2004) M. Dion, H. Rydberg, E. Schroder, D. C. Langreth, and B. I. Lundqvist, Phys. Rev. Lett. 92, 246401 (2004).
- Klimeš, Bowler, and Michaelides (2011) J. Klimeš, D. R. Bowler, and A. Michaelides, Phys. Rev. B 83, 195131 (2011).
- Kresse and Hafner (1993) G. Kresse and J. Hafner, Phys. Rev. B 558, 47 (1993).
- Kresse and Hafner (1994) G. Kresse and J. Hafner, Phys. Rev. B 49, 14251 (1994).
- Kresse and Furthmuller (1996a) G. Kresse and J. Furthmuller, Comput. Mat. Sci. 6, 15 (1996a).
- Kresse and Furthmuller (1996b) G. Kresse and J. Furthmuller, Phys. Rev. B 54, 11169 (1996b).
- Román-Pérez and Soler (2009) G. Román-Pérez and J. M. Soler, Phys. Rev. Lett. 103, 096102 (2009).
- Blochl (1994) P. E. Blochl, Phys. Rev. B 50, 17953 (1994).
- Kresse and Joubert (1999) G. Kresse and D. Joubert, Phys. Rev. B 59, 1758 (1999).
- Graziano et al. (2012) G. Graziano, J. Klimeš, F. Fernandez-Alonso, and A. Michaelides, J. Phys. Condens. Matter 24, 424216 (2012).
- Monkhorst and Pack (1976) H. J. Monkhorst and J. D. Pack, Phys. Rev. B 13, 5188 (1976).
- Li et al. (2011) T. Li, D. Donadio, G. Russo, and G. Galli, Phys. Chem. Chem. Phys. 13, 19807 (2011).
- Sear (2014) R. P. Sear, Cryst. Eng. Comm. 16, 6506 (2014).
- (107) G.A. Tribello, F. Giberti, G.C. Sosso, M. Salvalaglio and M. Parrinello: ”Analyzing and Driving Cluster Formation in Atomistic Simulations”, submitted.
- Barducci, Bussi, and Parrinello (2008) A. Barducci, G. Bussi, and M. Parrinello, Phys. Rev. Lett. 100, 020603 (2008).
- Tiwary and Parrinello (2015) P. Tiwary and M. Parrinello, J. Phys. Chem. B 119, 736 (2015).
- (110) A. Zen, L.M. Roch, S.J. Cox, X.L. Hu, S. Sorella, D. Alfè and A. Michaelides. ”Toward Accurate Adsorption Energetics on Clay Surfaces”. (submitted).