Molecular and ionized gas kinematics
in the GC Radio Arc
Abstract
We present NH3 and H64+H63 VLA observations of the Radio Arc region, including the M0.200.033 and G0.100.08 molecular clouds. These observations suggest the two velocity components of M0.200.033 are physically connected in the south. Additional ATCA observations suggest this connection is due to an expanding shell in the molecular gas, with the centroid located near the Quintuplet cluster. The G0.100.08 molecular cloud has little radio continuum, strong molecular emission, and abundant CH3OH masers, similar to a nearby molecular cloud with no star formation: M0.25+0.01. These features detected in G0.100.08 suggest dense molecular gas with no signs of current star formation.
keywords:
Galaxy: center, ISM: clouds, ISM: molecules, masers1 Introduction
Galactic centre (GC) molecular clouds are suggested to follow ‘orbital streams’ that are precessing, connected chains of molecular gas ([Kruijssen et al. (2015), Kruijssen et al. 2015]). [Kruijssen et al. (2015), Kruijssen et al. (2015, and in this volume)] recently proposed an open orbit model that is segmented into four orbital streams. However, modeling these orbital streams is difficult due to several complicated kinematic regions. The complexity of these regions is attributed to multiple streams overlapping along our line of sight ([Kruijssen et al. (2015), Kruijssen et al. 2015]; Figure 4).
The Radio Arc: This region has complex kinematics. The molecular cloud at this location, M0.200.033 ([Serabyn & Guesten(1991), Serabyn & Guesten 1991]), has two velocity components, that are located at 25 & 80 km s-1. [Kruijssen et al. (2015), Kruijssen et al. (2015, and in this volume)] argue that these two components to being on the near side (80 km s-1; stream 1) and far side (25 km s-1; stream 3) of the GC. Adjacent to M0.200.033 is G0.100.08, which is the core of a larger, dense molecular cloud ([Tsuboi et al.(1997), Handa et al. (2006), Tsuboi et al. 1997 Handa et al. 2006]). The orbital model by [Kruijssen et al. (2015), Kruijssen et al. (2015, and in this volume)] suggests that this cloud is near pericentre on the near side of the GC (stream 1).
2 Observations
We recently conducted sensitive continuum and spectral line observations with the VLA (NH3, CH3OH, H64 and H63), of M0.200.033 and G0.100.08, and present the results here. We compare these results with lower resolution ATCA data (NH3) from Ott et al. (in this volume). These observations will be used to analyze the kinematic properties of the molecular gas (as traced by the NH3 (3,3) transition, hereafter ‘molecular gas’) and ionized gas (as traced by the combined H64+H63 transitions, hereafter ‘ionized gas’).
3 Results and Discussion

Connection between ionized and molecular gas in M0.20-0.033: Our VLA observations also show two components in the molecular gas. Figure 1 (right) shows the distribution of molecular gas relative to the 24.5 GHz continuum emission. The spectral distribution of molecular and ionized gas for three selected regions (labeled AC) are shown in Figure 1 (left). In all three regions, only one ionized gas component is detected. This ionized gas component shows a strong correlation with the 25 km s-1 component at position (B). The two northern regions (A & B) show two molecular components separated in velocity space. The most southern region (C) has a third molecular component, located at intermediate velocities (50 km s-1). The presence of molecular emission at these intermediate velocities suggests that the 25 & 80 km s-1 components in M0.200.033 are physically connected in the south via this third velocity component.
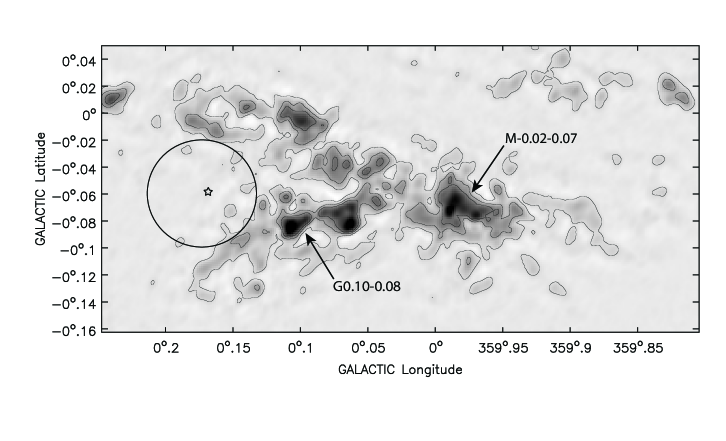
Expanding shell in molecular gas: In order to confirm the connection between the two components in the southern region of M0.200.033 we examined ATCA data from the SWAG survey. These observations reveal a cavity in the molecular emission that is open on the eastern side (Figure 2). This cavity can be fit with a circle (hereafter, shell; Figure 2), that is centered at R.A.=17h46m17.3s, dec=-28∘49′00′′, with a radius r=150′′(6pc). An expanding shell produces an elliptical distribution in position-velocity space, because the near side of the shell is blueshifted and the far side of the shell is redshifted. Our position-velocity analysis, using the ATCA data, suggests an expanding shell that has an expansion velocity of 40 km s-1, with a central velocity of 51 km s-1. The position-velocity distribution indicates that the 25 km s-1 component (blueshifted emission) is on the near side of the shell and the 80 km s-1 component (redshifted emission) is on the far side of the shell. HI absorption observations towards this region support such an arrangement ([Lang et al. (2010), Lang et al. 2010]). The central velocity of the shell at 51 km s-1 suggests that the shell is located on stream 1 (near side of the GC; [Kruijssen et al. (2015), Kruijssen et al. 2015]).
Connection to Quintuplet cluster: The massive stellar Quintuplet cluster ([Schneider et al. (2014), 1050.9 photons s-1, =4.81.1 Myr; Figer et al. 1999, Schneider et al. 2014]), is located adjacent to M0.200.033. The powerful Quintuplet cluster is capable of ionizing the surrounding ISM, producing the Sickle HII region ([Lang et al. (1997), Lang et al. 1997]). The center of the expanding shell is located near (30′′ in projection) the Quintuplet cluster (star on Figure 2), suggesting that the shell may be produced by the Quintuplet cluster.
The [Kruijssen et al. (2015), Kruijssen et al. (2015)] orbital model suggests that the Quintuplet cluster is located on stream 1. As M0.200.033 is also suggested to be located on stream 1, the close proximity of the cluster and cloud indicates a possible interaction, as shown by the Sickle HII region. Since our expanding shell has an estimated age of 1.5105 yr, assuming a constant expansion rate, this suggests that the interaction between the cluster and the cloud is relatively recent.
G0.100.08: Another Brick? The VLA observations of G0.100.08 indicate that this molecular cloud has several interesting features:
Weak Radio Continuum: G0.100.08 has very little radio continuum at 24.5 GHz and no detected ionized gas emission. There is a very faint filamentary streak at 24.5 GHz, near the right edge of the cloud (R.A.=17h46m07s, dec=28∘53′20′′), that is the only emission detected above 5. This lack of radio continuum and ionized gas would suggest no embedded star formation in G0.100.08. Since there is, however, slight external ionization near the right edge of the cloud, this would suggest ionization from an outside source.
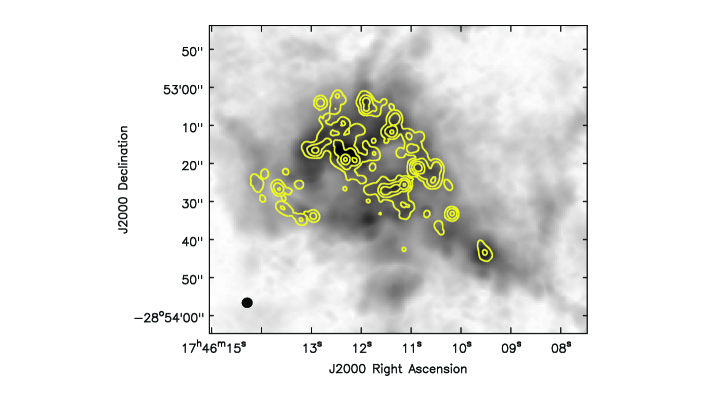
Bright NH3 emission: The molecular emission in G0.100.08 is bright, compared to M0.200.033. Figure 3 (greyscale) shows the distribution of the molecular emission, which is abundant throughout the cloud. There are several bright, compact knots of molecular emission distributed throughout G0.100.08. The morphology of these compact knots of emission is similar to those detected in M0.25+0.01 ([Mills et al. (2015), Mills et al. 2015]).
Kinematics: The molecular gas in G0.100.08 ranges from 3070 km s-1, and peaks in intensity at 55 km s-1. The velocity distribution shows a slight gradient (10 km s-1 pc-1), in the direction of positive galactic latitude. This gradient is consistent with other GC molecular clouds.
Abundant CH3OH masers: We have detected 64 compact 36 GHz CH3OH sources (hereafter, CH3OH masers) that have a brightness temperatures above 400 K ([Mills et al. (2015), Mills et al. 2015; Butterfield et al. 2016, in prep]). These CH3OH masers follow the molecular gas emission fairly well (Figure 3). The CH3OH masers in G0.100.08 are clustered towards the center of the cloud, where the molecular emission is the strongest. The clustering of CH3OH masers detected in G0.100.08 is similar to the ‘bar’ of masers seen in the southern region of M0.25+0.01 ([Mills et al. (2015), Mills et al. 2015]). The 36 GHz CH3OH maser is a class I maser and therefore is a known shock tracer. Thus, the particularly high abundance of CH3OH masers suggest shocked gas towards the core of G0.100.08.
Our VLA study suggests that G0.100.08 is a dense, compact molecular cloud that shows no signs of current star formation. The molecular characteristics of G0.100.08 are similar to those seen in M0.25+0.01 ([Mills et al. (2015), also known as the ‘Brick’; Mills et al. 2015]). M0.25+0.01 is also suggested to be a quiescent, dense molecular cloud that is not currently forming stars ([Longmore et al. (2012), Mills et al. (2015), Longmore et al. 2012; Mills et al. 2015]).
References
- [Figer et al.(1999)] Figer, D. F., McLean, I. S., & Morris, M. 1999, ApJ, 514, 202
- [Handa et al. (2006)] Handa, T., Sakano, M., Naito, S., Hiramatsu, M., & Tsuboi, M. 2006, ApJ, 636, 261
- [Kruijssen et al. (2015)] Kruijssen, J. M. D., Dale, J. E., & Longmore, S. N. 2015, MNRAS, 447, 1059
- [Lang et al. (1997)] Lang, C. C., Goss, W. M., & Wood, O. S. 1997, ApJ, 474, 275
- [Lang et al. (2010)] Lang, C. C., Goss, W. M., Cyganowski, C., & Clubb, K. I. 2010, ApJS, 191, 275
- [Longmore et al. (2012)] Longmore, S. N., Rathborne, J., Bastian, N., et al. 2012, ApJ, 746, 117
- [Mills et al. (2015)] Mills, E. A. C., Butterfield, N., Ludovici, D. A., et al. 2015, ApJ, 805, 72
- [Schneider et al. (2014)] Schneider, F. R. N., Izzard, R. G., de Mink, S. E., et al. 2014, ApJ, 780, 117
- [Serabyn & Guesten(1991)] Serabyn, E., & Guesten, R. 1991, A&A, 242, 376
- [Tsuboi et al.(1997)] Tsuboi, M., Ukita, N., & Handa, T. 1997, ApJ, 481, 263