The information content of stellar halos: Stellar population gradients and accretion histories in early-type Illustris galaxies
Abstract
Long dynamical timescales in the outskirts of galaxies preserve the information content of their accretion histories, for example in the form of stellar population gradients. We present a detailed analysis of the stellar halo properties of a statistically representative sample of early-type galaxies from the Illustris simulation and show that stellar population gradients at large radii can indeed be used to infer basic properties of galactic accretion histories. We measure metallicity, age, and surface-brightness profiles in quiescent Illustris galaxies ranging from and show that they are in reasonable agreement with observations. At fixed mass, galaxies that accreted little of their stellar halo material tend to have steeper metallicity and surface-brightness profiles between effective radii () than those with larger accreted fractions. Profiles of metallicity and surface-brightness in the stellar halo typically flatten from to the present. This suggests that the accretion of stars into the stellar halo tends to flatten metallicity and surface-brightness profiles, a picture which is supported by the tight correlation between the two gradients in the stellar halo. We find no statistical evidence of additional information content related to accretion histories in stellar halo metallicity profiles beyond what is contained in surface-brightness profiles. Age gradients in the stellar halo do not appear to be sensitive to galactic accretion histories, and none of the stellar population gradients studied are strongly correlated with the mean merger mass-ratio. Future observations that reach large radii outside galaxies will have the best potential to constrain galactic accretion histories.
1 Introduction
The CDM model of cosmology makes strong predictions regarding the expansion of the universe and the hierarchical growth of structure on large scales that have been supported by numerous observations (Smoot et al., 1992; Eisenstein et al., 2005; Hinshaw et al., 2013), but the formation and evolution of galaxies remain poorly understood (see reviews in Conselice, 2014; Somerville & Davé, 2015). In particular, the assembly history of early-type galaxies (ETGs) represents a major unsolved problem: how did the red-and-dead, elliptical galaxies we see today form, and what processes drove their evolution from early times (see reviews in Renzini, 2006; Kormendy et al., 2009; Cappellari, 2016)?
Early-type galaxies host predominantly old populations of stars that are thought to have formed on short timescales () (e.g., Worthey, 1994; Trager et al., 2000; Thomas et al., 2005; Conroy et al., 2014). In some respects these observations offer support for the classic monolithic-like collapse scenario (e.g., Eggen et al., 1962; Partridge & Peebles, 1967; Larson, 1975; Carlberg, 1984) that quiescent galaxies formed at high redshifts from the gravitational collapse of massive primordial gas clouds resulting in brief, intense bursts of star formation that were quickly quenched. However, it is now generally accepted that galaxies form through a combination of two complementary mechanisms: the in-situ formation of new stars, and the accretion of ex-situ stars via mergers (e.g., Kobayashi, 2004; Oser et al., 2010; Pillepich et al., 2015; Rodriguez-Gomez et al., 2016).
These two formation channels can, for example, help explain the dramatic size evolution of massive early-type galaxies: extremely compact “red nuggets” are found at that are factors of times smaller than ETGs of similar masses (e.g., Daddi et al., 2005; Trujillo et al., 2006, 2007; van Dokkum et al., 2008). Since then, these galaxies grew largely through accretion of material in their outskirts (van Dokkum et al., 2010; van der Wel et al., 2014; Wellons et al., 2016a). The accumulated light at large radii around ETGs should thus contain important information about their accretion histories.
In-situ and ex-situ formation are also predicted to leave different signatures in the radial gradients of stellar populations (metallicity, age, abundance ratios) within early-type galaxies. When stars form in-situ, the lower gas densities in the outskirts of galaxies will result in lower star formation rates, producing fewer, less metal-enriched stars than the galaxy interiors. This effect is enhanced by stellar winds and other feedback mechanisms, which can more efficiently remove metals from the outer galactic regions than from the deep potential wells at the centers (Carlberg, 1984; Kobayashi, 2004). In-situ formation of stars is therefore predicted to imprint steeply negative metallicity and surface-brightness gradients. In contrast, accretion and mergers will deposit significant amounts of tidally-stripped stars into galactic outskirts. Low-mass satellites will tend to bring in more metal-poor stars and be tidally stripped at larger radii than will massive galaxies, such that the resulting effects of this ex-situ growth on metallicity and surface-brightness profiles could depend on the typical merger ratio. In practice, it is believed that the net effect of realistic merger histories tends to flatten both profiles (e.g., Bekki & Shioya, 1999; Di Matteo et al., 2009; Font et al., 2011).
CDM predicts a wide variety of accretion histories due to the stochastic nature of mergers but also predicts systematic trends with mass (Lacey & Cole, 1994). Observations of gradients in stellar properties (including metallicity and surface brightness) offer prospects to distinguish between in-situ and ex-situ mass growth. The information content of mergers should be largely preserved at the present epoch at large radii around galaxies due to long dynamical timescales (e.g., Eggen et al., 1962; Bullock & Johnston, 2005), making galaxy outskirts the ideal regions for probing accretion histories.
Significant progress has been made in observing structures known as stellar halos: diffuse light seen in the outskirts around both early- and late-type galaxies that is believed to be the remnant of this hierarchical accretion. The Milky Way stellar halo has been thoroughly studied through resolved star counts (e.g., Ibata et al., 1994; Helmi et al., 1999; Ivezić et al., 2000; Majewski et al., 2003; Bell et al., 2008) as has that of our neighbor M31 (e.g., Ibata et al., 2001; McConnachie et al., 2009; Gilbert et al., 2014; Gregersen et al., 2015). Both stellar halos contain significant substructure, including streams from satellites that were recently devoured.
Characterizing the stellar halos around more distant galaxies is challenging, but the field is progressing rapidly. Photometry is used to measure the integrated light from stellar halos, either on an individual basis (e.g., Mihos et al., 2005; Martínez-Delgado et al., 2010, 2012; van Dokkum et al., 2014; Duc et al., 2014; Buitrago et al., 2016; Huang et al., 2016) or in stacked images (e.g., Tal & van Dokkum, 2011; La Barbera et al., 2012; D’Souza et al., 2014). Spectroscopic metallicity gradients are beginning to reach large radii (e.g., Sánchez-Blázquez et al., 2007; Foster et al., 2009; Spolaor et al., 2010; Coccato et al., 2010, 2011), a measurement that has been greatly aided by the introduction of multi-object spectrographs (e.g., Pastorello et al., 2014, 2015) and integral-field units (e.g., Kuntschner et al., 2010; Greene et al., 2012, 2015; González Delgado et al., 2015; Oliva-Altamirano et al., 2015), although this remains an expensive measurement, particularly given the low surface-brightnesses and large field-of-view required.
The increasing richness of stellar halo observations necessitates detailed model predictions in order to link the properties of an individual stellar halo to its accretion history. Unfortunately, very high resolution is required to reliably model the diffuse stellar halo regions. One approach to overcoming this barrier is to focus on the gravitational dynamics of particles, either with analytical models for the host galaxy potential (e.g., Johnston et al., 1996; Bullock & Johnston, 2005; Amorisco, 2015, 2016) or using a “particle tagging” technique applied to N-body cosmological simulations (Cooper et al., 2010; Helmi et al., 2011; Lowing et al., 2014). Both approaches make significant simplifying assumptions (see Bailin et al., 2014) but are able to reach very high resolution and explore important dynamical effects in a controlled environment. Hydrodynamical simulations focusing on stellar halos are able to self-consistently grow realistic galaxies and stellar populations, but have previously been restricted to relatively small sample sizes (e.g., Abadi et al., 2006; Tortora et al., 2011; Font et al., 2011; Hirschmann et al., 2015; Cooper et al., 2015; Pillepich et al., 2015) that may not reproduce the large diversity of galactic accretion histories.
In this paper, we present analysis of the stellar population gradients in early-type galaxies from the Illustris hydrodynamical simulation (Vogelsberger et al., 2014a). Illustris is the first cosmological simulation that is simultaneously able to a) probe the wide variety of galactic accretion histories in a CDM cosmology because of its large volume and sample size, b) generate realistic galaxies in this cosmology using a self-consistent galaxy formation model, and c) produce a large statistical sample of well-resolved stellar halos around these galaxies. Previous work by Pillepich et al. (2014) quantified the relation between the stellar mass profile in Illustris stellar halos and the formation history of their underlying dark matter halos, including halo formation time, time from the last major merger, and fraction of stars accreted from infalling satellites and mergers. We expand this analysis to consider the prospects for connecting observable stellar population gradients to the accretion histories of stellar halos and the redshift-evolution of the stellar population profiles. In particular, we investigate whether there is additional information content in stellar halo metallicity and age profiles relative to that retained in the profile of stellar mass (or surface-brightness), as studied in Pillepich et al. (2014).
This work is organized as follows. We begin by describing the details of the Illustris simulation (§2.1) and our sample of quiescent galaxies (§2.2). We then define our methods used to measure stellar population gradients (§2.3) and to quantify accretion histories (§2.4). In §3, we compare the stellar population gradients measured in Illustris ETGs to available observations, present our findings that gradients in the stellar halo are sensitive to the halo’s assembly history, and discuss the redshift-evolution of stellar population profiles. In §4, we discuss our results regarding of the information content retained within stellar halos, and we summarize in §5.
2 Methods
2.1 The Illustris simulation
All analysis in this work is based on galaxies from the Illustris simulation. Detailed descriptions can be found in Vogelsberger et al. (2014a), Vogelsberger et al. (2014b), and Genel et al. (2014). The simulation data has been released to the public (Nelson et al., 2015), and is available online (http://www.illustris-project.org). We summarize the relevant properties of the simulation below.
Illustris is a suite of hydrodynamical cosmological simulations (periodic box, 106.5 Mpc on a side) using the adaptive mesh code Arepo (Springel, 2010) and including runs at multiple resolutions. Its galaxy formation model implements the most important physical processes, including stellar formation and feedback, chemical enrichment, radiative cooling, and feedback from AGN. The most highly-resolved run (Illustris-1, hereafter simply Illustris) has a mass resolution of for dark matter and for the baryonic component. At , gravitational forces for dark matter and baryons are resolved to softening lengths of 1.4 kpc and 0.7 kpc, respectively. The simulations were run from to using cosmological parameters consistent with WMAP9 (; Hinshaw et al., 2013).
Halos and galaxies in Illustris are identified using the Friends-of-Friends (FOF) and Subfind algorithms (Springel et al., 2001; Dolag et al., 2009). Throughout this work, we study the stellar components of central galaxies, which are defined as the most massive Subfind subhalos within a given FOF halo (i.e. not satellites/subhalos of a more massive galaxy). Stellar particles are removed from the central galaxies if they are gravitationally bound to a satellite subhalo.
At , the Illustris volume contains over 40,000 galaxies resolved with at least 500 stellar particles. Illustris has been shown to reproduce basic observational properties including the galaxy stellar mass function and the evolution of cosmic star formation (Genel et al., 2014) as well as a reasonable diversity of morphologies and colors, including early- and late-type galaxies (Torrey et al., 2015; Snyder et al., 2015). The most massive central galaxies reproduced in the simulation have stellar masses (, defined hereafter as the stellar mass within twice the stellar half-mass radius) around . In Pillepich et al. (2014), Illustris galaxies were shown to have well-resolved stellar halos.
There are known issues with Illustris’ galaxy formation model. Due to limitations in the implementation of stellar and AGN feedback, the cosmic star formation rate density is too high at , which may be responsible for quiescent galaxies (the red sequence) being somewhat underrepresented at (Vogelsberger et al., 2014a). The physical sizes of galaxies with stellar masses are found to be too large by factors of a few (Snyder et al., 2015). Additionally, due to a numerical implementation choice, a very small fraction of stellar particles have unrealistically low metallicities (), and were thus removed from our analysis. We direct the reader to Nelson et al. (2015) for more detail on each of these issues, and we discuss the possible impacts on our conclusions in §4.
2.2 A sample of quiescent galaxies and their properties
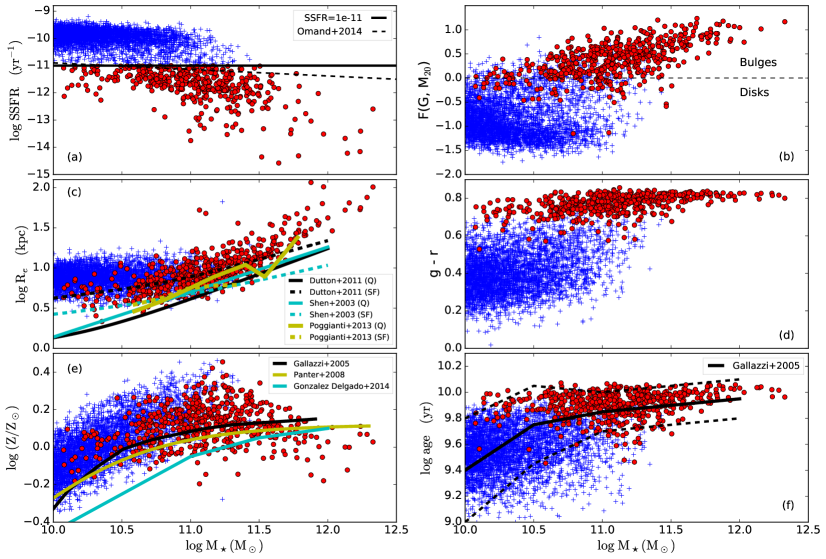
Our sample (summarized in Figure 1) is comprised of Illustris central galaxies with stellar mass at . This selection criterion ensures that there are enough stellar particles to resolve the outskirts of the galaxies (at least 1000 particles beyond ). Of these, we study quiescent galaxies, which we define as having an instantaneous specific star-formation rate (in gas cells within twice the stellar half-mass radius) of . This selects red-and-dead galaxies that are below the star-forming main sequence (SSFR yr-1) and can be compared to observational samples of ETGs.
The final sample includes 537 quiescent galaxies, with stellar masses ranging from to . Most (491) of the galaxies are between ; more-massive galaxies are rare in the Illustris volume, and less-massive galaxies are mostly star-forming. In panel (a) of Figure 1, we show that our “quiescent” selection criterion of is in good agreement with the bimodality observed in SDSS galaxies, as described in Omand et al. (2014).
We measure galaxy sizes using the V-band light profiles, with luminosities calculated via the stellar population synthesis model of Bruzual & Charlot (2003). The positions of each particle are projected against a random line-of-sight (see Appendix A for more details on the important effects of projection) to determine each galaxy’s effective radius , defined as the radius that contains one half the total light.
In panel (b) of Figure 1, we show the distribution of morphologies in the Illustris galaxies, as calculated in Snyder et al. (2015). Morphologies are measured in terms of Gini’s coefficient (G) and M20, two non-parametric measurements of a galaxy’s spatial distribution. Disk- and bulge-dominated galaxies are found to lie in different regions of space (Lotz et al., 2004). The two measurements are combined into a single quantity, the “bulge-statistic” , where () indicates a bulge-dominated (disk-dominated) morphology. For details, consult Snyder et al. (2015). The galaxies in our quiescent sample are nearly all bulge-dominated, and therefore can be compared to observed early-type galaxies.
We compare the sizes of Illustris galaxies to the observations from the Millennium Galaxy Catalogue (Poggianti et al., 2013) and the Sloan Digital Sky Survey (Dutton et al., 2011) in panel (c) of Figure 1. The sizes of low-mass () Illustris galaxies are known to be somewhat larger than expected from observations (Snyder et al., 2015). At the high-mass end (), the galaxies also appear to be slightly too large, an effect that we believe is due to Intracluster Light (ICL). Separation of the ICL from central galaxies is still an open problem without a clear solution or commonly-adopted approach (Bernardi et al., 2013), which complicates comparisons between models and observations. Many ICL stellar particles are included as part of the most massive central galaxies by Subfind and, we attempt no removal of this component, which contributes to the inflated sizes (). In our subsequent analysis, we account for the size discrepancies described here by considering ranges defined by effective radii rather than physical units. Assuming that Illustris galaxies are inflated in an approximately self-similar way – i.e. scaled up by a constant factor, but otherwise matching the structure of observed galaxies – this should prevent the large sizes from biasing our results. Inclusion or removal of the handful of massive galaxies with inflated sizes () do not affect the results that follow, so we choose to include them in the analysis.
We compute the mean g-r colors, as well as V-band weighted mean stellar metallicity () and stellar age of the Illustris galaxies, all measured within . These properties are shown in panels (d), (e), and (f), respectively, of Figure 1. The quiescent galaxies have red colors, as is to be expected from their low star-formation rates. They match reasonably the observed mass-metallicity and mass-age relations. The most massive Illustris galaxies appear slightly too metal-poor, which may be due to the influence of the ICL. The inflated radii could bias low the metallicities measured within because metallicity decreases with radius (see following section).
2.3 Measuring observable gradients
In this paper, we consider the radial profiles of metallicity (), stellar age, V-band surface brightness (), and g-r colors in our sample of quiescent Illustris galaxies. The V-band surface brightness and g-r colors are computed via the stellar population synthesis model of (Bruzual & Charlot, 2003), and assume no dust extinction. The logarithmic gradients we compute are defined as follows:
| (1) | ||||
| (2) | ||||
| (3) | ||||
| (4) |
A negative , , , or therefore represents outskirts that are more metal-poor, younger, less bright, or bluer respectively than the interior.
These stellar population gradients are measured within three radius ranges, which we define as: inner galaxy (), outer galaxy (), and stellar halo (). We note that in §3.3 we also discuss gradients computed farther () into the stellar halo, and find that the information content of the gradients is maximized at large radii. However, we concentrate our analysis on regions within where future observations will be most able to probe.
Within each radius range, we compute the stellar properties in 5 logarithmic bins of radius, and measure a gradient using least-squares fitting. This approach locally models the profiles as power-laws within the chosen radial ranges, and thus the resulting gradients can be considered the average slopes of the logarithmic profiles over the given ranges.
In §3.3, we show that is strongly dependent on the combination of and and that, due to weak correlations between the latter two, there is very little variation in in the stellar halo. Therefore, we do not analyze further.
In order to fairly compare to observations, we incorporate two significant observational effects. All quantities are luminosity-weighted using the V-band magnitude of each star particle, which has significant effects on measured ages. We additionally include projection effects by projecting the positions of all star particles against a random line-of-sight. Ignoring this can introduce significant biases between simulated measurements and observations. For example, geometrical effects cause the projected effective radius of Illustris galaxies to be biased smaller than the 3D radius by around , which matches predictions from the Hernquist (1990) profile. We discuss the influence of projection effects, and the uncertainties introduced into measurements of stellar population gradients from random line-of-sight projections, in Appendix A.

2.4 Quantifying accretion histories
We quantify the accretion histories of the quiescent Illustris galaxies in two ways: the ex-situ fraction () and the mean merger mass-ratio (), both measured within the three radius ranges defined above.
Stars in each system are tagged either as in-situ (formed within their current host galaxy) or ex-situ (formed in a galaxy that subsequently merged with or was stripped by the current phost). More details on this particle classification scheme can be found in Rodriguez-Gomez et al. (2016). The local ex-situ fraction (also called the accreted fraction) is thus the proportion of stellar mass in a given region of a galaxy that was accreted from smaller objects. It characterizes the total influence of all mergers on the evolution of a particular galaxy region.
For each star tagged as ex-situ, we calculate the merger mass-ratio between the host galaxy and the galaxy that brought in the star, measured at the time when the latter reached its maximum stellar mass (see Rodriguez-Gomez et al., 2015). is the average of this ratio over all stars in each of the three radius ranges, and thus characterizes the relative influence of major and minor mergers to the accretion history.
3 Results
3.1 Stellar population gradients
We begin with a comparison of the gradients of stellar populations measured in Illustris quiescent galaxies to observations. Figure 2 shows the gradients in the quiescent galaxies as a function of velocity dispersion within (, to compare with observations) in the three radius ranges defined above, with comparisons to available observations.
The top panels of Figure 2 show metallicity gradients (). Almost all Illustris metallicity gradients are negative, in agreement with observed early-type galaxies (e.g., Sánchez-Blázquez et al., 2007; Pastorello et al., 2014; González Delgado et al., 2015; Greene et al., 2015). In the inner galaxy region, we find no significant mass-dependence, unlike Spolaor et al. (2010), who found evidence of a tight correlation between and at low masses. Likewise, we find no strong mass-dependence in the outer galaxy region. Our measurements match the stacked observations from the MASSIVE Survey (Greene et al., 2015) at large masses, but we do not find steep metallicity gradients () at low masses like those measured by the SLUGGS survey (Pastorello et al., 2014). However, the apparent discrepancies between the gradients are not supported by the individual metallicity data points (see Appendix B). In the stellar halo, there is a noticeable trend with mass, in the sense that low-mass galaxies have somewhat steeper metallicity gradients. Comparable observations are scant.
The middle panels of Figure 2 show gradients in stellar ages (). Illustris galaxies have a wide variety of both negative and positive age gradients. In the inner and outer galaxy regions, our measurements are in rough agreement with available observations (Spolaor et al., 2010; Greene et al., 2015; González Delgado et al., 2015). There is a modest tension at large masses in the outer galaxy region, where we do not find predominantly negative age gradients, but so far this is within the uncertainties of observations. In the stellar halo, age gradients tend to be positive, but as with metallicity gradients, observations have yet to reach these large radii.
The gradients in surface-brightness profiles () are shown in the bottom panels of Figure 2. At all radii, surface-brightness profiles are decreasing. We show comparisons to Sérsic profiles, with average gradients computed in an similar fashion to our measurements. Low-mass galaxies have relatively shallow surface-brightness profiles in the inner galaxy region that become successively steeper at larger radius, behavior that corresponds to lower () Sérsic indices. In contrast, high-mass galaxies have steeper profiles in the inner galaxy but show relatively little steepening at large radii, in agreement with larger () Sérsic indices. Forthcoming results from MANGA, SAMI, and CALIFA will soon improve observational constraints for the inner and outer galaxy regions. In the stellar halo, stacked observations of SDSS galaxies (D’Souza et al., 2014) appear somewhat steeper than the Illustris sample, and have the opposite mass-dependence to the simulations: slightly flatter profiles in the lowest-mass bin. Ferrarese et al. (2006) found that the Sérsic index increases with mass, in rough agreement with the trends we observe here. However, Illustris stellar halo surface-brightness gradients at low-mass are steeper than would be predicted from extrapolations of the observed Sérsic profiles.
3.2 Accretion histories
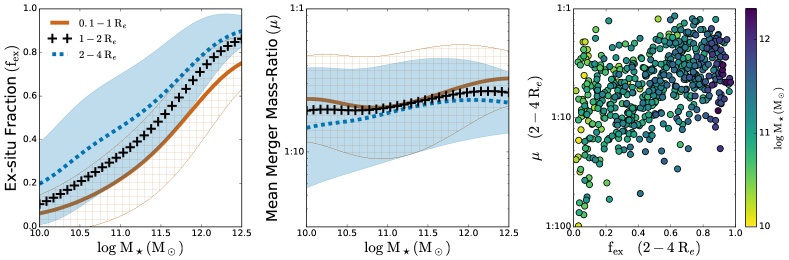
The left panel of Figure 3 shows the local ex-situ fraction () in the three regions (inner galaxy, outer galaxy, and stellar halo) as a function of mass. As is expected, accreted material makes up a larger fraction of the total at large radii. Over all radius ranges, the ex-situ fraction increases monotonically with mass. Comparisons with lower-resolution runs of Illustris confirm the mass-dependence of the ex-situ fraction is not due to resolution effects (Rodriguez-Gomez et al., 2016), so this is a clear signature of hierarchical growth.
The middle panel of Figure 3 shows the wide distribution of mean merger mass-ratios among galaxies of all masses in Illustris. There is no significant trend with mass, but there is a slight radial dependence, with the inner galaxy tending to be more heavily influenced by major mergers than the outer regions. This result is discussed in more detail in Rodriguez-Gomez et al. (2016).
We also investigate the connection between the ex-situ fraction and the merger mass-ratio in the stellar halo, which is shown in the right panel of Figure 3. The overall patterns of hierarchical accretion imply it is uncommon to accrete large amounts of mass from minor mergers alone (Rodriguez-Gomez et al., 2016), which is apparent in the rough correlation between and in the stellar halo. Yet the large sample size of Illustris allows us to study a small number of these uncommon galaxies (right panel of Figure 3, lower-right of diagram).
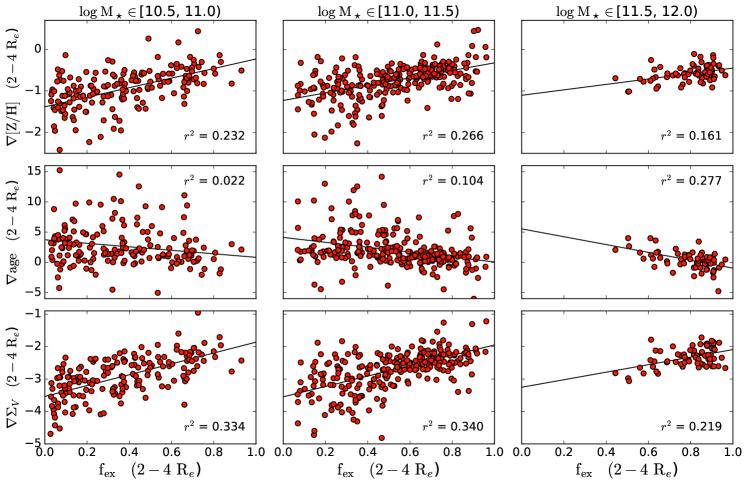
3.3 Connecting gradients to accretion histories
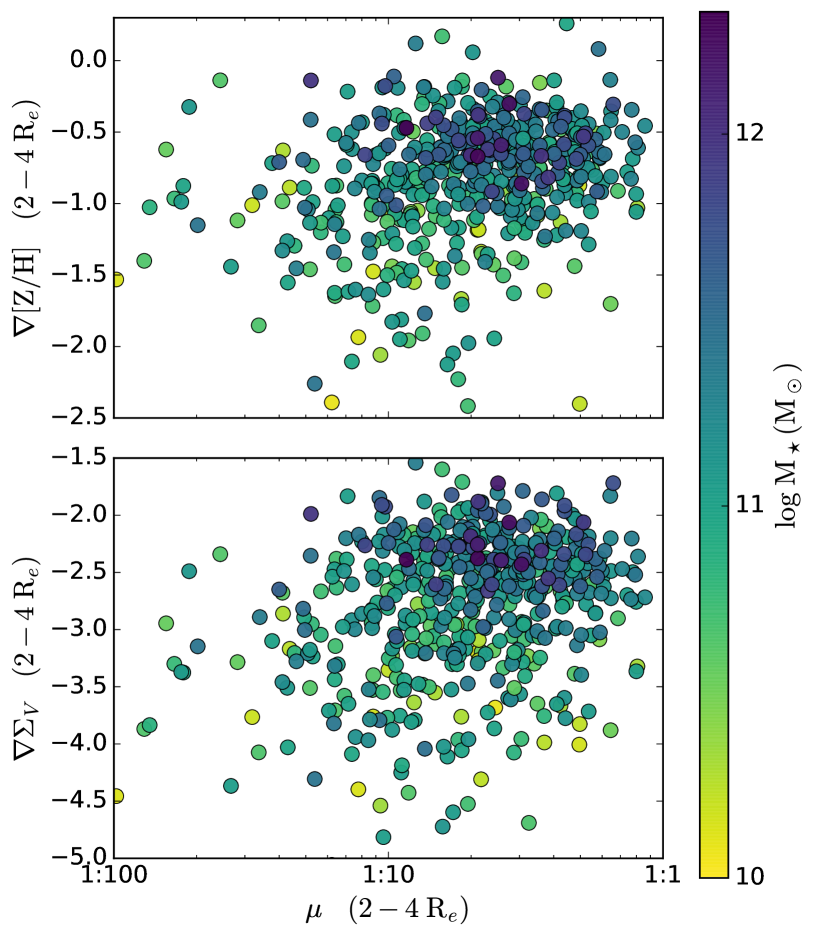
We investigate how the range of stellar population gradients, particularly in the stellar halo, is related to the variety of galactic accretion histories. Figure 4 shows the trends between mass, stellar halo gradients, and stellar halo ex-situ fraction. At fixed mass, the accreted fraction varies significantly and is correlated with both and , as shown by Pearson coefficients in each panel of Figure 4. Galaxies that have accreted more of their halo stars have flatter metallicity profiles than those that were dominated by in-situ growth. The same is true in regards to the surface-brightness profiles, in agreement with previous results (Figure 5, lower-right panel of Pillepich et al., 2014).
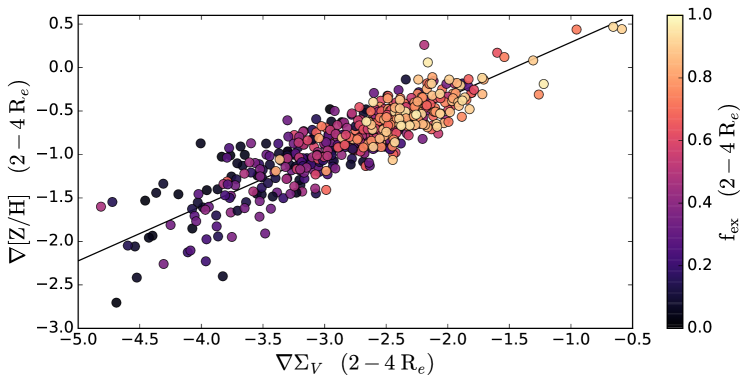
Given that both the stellar halo metallicity and surface-brightness gradients are correlated with the accreted fraction, we should expect a tight relation between the two. In Figure 5, we show this is indeed the case. In the range the best fit line is given by:
| (5) |
The location of a galaxy along this relation depends on the amount of accretion it has experienced in its stellar halo, as shown by the colors in Figure 5. The fit explains of the variation in the data, as determined via the explained variance regression score (Wall & Jenkins, 2012).
The tight correlation between and in the stellar halo implies that the information content between the two is similar. Both profiles are tracing the accretion history of the stellar halo: halos with higher accreted fractions have both flatter metallicity and surface-brightness profiles.
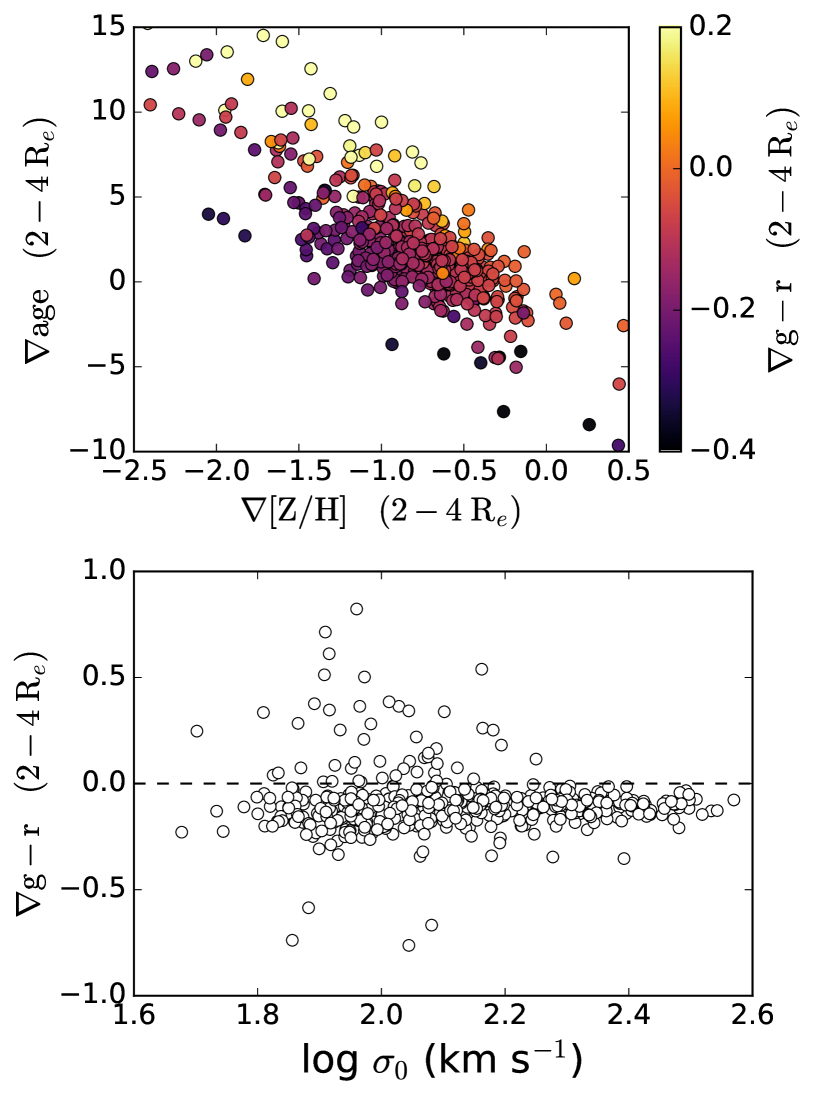
The weak correlation between and suggests that the age profile retains relatively little information content. There is still, however, a slight correlation between and in the stellar halo, as shown in the top panel of Figure 6. Importantly, the direction of this correlation results in a tendency to wash out any variation gradients of color () in the stellar halo. As shown in the bottom panel of Figure 6, nearly all the stellar halos in our quiescent sample have identical color gradients: . For this reason, we do not consider color gradients further as a probe of accretion history properties.
In addition to the cumulative amount of accretion, we also investigate the influence of merger mass-ratio on the stellar population gradients. In Figure 7 we show the correlations between the mean merger mass-ratio and metallicity and surface-brightness gradients, with all quantities measured in the stellar halo. While both gradients are correlated with , neither is significantly correlated with the mean merger mass-ratio. Stellar halos with a given stellar population gradient are just as likely to have been dominated by major mergers as by minor mergers.
To quantify the amount of information retained in each of the stellar population profiles, we compute the first-order partial correlation coefficients (§4.3, Wall & Jenkins, 2012) between the observable gradients and the accretion properties. The partial correlation coefficient between variables and , controlling for the influence of , is given by:
| (6) |
where is the Pearson correlation coefficient. Thus, represents the correlation between the two variables beyond what can be explained from mutual correlation with the third (potentially-confounding) variable.
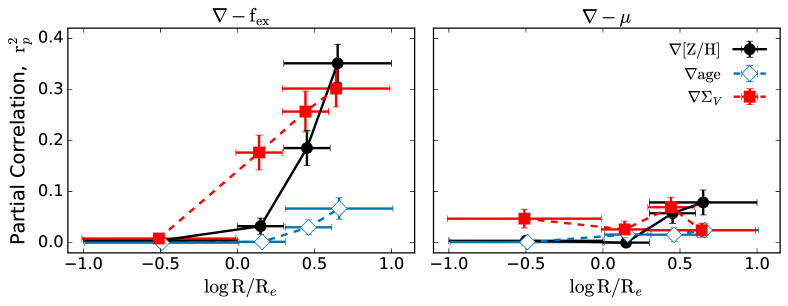
In Figure 8, we show as a function of galactic radius, computed between the three gradients () and the local accretion history parameters ( and ). We control for the confounding influence of stellar mass (), which is shown in Figure 3 to be correlated with the ex-situ fraction. The uncertainty is quantified using bootstrap resamplings. Therefore, represents the amount of variation in each gradient that is solely explained by the accretion properties.
Comparing the left and right panels of Figure 8, the gradients correlate much more strongly with the ex-situ fraction than with the mean merger mass-ratio. It is apparent that the stellar population gradients are tracing the total amount of accretion, not whether that accretion was via major or minor mergers.
Figure 8 also shows that the information content of accretion is retained in the stellar population profiles only at very large radii from the galaxy. In the inner galaxy region (), there is no correlation between the accreted fraction and any of the gradients. At successively larger radii, and become increasingly correlated with the local ex-situ fraction, with explaining as much as of the variation in the gradients when measured very far () into the stellar halo. The metallicity gradient does not retain more information content than the surface-brightness profile , except possibly in the very farthest regions of the stellar halo. is not a strong probe of the accretion information content at any radius. These findings suggest that deep photometry in galactic stellar halos should be equal probes of galactic accretion histories as spectroscopic metallicity measurements.
3.4 Redshift evolution of stellar population profiles
We have shown that Illustris stellar halos with larger accreted fractions tend to host flatter gradients in metallicity and surface-brightness. If this is a causal relation – i.e. accretion actively flattens these stellar population profiles – then we would expect most galaxies to have steeper profiles at earlier times, when they had accreted less material. To investigate this, we study the evolution of metallicity and surface-brightness profiles as a function of redshift.
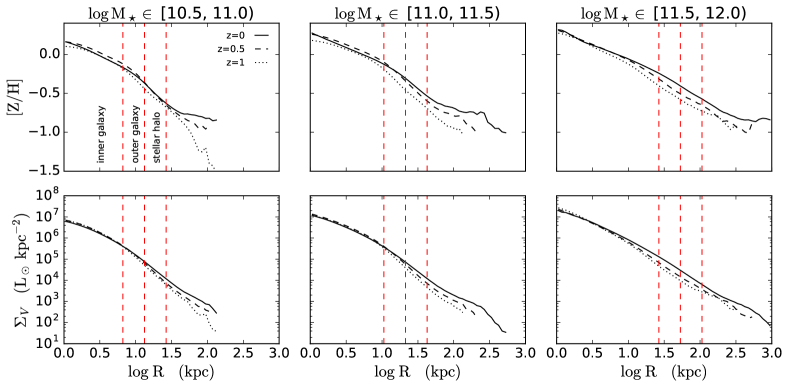
We use the Illustris SubLink merger trees (Rodriguez-Gomez et al., 2015) to identify the and progenitors of each galaxy in our quiescent sample. We project the positions of particles in each progenitor galaxy against a random line-of-sight, then average the profiles at each redshift in three bins, according to the mass. The results are shown in Figure 9. We note that faithfully comparing the evolution of these profiles to observations will be difficult because of progenitor bias (van Dokkum & Franx, 2001; Wellons et al., 2016b).
From to the present, none of the profiles evolve significantly over the inner . This is particularly interesting in the case of the surface-brightness profile, as the inner surface-density profiles (not shown) do increase by a factor of over this time period. The combination of accretion and passive evolution of an old stellar population in these central regions appears to roughly cancel out any changes to the inner of the surface-brightness profiles.
In the outer regions of the galaxies, the metallicity and surface-brightness profiles flatten noticeably since . The galaxies that are quiescent at were not necessarily quenched at higher redshifts, so this does not only represent ex-situ mass growth. However the lack of any significant change to the inner profiles (where in-situ growth would show substantial effects) suggests that the majority of this evolution comes from the accretion of material into the galactic outskirts. In the two lower mass bins, the profiles steepen even more significantly beyond , supporting the indications from Figure 8: observations that push into the farthest reaches of the stellar halo will be the most successful at constraining the history of accretion.
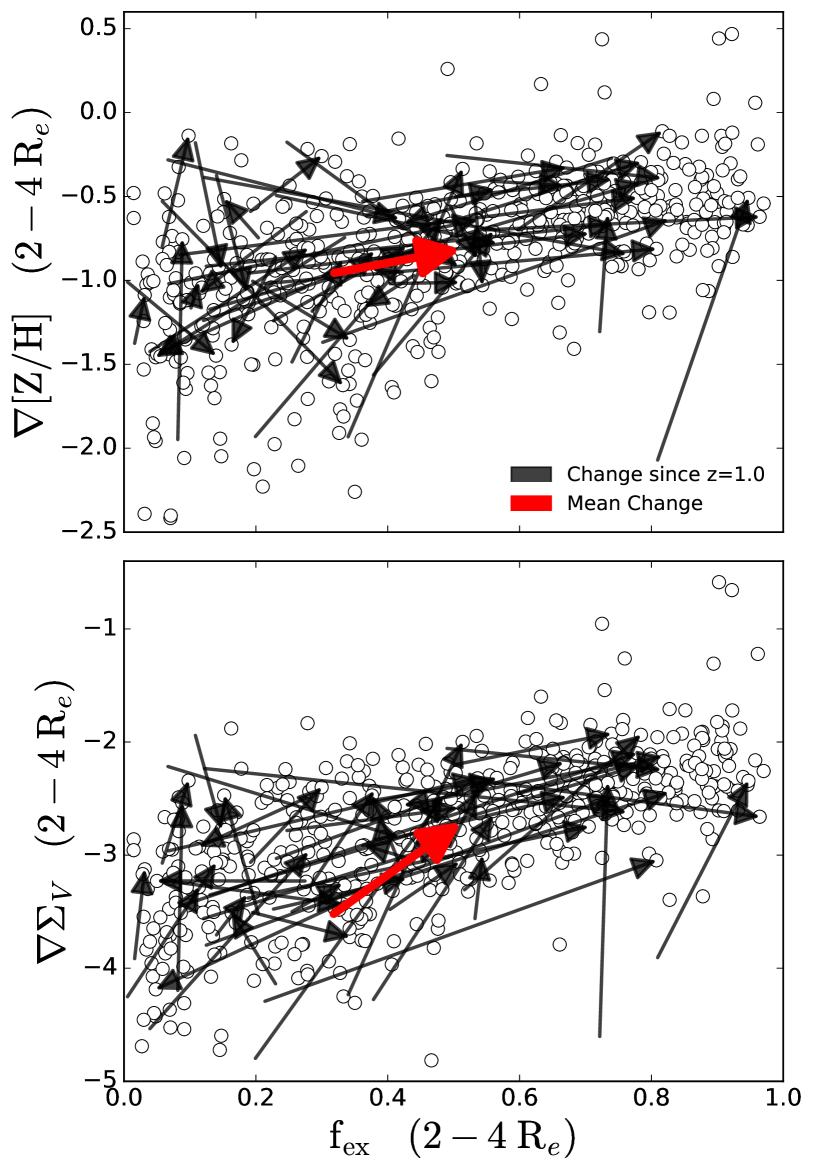
In Figure 10, we show the individual evolutionary paths since of a random sub-sample of our quiescent Illustris galaxies, in terms of stellar population gradients and ex-situ fraction in the stellar halo. Also shown is the relation between the gradients () and accreted fraction (). Galaxies have diverse histories, but on average stellar halo gradients have gotten flatter while ex-situ fractions have increased. The majority tend to move along the relation observed at .
4 Discussion - The Information Content of Stellar Halos
We find that, at a fixed mass, galaxies with different average accretion histories will have different stellar halo properties. Steeper profiles from in either metallicity or surface-brightness indicate a quieter history of accretion into the halo, while relatively flat profiles signal that a stellar halo was built-up from large amounts of accretion. As shown in Figure 8, this becomes even more significant when measured far () into the stellar halo. This agrees with predictions of the influence of in-situ and ex-situ growth on stellar population gradients (Kobayashi, 2004; Oser et al., 2010), and with previous analysis of the stellar mass-density profiles in Illustris stellar halos (Pillepich et al., 2014). In-situ star formation in early-type galaxies initially produces steep metallicity gradients and surface-brightness profiles beyond . Mergers and accretion tend to deposit stars in the outskirts of the galaxies, flattening their metallicity gradients and surface-brightness profiles. Age gradients are poor indicators of a galaxy’s accretion history.
A surprising discovery was that none of the stellar population profiles studied are correlated with the local merger mass-ratio. It is easy to imagine that a stellar halo that accreted a large amount of mass via many : mergers would have different properties from one that experienced a single : merger. Previous analysis of Illustris galaxies (Rodriguez-Gomez et al., 2016) has shown that minor mergers tend to deposit their ex-situ material at larger radii than do major mergers, which would necessarily affect the resulting surface-brightness profiles. Amorisco (2016) used a library of N-body merger simulations to model the accreted portions of stellar halos, and found the slopes and normalizations of the ex-situ mass profiles correlate with the typical merger mass-ratio.
The mass-metallicity relation for galaxies likewise suggests that major mergers (involving massive galaxies) should typically leave different signatures in metallicity profiles than minor mergers (with low-mass satellites). Indeed, previous hydrodynamical zoom simulations of 10 galaxies by Hirschmann et al. (2015) found that metallicity and color gradients beyond were correlated with the mass gained from major mergers (or alternatively the overall mean merger mass-ratio), implying that major mergers tended to flatten gradients more significantly than minor mergers.
Our findings instead suggest that the primary driver of observable stellar halo metallicity and surface-brightness profiles is the total amount of accreted mass, regardless of the typical merger mass-ratio. When we separate the stellar halo stars into in-situ and ex-situ populations, we find that the slope of the ex-situ surface-brightness profile (not shown) does depend on the typical merger mass-ratio, in agreement with Amorisco (2016). However the in-situ surface-brightness profile (which does not depend on merger mass-ratio) is significantly steeper than the ex-situ profiles. Therefore, the ratio of ex-situ to in-situ material is what primarily determines the slope of the overall profile.
The correlation between metallicity gradient and merger mass-ratio found by Hirschmann et al. (2015), which is not apparent in Illustris stellar halos, could be due to their relatively small sample size. As shown in the right panel of Figure 3, stellar halos with high ex-situ fractions generally tend to have been dominated by major mergers. It is uncommon to accrete a significant amount of mass from minor mergers alone. A re-examination of the Hirschmann et al. (2015) data supports this conclusion: the galaxies in their simulations with high merger mass-ratios had higher accreted fractions overall. Thus the correlation they observed between and is actually due to the underlying correlation between and .
With the large sample size of Illustris we are able to offer improved statistics, including a handful of the uncommon galaxies that accreted significant fractions of their stellar halos from minor mergers alone (right-most panel of Figure 3; points in lower-right of diagram). These high , low stellar halos have relatively flat metallicity and surface-brightness profiles, which supports the model that the ex-situ fraction is the dominant driver of stellar halo profiles, not the merger mass-ratio.
There are known issues with the Illustris model, as discussed in §1, which impact this work. The incomplete quenching of star-formation at likely resulted in an under-population of the red sequence, and thus a smaller sample of quiescent galaxies. Another significant issue with Illustris is the inflated sizes of galaxies below . We have attempted to compensate for this by considering regions defined by , rather than a fixed range in . If Illustris galaxies retain the proper relative structure, but are simply scaled large by a factor of a few, this should be sufficient to cancel the systematic size bias. However, it is possible that the inflated sizes (and correspondingly low velocity dispersions) of small galaxies left them more susceptible to tidal disruption, which could affect the amount of accreted stellar material deposited into stellar halos.
These systematic issues in the Illustris galaxy formation model are being addressed in a new generation of Illustris simulations, which among other changes has new implementations of AGN and galactic wind feedback (Weinberger et al., 2016, Pillepich et al. 2016 in prep) that are designed to improve the efficiency of quenching. Hirschmann et al. (2015) (but also Rodriguez-Gomez et al. 2016, Figure 3) found that different galactic and AGN feedback prescriptions can have significant effects on the mass fraction of stellar accretion. However, while we expect such changes to directly affect the normalization of the brightness and metallicity profiles studied here, we argue that their impact on the steepness of such profiles (the gradients, which are the focus of this work) is less direct and possibly negligible. Analysis of these future simulations will help identify possible biases to the quantitative results presented here and to confirm whether our qualitative conclusions about the information content of brightness and metallicity gradients in the stellar halo hold.
5 Summary
In this paper, we have investigated the observable stellar properties of simulated early-type galaxies, and how stellar population gradients are connected to the history of accretion in the stellar halo. We considered a sample of quiescent galaxies from Illustris, a state-of-the-art hydrodynamical cosmological simulation (Vogelsberger et al., 2014b; Genel et al., 2014; Nelson et al., 2015). Our final sample includes 537 quiescent galaxies ranging in stellar mass from , which we demonstrate have overall ages and metallicities which agree with observations.
Developing an accurate understanding of how the stellar halo traces accretion requires a statistical population of galaxies large enough to sample the wide variety of possible accretion histories in a CDM cosmology. Illustris is thus an ideal laboratory to study this problem. Its large cosmological volume avoids the issue of small sample sizes found in smaller hydrodynamical simulations (e.g., Hirschmann et al., 2015), while also producing realistic galaxies, which are difficult to replicate using N-body only simulations (e.g., Cooper et al., 2010). We now summarize our primary results:
-
1.
Stellar population gradients in quiescent Illustris galaxies are in overall agreement with available observations, although there are few comparable observations at large radii (). We measure logarithmic gradients in metallicity ([Z/H]), age, and surface-brightness (), as computed in three radius ranges: the inner galaxy (), the outer galaxy (), and the stellar halo (). These measurements incorporate realistic observational effects and find overall negative metallicity and surface-brightness gradients as well as age gradients that are on-average flat.
-
2.
At fixed mass, the gradients of both the metallicity and surface-brightness profiles beyond are strongly correlated with the overall amount of accretion (the ex-situ fraction) in the stellar halo, as well as with one-another. Age gradients are at most only weak tracers of accretion histories. The information content of accretion histories is only preserved in stellar population gradients in the stellar halo, beyond .
-
3.
Stellar halo metallicity profiles do not contain extra information related to accretion histories than do surface-brightness profiles, suggesting that photometric observations in stellar halos are sensitive to the same information content as spectroscopic measurements.
-
4.
The total amount of accretion is what primarily affects profiles of stellar populations in the stellar halo, not the mean merger mass-ratio. In a CDM cosmology, it is uncommon for a stellar halo to have accreted large amounts of mass from minor mergers alone. However, the few examples available in Illustris show relatively flat stellar halo metallicity and surface-brightness gradients corresponding to their high ex-situ fractions.
-
5.
The only significant evolution of the metallicity and surface-brightness profiles since occurs at radii larger than , where both profiles become flatter with time. While there is significant system-to-system variation, most stellar halos evolve towards higher accreted fractions and flatter stellar population profiles and tend to do so along the relation observed at .
Taken together, these findings show that the metallicity and surface-brightness profiles in the stellar halo are shaped by the cumulative history of accretion a halo has undergone. The initial in-situ formation of a galaxy’s stars leaves steep profiles, with few, primarily metal-poor stars in the galactic outskirts. As the galaxies grow through mergers, the accretion of material deposits significantly more stars, which are relatively more metal-rich, into the stellar halo, flattening and .
By calculating averaged radial profiles this work approximated galaxies as having smooth radial distributions. Our results suggest that these azimuthally-averaged profiles are not sensitive to the relative influence of major and minor mergers. In practice, stellar halos typically do not show azimuthal-symmetry, but instead have significant clumpy substructure. In future analysis, we hope to characterize this in Illustris stellar halos and determine whether stellar halo substructure is a better probe of specific merger histories than smoothed profiles.
Observational surveys designed to characterize the stellar halos of individual galaxies can be approached in two basic ways. Deep spectroscopic observations can measure metallicity and age gradients (e.g., Coccato et al., 2010; Pastorello et al., 2014; González Delgado et al., 2015), while integrated light photometry can constrain the surface-brightness profiles to large radii (e.g., Mihos et al., 2005; Duc et al., 2014; van Dokkum et al., 2014). Our results suggest that either approach is sufficient to infer the overall amount of accretion that contributed to the build-up of a galaxy’s stellar halo. Future surveys which study a common sample of stellar halos with both photometric and spectroscopic observations can be used to test our prediction of a correlation between metallicity and surface-brightness profiles (see Figure 5). Through a combined effort, simulations like Illustris and future observational surveys can help to decode the information content preserved in stellar halos and solidify our understanding of the formation and evolution of early-type galaxies.
Appendix A Projection Effects
All measurements in this paper are computed after projecting the positions of the star particles in each galaxy against a random line-of-sight. Ignoring this effect can introduce systematic biases between simulations and observations. For example, simple geometrical effects will cause the observed sizes () of galaxies to be smaller after projection than the 3D effective radii. Deviations from spherical symmetry can also result in significant variation depending on the particular line-of-sight projection, such as in the case of significant ellipticity or a disk-like structure.
To study the impact of these effects, we compute the typical bias and uncertainty that arises from comparing multiple projected measurements to those computed in 3D. First, we compute and other subsequent properties (, gradients , local ex-situ fractions and mean merger mass-ratios ) using the full 3D positions and velocities of all particles. We then measure the same properties in projection 100 times, using different, randomly selected lines-of-sight for each projection. Each iteration is self-consistent: quantities such as , , and are calculated in regions defined by that iteration’s . We then take the mean and standard deviation of the 100 random projections. We study the difference between the mean 2D value and the 3D value (), as well as the median of the standard deviations between 100 2D projections (). We do not compute the 3D gradient of the surface-brightness profile , which is inherently a projected quantity.
| Property | Region | 2D - 3D | 2D std |
|---|---|---|---|
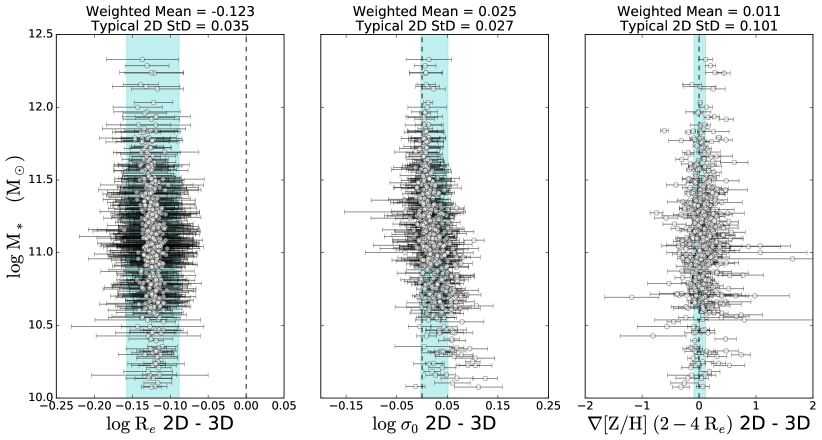
Figure 11 shows the results of this analysis for a few measured properties: galaxy sizes, velocity dispersions, and the stellar halo metallicity gradients, and the results for all measured quantities are listed in Table 1.
As predicted from geometrical arguments, projected galaxy sizes () are biased low by about on average (), in excellent agreement with the analytical solution for the Hernquist (1990) profile. The projection biases in other properties are relatively small (). However, different lines-of-sight projections can induce significant variations () in measurements of stellar population gradients, especially in the stellar halo.
Appendix B Comparison to SLUGGS Survey Gradients
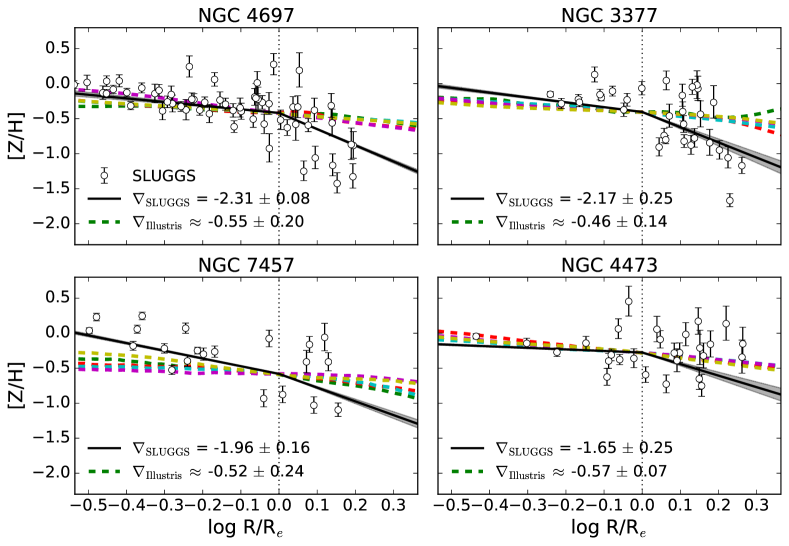
In §3.1 we showed our measurements of stellar population gradients in Illustris galaxies, and found they agreed well with most available observations from the literature. A notable exception was in the outer galaxy () metallicity gradients, which at low masses are much flatter than observations from the SAGES Legacy Unifying Globulars and GalaxieS (SLUGGS) survey (Pastorello et al., 2014). In Figure 12, we directly compare the metallicity profiles of Illustris galaxies to the four SLUGGS galaxies with the steepest published gradients.
The individual SLUGGS metallicity measurements are shown in white (Pastorello, private correspondence), each along with example metallicity profiles from a selection of Illustris galaxies with comparable masses. Representative profiles with the published SLUGGS metallicity gradients and corresponding uncertainties are overplotted with a gray band.
While in the cases of NGC 4697 the Illustris profiles are too shallow to match the observed data, they appear broadly consistent with the data for NGC 3377, 4473, and 7457, despite the fact that the computed gradients seem so different. Further exploration of these discrepancies is beyond the scope of this work.
References
- Abadi et al. (2006) Abadi, M. G., Navarro, J. F., & Steinmetz, M. 2006, Mon. Not. R. Astron. Soc., 365, 747
- Amorisco (2015) Amorisco, N. C. 2015, eprint arXiv:1511.08806, 13
- Amorisco (2016) —. 2016, ArXiv e-prints
- Bailin et al. (2014) Bailin, J., Bell, E. F., Valluri, M., et al. 2014, Astrophys. J., 783, 95
- Bekki & Shioya (1999) Bekki, K., & Shioya, Y. 1999, Astrophys. J., 513, 108
- Bell et al. (2008) Bell, E. F., Zucker, D. B., Belokurov, V., et al. 2008, Astrophys. J., 680, 295
- Bernardi et al. (2013) Bernardi, M., Meert, A., Sheth, R. K., et al. 2013, Mon. Not. R. Astron. Soc., 436, 697
- Bruzual & Charlot (2003) Bruzual, G., & Charlot, S. 2003, Mon. Not. R. Astron. Soc., 344, 1000
- Buitrago et al. (2016) Buitrago, F., Trujillo, I., Curtis-Lake, E., et al. 2016, eprint arXiv:1602.01846, 16
- Bullock & Johnston (2005) Bullock, J. S., & Johnston, K. V. 2005, Astrophys. J., 635, 931
- Cappellari (2016) Cappellari, M. 2016, ArXiv e-prints
- Carlberg (1984) Carlberg, R. G. 1984, Astrophys. J., 286, 403
- Coccato et al. (2010) Coccato, L., Gerhard, O., & Arnaboldi, M. 2010, Mon. Not. R. Astron. Soc. Lett., 407, L26
- Coccato et al. (2011) Coccato, L., Gerhard, O., Arnaboldi, M., & Ventimiglia, G. 2011, Astron. Astrophys., 533, A138
- Conroy et al. (2014) Conroy, C., Graves, G. J., & van Dokkum, P. G. 2014, Astrophys. J., 780, 33
- Conselice (2014) Conselice, C. J. 2014, Annu. Rev. Astron. Astrophys., 52, 291
- Cooper et al. (2015) Cooper, A. P., Parry, O. H., Lowing, B., Cole, S., & Frenk, C. 2015, Mon. Not. R. Astron. Soc., 454, 3185
- Cooper et al. (2010) Cooper, A. P., Cole, S., Frenk, C. S., et al. 2010, Mon. Not. R. Astron. Soc., 406, 744
- Daddi et al. (2005) Daddi, E., Renzini, A., Pirzkal, N., et al. 2005, Astrophys. J., 626, 680
- Di Matteo et al. (2009) Di Matteo, P., Pipino, A., Lehnert, M. D., Combes, F., & Semelin, B. 2009, Astron. Astrophys., 499, 427
- Dolag et al. (2009) Dolag, K., Borgani, S., Murante, G., & Springel, V. 2009, Mon. Not. R. Astron. Soc., 399, 497
- D’Souza et al. (2014) D’Souza, R., Kauffman, G., Wang, J., & Vegetti, S. 2014, Mon. Not. R. Astron. Soc., 443, 1433
- Duc et al. (2014) Duc, P.-A., Cuillandre, J.-C., Karabal, E., et al. 2014, Mon. Not. R. Astron. Soc., 446, 120
- Dutton et al. (2011) Dutton, A. A., Conroy, C., van den Bosch, F. C., et al. 2011, Mon. Not. R. Astron. Soc., no
- Eggen et al. (1962) Eggen, O. J., Lynden-Bell, D., & Sandage, A. R. 1962, Astrophys. J., 136, 748
- Eisenstein et al. (2005) Eisenstein, D. J., Zehavi, I., Hogg, D. W., et al. 2005, Astrophys. J., 633, 560
- Ferrarese et al. (2006) Ferrarese, L., Cote, P., Jordan, A., et al. 2006, Astrophys. J. Suppl. Ser., 164, 334
- Font et al. (2011) Font, A. S., McCarthy, I. G., Crain, R. A., et al. 2011, Mon. Not. R. Astron. Soc., 416, 2802
- Foster et al. (2009) Foster, C., Proctor, R. N., Forbes, D. A., et al. 2009, Mon. Not. R. Astron. Soc., 400, 2135
- Gallazzi et al. (2005) Gallazzi, A., Charlot, S., Brinchmann, J., White, S. D. M., & Tremonti, C. A. 2005, Mon. Not. R. Astron. Soc., 362, 41
- Genel et al. (2014) Genel, S., Vogelsberger, M., Springel, V., et al. 2014, Mon. Not. R. Astron. Soc., 445, 175
- Gilbert et al. (2014) Gilbert, K. M., Kalirai, J. S., Guhathakurta, P., et al. 2014, Astrophys. J., 796, 76
- González Delgado et al. (2014) González Delgado, R. M., Cid Fernandes, R., García-Benito, R., et al. 2014, Astrophys. J., 791, L16
- González Delgado et al. (2015) González Delgado, R. M., García-Benito, R., Pérez, E., et al. 2015, Astron. Astrophys., 581, A103
- Greene et al. (2015) Greene, J. E., Janish, R., Ma, C.-P., et al. 2015, Astrophys. J., 807, 11
- Greene et al. (2012) Greene, J. E., Murphy, J. D., Comerford, J. M., Gebhardt, K., & Adams, J. J. 2012, Astrophys. J., 750, 32
- Gregersen et al. (2015) Gregersen, D., Seth, A. C., Williams, B. F., et al. 2015, Astron. J., 150, 189
- Helmi et al. (2011) Helmi, A., Cooper, A. P., White, S. D. M., et al. 2011, Astrophys. J., 733, L7
- Helmi et al. (1999) Helmi, A., White, S. D. M., de Zeeuw, P. T., & Zhao, H. 1999, Nature, Vol. 402, Issue 6757, pp. 53-55 (1999).
- Hernquist (1990) Hernquist, L. 1990, Astrophys. J., 356, 359
- Hinshaw et al. (2013) Hinshaw, G., Larson, D., Komatsu, E., et al. 2013, Astrophys. J. Suppl. Ser., 208, 19
- Hirschmann et al. (2015) Hirschmann, M., Naab, T., Ostriker, J. P., et al. 2015, Mon. Not. R. Astron. Soc., 449, 528
- Huang et al. (2016) Huang, S., Ho, L. C., Peng, C. Y., Li, Z.-Y., & Barth, A. J. 2016, Astrophys. J., 821, 114
- Hunter (2007) Hunter, J. D. 2007, Comput. Sci. Eng., 9, 90
- Ibata et al. (1994) Ibata, R. A., Gilmore, G., & Irwin, M. J. 1994, Nature, 370, 194
- Ibata et al. (2001) Ibata, R., Irwin, M., Lewis, G., Ferguson, A. M. N., & Tanvir, N. 2001, Nature, Vol. 412, Issue 6842, pp. 49-52 (2001).
- Ivezić et al. (2000) Ivezić, Ž., Goldston, J., Finlator, K., et al. 2000, Astron. J., 120, 963
- Johnston et al. (1996) Johnston, K. V., Hernquist, L., & Bolte, M. 1996, Astrophys. J., 465, 278
- Jones et al. (2001) Jones, E., Oliphant, T., Peterson, P., & Others. 2001, SciPy: Open source scientific tools for Python
- Kobayashi (2004) Kobayashi, C. 2004, Mon. Not. R. Astron. Soc., 347, 740
- Kormendy et al. (2009) Kormendy, J., Fisher, D. B., Cornell, M. E., & Bender, R. 2009, Astrophys. J. Suppl. Ser., 182, 216
- Kuntschner et al. (2010) Kuntschner, H., Emsellem, E., Bacon, R., et al. 2010, Mon. Not. R. Astron. Soc., 408, 97
- La Barbera et al. (2012) La Barbera, F., Ferreras, I., de Carvalho, R. R., et al. 2012, Mon. Not. R. Astron. Soc., 426, 2300
- Lacey & Cole (1994) Lacey, C., & Cole, S. 1994, Mon. Not. R. Astron. Soc., 271, 676
- Larson (1975) Larson, R. B. 1975, Mon. Not. R. Astron. Soc., 173, 671
- Lotz et al. (2004) Lotz, J. M., Primack, J., & Madau, P. 2004, Astron. J., 128, 163
- Lowing et al. (2014) Lowing, B., Wang, W., Cooper, A., et al. 2014, Mon. Not. R. Astron. Soc., 446, 2274
- Majewski et al. (2003) Majewski, S. R., Skrutskie, M. F., Weinberg, M. D., & Ostheimer, J. C. 2003, Astrophys. J., 599, 1082
- Martínez-Delgado et al. (2010) Martínez-Delgado, D., Gabany, R. J., Crawford, K., et al. 2010, Astron. J., 140, 962
- Martínez-Delgado et al. (2012) Martínez-Delgado, D., Romanowsky, A. J., Jay Gabany, R., et al. 2012, Astrophys. J., 748, L24
- McConnachie et al. (2009) McConnachie, A. W., Irwin, M. J., Ibata, R. A., et al. 2009, Nature, 461, 66
- McKinney (2010) McKinney, W. 2010, Data Structures for Statistical Computing in Python
- Mihos et al. (2005) Mihos, J. C., Harding, P., Feldmeier, J., & Morrison, H. 2005, Astrophys. J., 631, L41
- Nelson et al. (2015) Nelson, D., Pillepich, A., Genel, S., et al. 2015, Astron. Comput., 13, 12
- Oliva-Altamirano et al. (2015) Oliva-Altamirano, P., Brough, S., Tran, K.-V., et al. 2015, Mon. Not. R. Astron. Soc., 449, 3347
- Omand et al. (2014) Omand, C. M. B., Balogh, M. L., & Poggianti, B. M. 2014, Mon. Not. R. Astron. Soc., 440, 843
- Oser et al. (2010) Oser, L., Ostriker, J. P., Naab, T., Johansson, P. H., & Burkert, A. 2010, Astrophys. J., 725, 2312
- Panter et al. (2008) Panter, B., Jimenez, R., Heavens, A. F., & Charlot, S. 2008, Mon. Not. R. Astron. Soc., 391, 1117
- Partridge & Peebles (1967) Partridge, R. B., & Peebles, P. J. E. 1967, Astrophys. J., 147, 868
- Pastorello et al. (2014) Pastorello, N., Forbes, D. A., Foster, C., et al. 2014, Mon. Not. R. Astron. Soc., 442, 1003
- Pastorello et al. (2015) Pastorello, N., Forbes, D. A., Usher, C., et al. 2015, Mon. Not. R. Astron. Soc., 451, 2625
- Pedregosa et al. (2011) Pedregosa, F., Varoquaux, G., Gramfort, A., et al. 2011, J. Mach. Learn. Res., 12, 2825
- Pérez & Granger (2007) Pérez, F., & Granger, B. E. 2007, Comput. Sci. Eng., 9, 21
- Pillepich et al. (2015) Pillepich, A., Madau, P., & Mayer, L. 2015, Astrophys. J., 799, 184
- Pillepich et al. (2014) Pillepich, A., Vogelsberger, M., Deason, A., et al. 2014, Mon. Not. R. Astron. Soc., 444, 237
- Poggianti et al. (2013) Poggianti, B. M., Calvi, R., Bindoni, D., et al. 2013, Astrophys. J., 762, 77
- Renzini (2006) Renzini, A. 2006, Annu. Rev. Astron. Astrophys., 44, 141
- Rodriguez-Gomez et al. (2015) Rodriguez-Gomez, V., Genel, S., Vogelsberger, M., et al. 2015, Mon. Not. R. Astron. Soc., 449, 49
- Rodriguez-Gomez et al. (2016) Rodriguez-Gomez, V., Pillepich, A., Sales, L. V., et al. 2016, Mon. Not. R. Astron. Soc., 458, 2371
- Sánchez-Blázquez et al. (2007) Sánchez-Blázquez, P., Forbes, D. A., Strader, J., Brodie, J., & Proctor, R. 2007, Mon. Not. R. Astron. Soc., 377, 759
- Shen et al. (2003) Shen, S., Mo, H. J., White, S. D. M., et al. 2003, Mon. Not. R. Astron. Soc., 343, 978
- Smoot et al. (1992) Smoot, G. F., Bennett, C. L., Kogut, A., et al. 1992, Astrophys. J., 396, L1
- Snyder et al. (2015) Snyder, G. F., Torrey, P., Lotz, J. M., et al. 2015, Mon. Not. R. Astron. Soc., 454, 1886
- Somerville & Davé (2015) Somerville, R. S., & Davé, R. 2015, Annu. Rev. Astron. Astrophys., 53, 51
- Spolaor et al. (2010) Spolaor, M., Kobayashi, C., Forbes, D. A., Couch, W. J., & Hau, G. K. T. 2010, Mon. Not. R. Astron. Soc., 408, 272
- Springel (2010) Springel, V. 2010, Mon. Not. R. Astron. Soc., 401, 791
- Springel et al. (2001) Springel, V., White, S. D. M., Tormen, G., & Kauffmann, G. 2001, Mon. Not. R. Astron. Soc., 328, 726
- Tal & van Dokkum (2011) Tal, T., & van Dokkum, P. G. 2011, Astrophys. J., 731, 89
- Thomas et al. (2005) Thomas, D., Maraston, C., Bender, R., & de Oliveira, C. M. 2005, Astrophys. J., 621, 673
- Torrey et al. (2015) Torrey, P., Snyder, G. F., Vogelsberger, M., et al. 2015, Mon. Not. R. Astron. Soc., 447, 2753
- Tortora et al. (2011) Tortora, C., Romeo, A. D., Napolitano, N. R., et al. 2011, Mon. Not. R. Astron. Soc., 411, 627
- Trager et al. (2000) Trager, S. C., Faber, S. M., Worthey, G., & González, J. J. 2000, Astron. J., 119, 1645
- Trujillo et al. (2007) Trujillo, I., Conselice, C. J., Bundy, K., et al. 2007, Mon. Not. R. Astron. Soc., 382, 109
- Trujillo et al. (2006) Trujillo, I., Forster Schreiber, N. M., Rudnick, G., et al. 2006, Astrophys. J., 650, 18
- van der Walt et al. (2011) van der Walt, S., Colbert, S. C., & Varoquaux, G. 2011, Comput. Sci. Eng., 13, 22
- van der Wel et al. (2014) van der Wel, A., Franx, M., van Dokkum, P. G., et al. 2014, Astrophys. J., 788, 28
- van Dokkum et al. (2014) van Dokkum, P. G., Abraham, R., & Merritt, A. 2014, Astrophys. J., 782, L24
- van Dokkum & Franx (2001) van Dokkum, P. G., & Franx, M. 2001, Astrophys. J., 553, 90
- van Dokkum et al. (2008) van Dokkum, P. G., Franx, M., Kriek, M., et al. 2008, Astrophys. J., 677, L5
- van Dokkum et al. (2010) van Dokkum, P. G., Whitaker, K. E., Brammer, G., et al. 2010, Astrophys. J., 709, 1018
- Vogelsberger et al. (2014a) Vogelsberger, M., Genel, S., Springel, V., et al. 2014a, Mon. Not. R. Astron. Soc., 444, 1518
- Vogelsberger et al. (2014b) —. 2014b, Nature, 509, 177
- Wall & Jenkins (2012) Wall, J., & Jenkins, C. R. 2012, Practical Statistics for Astronomers, second edi edn. (Cambridge, UK: Cambridge University Press)
- Weinberger et al. (2016) Weinberger, R., Springel, V., Hernquist, L., et al. 2016, ArXiv e-prints
- Wellons et al. (2016a) Wellons, S., Torrey, P., Ma, C.-P., et al. 2016a, Mon. Not. R. Astron. Soc., 456, 1030
- Wellons et al. (2016b) —. 2016b, Mon. Not. R. Astron. Soc., 456, 1030
- Worthey (1994) Worthey, G. 1994, Astrophys. J. Suppl. Ser., 95, 107