Star formation history of And XVIII: a dwarf spheroidal galaxy in isolation ††thanks: Based on observations made with the NASA/ESA Hubble Space Telescope, program GO-13442, with data archive at the Space Telescope Science Institute. STScI is operated by the Association of Universities for Research in Astronomy, Inc. under NASA contract NAS 5-26555.
Abstract
We present a photometric study of the Andromeda XVIII dwarf spheroidal galaxy associated with M31, and situated well outside of the virial radius of the M31 halo. The galaxy was resolved into stars with Hubble Space Telescope/Advanced Camera for Surveys revealing the old red giant branch and red clump. With the new observational data we determined the Andromeda XVIII distance to be Mpc using the tip of red giant branch method. Thus, the dwarf is situated at the distance of 579 kpc from M31. We model the star formation history of Andromeda XVIII from the stellar photometry and Padova theoretical stellar isochrones. An ancient burst of star formation occurred 12–14 Gyr ago. There is no sign of recent/ongoing star formation in the last 1.5 Gyr. The mass fractions of the ancient and intermediate age stars are 34 and 66 per cent, respectively, and the total stellar mass is 10. It is probable that the galaxy has not experienced an interaction with M31 in the past. We also discuss star formation processes of dSphs KKR 25, KKs 03, as well as dTr KK 258. Their star formation histories were uniformly measured by us from HST/ACS observations. All the galaxies are situated well beyond the Local Group and the two dSphs KKR 25 and KKs 03 are extremely isolated. Evidently, the evolution of these objects has proceeded without influence of neighbours.
keywords:
galaxies: dwarf – galaxies: distances and redshifts – galaxies: stellar content – galaxies: individual: And XVIII1 Introduction
In recent years, the galaxies in the immediate vicinity of the Local Group have been the focus of intense and wide-ranging research (McQuinn et al., 2013; Collins et al., 2015; Crnojević et al., 2014), as these galaxies represent a unique laboratory for studies of the history of star formation in the Universe, the properties of dark matter and tests of the modern cosmological LCDM paradigm. In particular, it is obvious that the Local Group can be especially promising in the search for new dwarf galaxies. This search is especially important, bearing in mind the well known ”lost satellites” problem in cosmology, because the LCDM theory predicts more satellites of giant galaxies than are found in reality. Recently we have detected and studied several unusual nearby dwarf galaxies. These spheroidal objects are rather isolated, or at the outskirts of the Local Group (Makarov et al., 2012; Karachentsev et al., 2014, 2015). Although the sample of galaxies is still small, they represent a class of dwarf galaxies that can help understand the problems of the formation and evolution of dwarf galaxies and groups of galaxies within the LCDM paradigm.

The Local Group dwarf galaxy Andromeda XVIII is one more object in the sample of quite isolated dwarf spheroidals. It was discovered by McConnachie et al. (2008) as a part of their CFHT/MegaPrime photometric survey of M31. The observations were made in g and i bands, and the galaxy was seen as a prominent overdensity of stars. The colour-magnitude diagram of And XVIII was obtained by McConnachie et al. (2008), and red giant branch stars were clearly visible. Tollerud et al. (2012) observed spectra of a number of red giant stars belonging to And XVIII. According to their data, And XVIII has the heliocentric systemic velocity km s-1and the velocity dispersion km s-1. The authors note, that the measured is very close to M31’s . They pointed out that at a distance of about 600 kpc from M31 And XVIII is near its apocenter and therefore at rest with respect to M31.
In this work we present new observations of the And XVIII dwarf galaxy obtained aboard the Hubble Space Telescope with the Advanced Camera for Surveys (HST/ACS), which allow us to measure an accurate photometric distance and the detailed star formation history of the galaxy based on the photometry of the resolved stellar populations of And XVIII. These new data can shed light on the origin and evolution of the dwarf spheroidal galaxy.
2 Observations and photometry
Observations of the dwarf galaxy And XVIII were made with the ACS/HST on June 20, 2014 within the SNAP project 13442 (PI: R.B.Tully). Two images were obtained in the F606W and F814W filters with the exposures 1100 s in each. Figure 1 shows the F606W image of the galaxy. This low surface brightness galaxy is very well resolved into individual stars. They can be distinguished in the upper chip of the ACS image. A number of bright foreground Galactic stars contaminate the image.
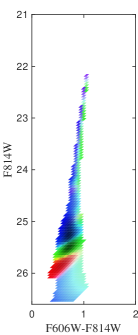
We use the ACS module of the DOLPHOT software package111http://americano.dolphinsim.com/dolphot/ by A. Dolphin for photometry of resolved stars. The data quality images were used to mask bad pixels. Only stars of good photometric quality were used in the analysis, following the recommendations given in the DOLPHOT User’s Guide. We have selected the stars with signal-to-noise (S/N) of at least five in both filters and . The resulting colour-magnitude diagram of And XVIII is presented in Fig. 2.
It is well known, that artificial star tests are the most accurate way to estimate the photometric errors, blending and incompleteness in the crowded fields of nearby resolved galaxies. These tests were performed for And XVIII using the same DOLPHOT reduction procedures. A significant number of artificial stars were generated in the appropriate magnitude and colour range so that the distribution of the recovered magnitudes is adequately sampled. Photometric errors are indicated in Fig. 1. In the CMD we show the stars with signal-to-noise 5 in both F606W and F814W filters. According to the artificial star experiments, the 50% completeness level is appearing at F814W 26.7 mag and at F606W 27.6 mag.
3 Colour-magnitude diagram and foreground contamination
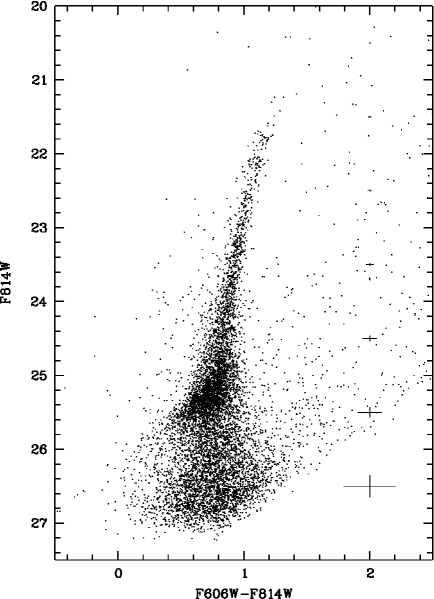
The colour-magnitude diagram of And XVIII (Fig. 2) shows a thin and well distinguished red giant branch (RGB). It is not heavily populated in the upper part, and only a few probable upper AGB stars are seen above the RGB tip at F814W = 21.7 mag. The most abundant feature in the CMD is the red clump visible in the magnitude range between about F814W=24.6 mag and F814W=25.6 mag, well above the photometric limit. The blue ward stub of a horizontal branch (HB) is poorly distinguished. It approaches the photometric limit at the blue end. However, traces of a scattered HB population can be seen to the lower and bluer part of the CMD. There is no evidence of a blue main sequence, as is typical for dwarf spheroidal galaxies lacking ongoing star formation.
The stars in the CMD redder than about =1.6-1.8 obviously belong to our Milky Way galaxy (MW). To account for this contamination we need to construct a colour-magnitude diagram of the MW in the direction of And XVIII. We cannot use the HST/ACS image of And XVIII itself, because the galaxy occupies a significant part of the frame. To account for the MW contamination in this region, we have used the TRILEGAL program (Girardi et al., 2005), that computes synthetic colour-magnitude diagrams for the specified coordinates in the sky and given parameters of the Milky Way model. Forty synthetic CMDs were constructed with TRILEGAL and then averaged to avoid stochastic errors in synthetic CMDs. Random and systematic photometric uncertainties and completeness measured from artificial star experiments were applied to the synthetic CMDs. Resulting contamination by the MW stars was determined to be 104 stars over the CMD of And XVIII. These stars were statistically excluded from further analysis.
4 Distance determination
A precise knowledge of the distance is necessary to determine the star formation history from a CMD analysis. A photometric distance to And XVIII dwarf galaxy was first estimated by McConnachie et al. (2008) in the framework of their CFHT/MegaPrime photometric survey of M31. They reported the TRGB distance of And XVIII Mpc.
The present HST/ACS photometry is deeper and it has a higher quality. There are also a number of improvements implemented to the TRGB method itself. We have determined the photometric TRGB distance with our trgbtool program which uses a maximum-likelihood algorithm to obtain the magnitude of TRGB from the stellar luminosity function (Makarov et al., 2006). The measured TRGB magnitude is in the ACS instrumental system. Using the calibration for the TRGB distance indicator by Rizzi et al. (2007) and the Galactic extinction E(B-V) = 0.093 from Schlafly & Finkbeiner (2011), we derived the true distance modulus for And XVIII: ( Mpc). This new distance is in a good agreement with the previous estimation.
5 Star formation history
5.1 The method
The observed distribution of stars in the colour-magnitude diagram is a linear superposition of all the stars, at various stages of evolution, born in the galaxy during her life. Several additional parameters also have a strong influence on this photometric distribution: the distance to the object, presence of external and internal absorption and photometric errors.
The quantitative star formation and metal enrichment history of And XVIII was determined from the stellar photometry results using our StarProbe package (Makarov & Makarova, 2004). This program adjusts the observed photometric distribution of stars in the colour-magnitude diagram against a positive linear combination of synthetic diagrams.
Observation data and model data are presented in the form of Hess diagrams, which are two-dimensional histograms showing the number of stars in a certain range (bin) of magnitudes and colour indices. The optimum size of the bin depends on the characteristics of the photometric data. On the one hand, the bin must be large enough to contain a considerable number of stars. On the other hand, it should clearly reflect the characteristics of the distribution stars in the CMD. The size of the cells used for And XVIII is 0.05 mag in luminosity and colour.
The main and most time consuming step in determining the SFH is to build a model CMD. The model Hess diagrams are built on the basis of the theoretical stellar isochrones, each corresponding to a particular age and metallicity. The whole set of these models covers a wide range of ages and metallicities of stellar populations. We used the Padova2000 set of theoretical isochrones (Girardi et al., 2000). The distance is adopted from the present paper (see above) and the Galactic extinction is taken from Schlafly & Finkbeiner (2011). The accuracy and completeness of photometry is given in tabular form, obtained as a result of the simulation of a large number of artificial stars. We are building an analytic function of the distribution of stars in the Hess diagram for each isochrone of a certain age and metallicity, taking into account the IMF, photometry errors, the Hess diagram bin size, distance modulus and the Galactic absorption. We use the Salpeter IMF: .
We have taken into account the presence of unresolved binary stars (binary fraction), following our recipe in Makarova et al. (2010). We suppose the binary fraction to be 30 per cent, taking the mass function of individual stars and the main component of a binary system to be the same. The mass distribution for the second component was taken to be flat in the range 0.7 to 1.0 of the main component mass.
We interpolate the original isohrones in age to avoid discontinuities in the CMD, so that the adjacent isochrones have maximum separation less than 0.03 mag. We do not produce interpolation in metallicities, using the original set of metallicities. For each isochrone we calculate the corresponding artificial Hess diagram, which reflects the probability to find a star in a given bin. For the star formation reconstruction we split the lifetime into relatively small periods with 2 Gyr steps for the old stellar populations and 0.5 Gyr steps near 1 Gyr and younger. For each time period we combine the partial artificial Hess diagrams assuming a constant star formation rate during this period. As the result we construct a set of the Hess diagrams, covering range of ages from 4 Myr to 14 Gyr and metallicities from to .
The observed CMD is a linear combination of stars over all episodes of star formation. For the reconstruction of the SFH we try to find a linear positive combination of model CMDs that best fit the observations. Firstly, we find the most significant episodes of star formation, which differs from zero with given probability, using a stepwise algorithm. After that we determine star formation rates using a maximum likelihood method taking into account that the numbers of stars in bins of a Hess diagram obey Poisson statistics. The probability of a given realization of the Hess diagram with stars in -bin is
| (1) |
where represents of linear combination of a stack of model CMDs with star formation rate b. The maximum likelihood problem is equivalent to the minimization of function:
| (2) |
The several thousand bins for the star formation reconstruction is large enough to use Wilks’ theorem for confidence estimation. It tell us that the difference between the full and reduced log-likelihoods follows a -distribution derived as:
| (3) |
with the degrees of freedom equal to the difference of number of free parameters between full, and reduced, , models. Thus, in our case of independent episodes of star formation, a confidence region for star formation rates can be derived as:
| (4) |
where is the th quantile of a distribution. Equation 4 gives us a way to estimate confidence intervals for derived values.
The resulting star formation history (SFH) is shown in Fig. 3.
The 1 errors of the estimated SFR during each period of non-zero star formation are derived from the computed confidence levels. The periods with insignificant star formation were excluded from the fitting process. We assign them to be identically equal to zero. Thus, we do not determine the errors for the star formation with zero rates. The confidence intervals are reliable estimation of the random errors of the SFR. They do not include the systematic uncertainties related to specific choice of the stellar evolution models and IMF, as well as an influence of variations in extinction and distance estimation. Thereby, the error bars reflect only the random errors of SFR reconstruction using Padova2000 isochrones set. It is the lower limit of the overall uncertainties. It is worth to note, that the detailed analysis of systematic and random errors, which could appear in the process of maximum likelihood fitting of artificial CMDs to the real data, was performed by Dolphin (2012, 2013). The results confirms the importance of an isochrone set uncertainties in the SFR confidence levels. In particular, these systematic errors could dominate for the relatively shallow CMDs. However, this kind of analysis is far beyond the scope of the present article.
5.2 SFH of And XVIII
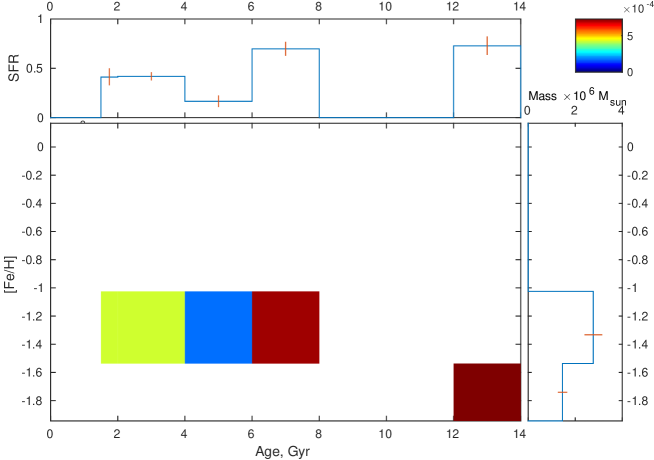
Figures 3, 4 and 5 demonstrate the star formation rate and metallicity changes during the life of And XVIII. According to our calculations, an ancient burst of star formation occurred 12–14 Gyr ago. The mean SFR during this period was 10. The metallicity of the stars that were formed were predominantly in the interval [Fe/H]= – dex. The CMD indicates that there followed a quiescent period in the star formation of And XVIII from 8 to 12 Gyr ago. This phenomenon is widespread in dwarf galaxies. It is known that in such objects the star formation process is complex, and bursts alternate with periods of lower rates of star formation (Weisz et al. (2011), Savino et al. (2015), Karachentsev et al. (1999), and references therein).
However, at the And XVIII distance of 1.33 Mpc we have reached an absolute I magnitude about +1 in a single HST/ACS orbit, i.e. the fainter stellar populations like the horizontal branch and the lower part of the main sequence are below our photometric limit. Without the information revealed in this part of a CMD it is difficult to resolve the age-metallicity-SFR relation for the oldest ( Gyr) star formation events, due to tight packing of the corresponding isochrones at the brightest part of the CMD. Nevertheless, Weisz et al. (2011) have demonstrated that a recovered SFH does not depend on the photometric depth, but rather on the number of stars in the CMD, if the using stellar models are known exactly. But the authors also note, that stellar models are not always self-consistent, and the measured SFR may be systematically shifted into a particular time bin, depending on the stellar models and photometric depth of the CMD. However, in the case of And XVIII the detailed analysis of the recovery of the red clump (see below in this Section) supports each of the SFH claims.
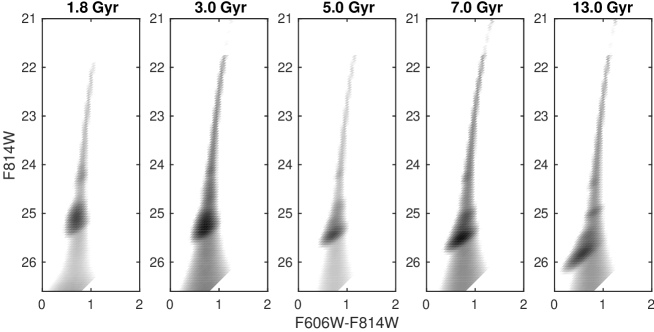
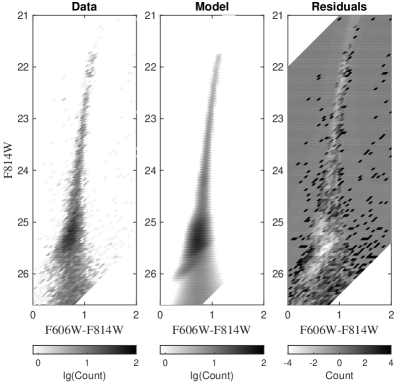
Our measurements also indicate a process of continuous star formation from 1.5 to 8 Gyr ago. These stars must have higher metallicity at [Fe/H]= – dex. We see evidence from the synthetic diagram of a variation of the mean intensity of star formation from 1.6 to 10. There is no sign of recent/ongoing star formation in the last 1.5 Gyr of And XVIII’s life. The mass fraction of the ancient and intermediate age stars is 34 and 66 per cent, respectively. The total measured stellar mass of And XVIII is 10. In Fig. 4 we show Hess diagrams of the reconstructed stellar populations. The panels correspond to the five episodes of star formation. The grayscale is calibrated to the predicted number of stars in each episode. The most intensive are the 3 and 7 Gyr episodes, that describe the big and stretched red clump in the observed CMD. In Fig. 5 the observed and combined model CMDs are shown. The number of stars per bin is coded by grey colour on a logarithmic scale in both the data and the model panels. The residual panel shows the difference between the observed and model diagrams. The values in each bin were normalized by the square root of the respective model value, which provides an estimation of the Poisson noise. Grey colours vary from white for negative to black for positive residuals. Even the most discrepant regions are within deviation. The very weak AGB is fitted quite well, with observed stars against modelled.
Kirby et al. (2013) have measured the metallicity of a few red giant stars in And XVIII from individual stellar spectra. They calculate the value of [Fe/H] = , which is in good agreement with our measurements of the metallicity of red giants of age between 1.5 and 8 Gyr. Observed and model parameters for the And XVIII galaxy are gathered in Table 1.
We summarize the salient features described by our age-metallicity model. There cannot have been significant star formation in the last 1.5 Gyr because of the absence of obvious markers of youth. The stunted horizontal branch tells us that there was an ancient episode of star formation ( Gyr), though limited. The prominence and extended luminosity range of the red clump requires that there are intermediate age stars. The fainter red clump stars imply older ages, up to 7 Gyr while the brighter red clump stars are compatible with ages as young as 1.5 Gyr. The plot with colours in Fig. 5 emphasizes the evidence for these claims. The oldest population, in red, manifests itself mainly in the HB. Stars at Gyr, in green, have built the fainter range of the red clump. Stars in the range Gyr produce a more luminous red clump. The upper part of the red giant branch is thin. There is a formal separation between the younger intermediate age stars in blue and the older intermediate age stars in green because the same metallicity is taken for both populations. If the younger stars have slightly higher metallicity then the populations would merge along the bright extension of the RGB. The ancient population is buried within the upper RGB by happenstance with its lower metallicity.
. And XVIII Source Position (J2000) 00h02m14.5s45d05m20s NED , mag 0.093 Schlafly & Finkbeiner (2011) , mag 15.500.24a this work , mag 14.680.15 this work , mag this work , mag this work Central surface brightness in , mag arcsec-2 23.960.02 this work Central surface brightness in , mag arcsec-2 23.140.02 this work Exponential scale length in , arcsec this work Exponential scale length in , arcsec this work Axial ratio 0.99 LV databaseb Heliocentric velocity , km s-1 332.12.7 Tollerud et al. (2012) Total velocity dispersion, km s-1 9.72.3 Tollerud et al. (2012) Distance modulus, mag this work Distance, Mpc this work Linear distance to M 31, kpc this work Mass fraction of oldest stars (12–14 Gyr) % this work Mean metallicity of oldest stars, [Fe/H], dex this work Mean SFR 12–14 Gyr ago, /yr 10-4 this work Fraction of intermediate age stars (1.5–8 Gyr) % this work Mean metallicity of intermediate age stars, [Fe/H], dex this work Total stellar mass, M⊙ 106 this work aThe total magnitudes are not corrected for Galactic extinction bhttp://www.sao.ru/lv/lvgdb/
5.3 Star formation in nearby isolated dwarf galaxies
Table 2 provides the star formation parameters for 6 dwarf galaxies at the periphery of the Local Group. The star formation histories of dSphs KKR25, KKs03 and And XVIII, as well as dTr KK258 were uniformly measured by us from HST/ACS observations. The nearer dwarf irregulars DDO210 and Leo A were analysed by Cole et al. (2014) from HST/ACS photometry extending about 2 mag deeper to include fainter main sequence stars. The CMDs of the two latter objects resolve the earliest epoch of star formation in some detail.
All the galaxies are situated well beyond the individual virial radii of M31 and the Milky Way and the two dSphs KKR25 and KKs03 are extremely isolated. It can be expected that the evolution of all these objects have been unfettered by external tidal influences. The measured total stellar masses are low for all the galaxies, not exceeding about 107 M⊙. However, the ACS fields do not include faint outskirts so stellar mass estimates are somewhat truncated.
In this small sample, the systems with the largest stellar masses, those above M⊙, had the largest fraction of their stars formed early. The two irregulars started very slowly with star formation. And XVIII is intermediate.
One can speculate that early evolution of very isolated dwarf galaxies is controlled mostly by the value of the potential well. For deeper wells larger amount of gas accretes faster towards the centre, cools down and the bulk of stars forms in the shortest time.
| Name | Type | Distancea | SFR 12 Gyr | Source | |||
| Mpc | % | % | M⊙ | /yr | |||
| KKR25 | dSph | 62 | 62 | Makarov et al. (2012) | |||
| KK258 | dTr | 70 | 70 | Karachentsev et al. (2014) | |||
| KKs03 | dSph | 74 | 74 | Karachentsev et al. (2015) | |||
| DDO210 | dIrr | b | 10 | 24 | Cole et al. (2014) | ||
| LeoA | dIrr | b | 4 | 11 | Cole et al. (2014) | ||
| AndXVIII | dSph | 34 | 34 | this work | |||
| aDistance from nearest giant galaxy | |||||||
| bDistance value from Jacobs et al. (2009) | |||||||
6 Total and surface photometry
Total and surface photometry of And XVIII was made with fully processed distortion-corrected HST/ACS F606W and F814W images. Background stars were removed from the frames by fitting of a first order surface in a rectangular pixel-area in the nearest neighbourhood of a star. The sky background in the ACS images is insignificant but, to remove possible slight large scale variations, the sky was approximated by a tilted plane, created from a two-dimension polynomial, using the least-squares method. The accuracy of the sky background determination is about 1 – 2 % of the original sky level.
To measure total galaxy magnitude in each band, the galaxy image was at first fitted with concentric ellipses. Then integrated photometry was performed in concentric ellipses with the defined parameters from a centre to the faint outskirts of the galaxy. The total magnitude was then estimated as the asymptotic value of the obtained radial growth curve. The measured total magnitudes are mag and mag. The estimated errors include the photometry and sky background uncertainties, as well as the transformation errors from instrumental ACS magnitudes to the standard V and I magnitudes (Sirianni et al., 2005). The corresponding absolute magnitudes of And XVIII are and , taking into account Galactic extinction (Schlafly & Finkbeiner, 2011), and the distance modulus from the present paper (see above).
Azimuthally averaged surface brightness profiles for And XVIII were obtained by differentiating the galaxy growth curves with respect to semiaxes. The resulting profiles in V and I bands are displayed in Fig. 6. The very low surface brightness of this dSph galaxy results in profiles that are quite noisy and shallow.
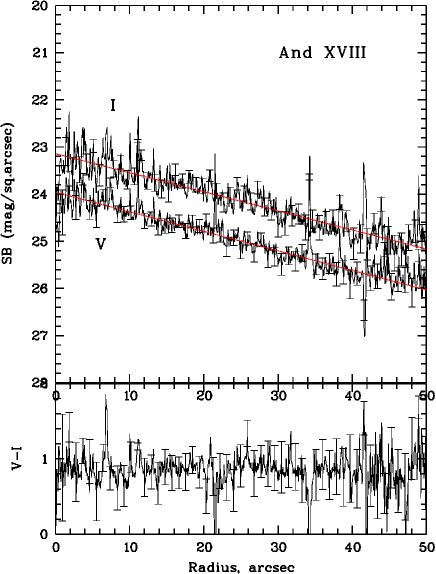
It is well known that surface brightness profiles of dwarf galaxies (both irregular and spheroidal) and also disks of spiral galaxies can be fitted by an exponential intensity law of brightness distribution (de Vaucouleurs, 1959)
or, in magnitudes per sq.sec
where is the central surface brightness and is the exponential scale length. The surface brightness profiles of And XVIII galaxy are well-fitted by an exponential law. The unweighted exponential fits to the surface brightness profiles were obtained by linear regression. The derived central surface brightness is mag arcsec-2 and mag arcsec-2. The uncertainties are formal fitting errors. The exponential scale lengths are arcsec and arcsec, 170 and 174 pc respectively.
7 The Local Group structure and isolated dSphs
The structure of the two subgroups of the Local Group is demonstrated in the Fig. 7. One subgroup is concentrated around our Milky Way galaxy and the other around Andromeda galaxy (M31). And XVIII is situated quite far from both giant spirals. It is associated with M31, being situated at the distance of 579 kpc from this gravitational centre, but at roughly twice the virial radius of the M31 group. McConnachie et al. (2008) note that And XVIII lies outside the known satellite planes around M31.

In Fig. 7 there are clearly visible concentrations of dwarf spheroidal galaxies, the satellites of MW and M31 within their virial radii. This phenomenon is well known as the distance-morphology relation (Grebel et al., 2003; Grebel, 2005). Although each family of the giant spirals satellites is quite extensive, exceptions from the familiar type dependence is rare. We have marked such objects with red stars: Cetus and And XVIII are located within the zero-velocity sphere of the Local Group, while Tucana, and especially KKR25 and KKs3, rightfully can be identified as isolated dwarf spheroidal galaxies. Detection of these dwarfs is of great importance for the understanding of star formation and evolution of dwarf galaxies.
In the work of Grcevich & Putman (2009) the authors note that most of the satellite dwarfs of the Milky Way and Andromeda situated within 260 - 280 kpc are not detected in HI, and this fact could be an indication that the predominant mechanism of gas loss is associated with the proximity to the main galaxy. There are several models that attempt to explain the origin of dSph galaxies by considering different mechanisms. Ram-pressure stripping, tidal stripping, feedback from supernovae or stellar winds, and the effects of reionization were considered as possible mechanisms of gas loss. Models based on tidal and ram-pressure stripping reasonably explain the formation of dSphs (Grcevich & Putman, 2009; Assmann et al., 2013). In these models, the dSph galaxies are formed due to the interaction between a rotationally supported dwarf irregular galaxy and a MW-sized host galaxy. Thus, the fact that we rarely find isolated dSph galaxies indicates the relevance of the proposed tidal and ram pressure mechanisms.
Nevertheless, the rather isolated dSphs at the far periphery of the Local group indicate that other mechanisms of evolution should be considered. Teyssier et al. (2012) used the Via Lactea II cosmological simulations to distinguish between dwarf galaxies within the Local Group that may have passed through the virial volume of the Milky Way, and those that have not. According to their modelling, Tucana and Cetus may have passed through the Milky Way in the past. In these cases recent star formation quenching, star burst episodes and low gas fraction could be explained by an encounter with the MW.
And XVIII dwarf spheroidal galaxy is situated at the linear distance of 579 kpc from the Andromeda galaxy. According to Tollerud et al. (2012), the galaxy has the systemic velocity km s-1, whereas M31 has mean heliocentric radial velocity km s-1. It is a question whether this galaxy experienced any interaction in the past. In the paper of Watkins et al. (2013) the orbital properties of the M31 satellites are estimated by a statistical analysis using a combination of the timing argument and phase-space distribution functions. This analysis provides periods of the known dwarf satellite galaxies, allowing us to distinguish the galaxies likely in the first infall to the M31 group. And XVIII has the period T= Gyr. This period makes this dwarf galaxy a first-approaching satellite. Unfortunately, the authors acknowledge that And XVIII may not be well described by their models due to the large separation distance. Anyway, it is highly possible that star formation cessation in this dwarf spheroidal galaxy has occurred without the influence of an interaction with the giant spiral M31.
According to our measurements (see description in section 5), And XVIII had an extended period of star formation from 1.5 to 8 Gyr ago, a distinct star formation episode from 12 to 14 Gyr ago, and no signs of star formation in the last 1.5 Gyr. Taking into account the studies mentioned above, we suggest, that the gas loss and star formation quenching in the last 1.5 Gyr were driven by internal processes in the galaxy itself rather than by any external influence.
8 Concluding remarks
We present new observations with HST/ACS of the Andromeda XVIII dwarf galaxy situated in the Local Group of galaxies and associated with giant spiral M 31. We analyse the star formation history and possible evolution of the galaxy and summarize the results of our study as follows:
-
•
We obtained a colour-magnitude diagram of the And XVIII as a result of the precise stellar photometry of the resolved stars possible with deep F606W (V) and F814W (I) HST/ACS images. The colour-magnitude diagram of And XVIII reveals a thin and well distinguished red giant branch. The most abundant feature in the CMD is the red clump, visible well above the photometric limit. There is no pronounced blue main sequence, a characteristic of dwarf spheroidal galaxies that lack ongoing star formation.
-
•
The high quality stellar photometry allows us to derive an accurate distance to And XVIII using the tip of the red giant branch distance indicator. The measured TRGB magnitude is in the ACS instrumental system. Using the calibration for the TRGB distance indicator by Rizzi et al. (2007) and the Galactic extinction E(B-V) = 0.093 from Schlafly & Finkbeiner (2011), we derived the true distance modulus for And XVIII of ( Mpc). Taking into account this new distance, And XVIII dwarf spheroidal galaxy is situated at the linear distance of 579 kpc from M31, well outside of the virial radius of the M31 halo.
-
•
We performed total and surface photometry of And XVIII with the fully processed distortion-corrected HST/ACS F606W and F814W images. The measured total magnitudes are mag and mag. The correspondent absolute magnitudes of And XVIII are and , taking into account Galactic extinction (Schlafly & Finkbeiner, 2011) and the distance modulus given directly above. The surface brightness profiles of And XVIII galaxy are well-fitted by an exponential law. The derived central surface brightness is mag arcsec-2 and mag arcsec-2. The uncertainties are formal fitting errors. The exponential scale length is arcsec (170 pc) and arcsec (174 pc).
-
•
The quantitative star formation and metal enrichment history of And XVIII was determined from the stellar photometry results using our StarProbe package (Makarov & Makarova, 2004). According to our calculations, an ancient burst of star formation occurred 12–14 Gyr ago. The metallicity of the stars formed at that time is found to be in the interval [Fe/H]= to dex. Our model is consistent with a subsequent quiescent period in the star formation history of And XVIII from 8 to 12 Gyr ago. Following that period, our measurements indicate that there was star formation from 8 to 1.5 Gyr ago, particularly prominently at the earliest and latest of those times. The stars from this period have higher metallicity of [Fe/H]= to dex. There is no signs of recent/ongoing star formation in the last 1.5 Gyr. The mass fractions of the ancient and intermediate age stars are 34 and 66 per cent, respectively. The total stellar mass of And XVIII is 10.
-
•
Taking into account this detailed star formation history of And XVIII, as well as the models in the works of Teyssier et al. (2012) and Watkins et al. (2013), we compare the possible evolution scenarios of And XVIII and 5 other isolated dwarf galaxies in the vicinity of the Local Group. It is suggested that, in isolated galaxies, gas loss and star formation quenching, the evident current condition in dSph systems, were driven by internal processes in the galaxy itself rather than by an external influence. It is likely that early evolution of very isolated dwarf galaxies is controlled mostly by the value of the potential well. For deeper wells a larger amount of gas accretes faster towards the centre, cools down, and the bulk of stars form in a short time.
Acknowledgements
This research is supported by award GO-13442 from the Space Telescope Science Institute for the analysis of observations with Hubble Space Telescope. This study is supported by the Russian Science Foundation (grant 14–12–00965). SFH measurement was made under the partial support from Research Program OFN-17 of the Division of Physics, Russian Academy of Sciences.
References
- Assmann et al. (2013) Assmann P., Fellhauer M., Wilkinson M. I., Smith R., 2013, MNRAS, 432, 274
- Cole et al. (2014) Cole A. A., Weisz D. R., Dolphin A. E., Skillman E. D., McConnachie A. W., Brooks A. M., Leaman R., 2014, ApJ, 795, 54
- Collins et al. (2015) Collins M. L. M., Martin N. F., Rich R. M., Ibata R. A., Chapman S. C., McConnachie A. W., Ferguson A. M., Irwin M. J., Lewis G. F., 2015, ApJ, 799, L13
- Crnojević et al. (2014) Crnojević D., Ferguson A. M. N., Irwin M. J., McConnachie A. W., Bernard E. J., Fardal M. A., Ibata R. A., Lewis G. F., Martin N. F., Navarro J. F., Noël N. E. D., Pasetto S., 2014, MNRAS, 445, 3862
- de Vaucouleurs (1959) de Vaucouleurs G., 1959, Handbuch der Physik, 53, 275
- Diaz et al. (2014) Diaz J. D., Koposov S. E., Irwin M., Belokurov V., Evans N. W., 2014, MNRAS, 443, 1688
- Dolphin (2012) Dolphin A. E., 2012, ApJ, 751, 60
- Dolphin (2013) Dolphin A. E., 2013, ApJ, 775, 76
- Girardi et al. (2000) Girardi L., Bressan A., Bertelli G., Chiosi C., 2000, A&AS, 141, 371
- Girardi et al. (2005) Girardi L., Groenewegen M. A. T., Hatziminaoglou E., da Costa L., 2005, A&A, 436, 895
- Grcevich & Putman (2009) Grcevich J., Putman M. E., 2009, ApJ, 696, 385
- Grebel (2005) Grebel E. K., 2005, in Mikolajewska J., Olech A., eds, Stellar Astrophysics with the World’s Largest Telescopes Vol. 752 of American Institute of Physics Conference Series, Stellar Populations in the Local Group of Galaxies. pp 161–174
- Grebel et al. (2003) Grebel E. K., Gallagher III J. S., Harbeck D., 2003, AJ, 125, 1926
- Jacobs et al. (2009) Jacobs B. A., Rizzi L., Tully R. B., Shaya E. J., Makarov D. I., Makarova L., 2009, AJ, 138, 332
- Karachentsev et al. (1999) Karachentsev I., Aparicio A., Makarova L., 1999, A&A, 352, 363
- Karachentsev et al. (2009) Karachentsev I. D., Kashibadze O. G., Makarov D. I., Tully R. B., 2009, MNRAS, 393, 1265
- Karachentsev et al. (2015) Karachentsev I. D., Makarova L. N., Makarov D. I., Tully R. B., Rizzi L., 2015, MNRAS, 447, L85
- Karachentsev et al. (2014) Karachentsev I. D., Makarova L. N., Tully R. B., Wu P.-F., Kniazev A. Y., 2014, MNRAS, 443, 1281
- Kirby et al. (2013) Kirby E. N., Cohen J. G., Guhathakurta P., Cheng L., Bullock J. S., Gallazzi A., 2013, ApJ, 779, 102
- Makarov et al. (2006) Makarov D., Makarova L., Rizzi L., Tully R. B., Dolphin A. E., Sakai S., Shaya E. J., 2006, AJ, 132, 2729
- Makarov et al. (2012) Makarov D., Makarova L., Sharina M., Uklein R., Tikhonov A., Guhathakurta P., Kirby E., Terekhova N., 2012, MNRAS, 425, 709
- Makarov & Makarova (2004) Makarov D. I., Makarova L. N., 2004, Astrophysics, 47, 229
- Makarova et al. (2010) Makarova L., Koleva M., Makarov D., Prugniel P., 2010, MNRAS, 406, 1152
- McConnachie et al. (2008) McConnachie A. W., Huxor A., Martin N. F., Irwin M. J., Chapman S. C., Fahlman G., Ferguson A. M. N., Ibata R. A., Lewis G. F., Richer H., Tanvir N. R., 2008, ApJ, 688, 1009
- McQuinn et al. (2013) McQuinn K. B. W., Skillman E. D., Berg D., Cannon J. M., Salzer J. J., Adams E. A. K., Dolphin A., Giovanelli R., Haynes M. P., Rhode K. L., 2013, AJ, 146, 145
- Rizzi et al. (2007) Rizzi L., Tully R. B., Makarov D., Makarova L., Dolphin A. E., Sakai S., Shaya E. J., 2007, ApJ, 661, 815
- Savino et al. (2015) Savino A., Salaris M., Tolstoy E., 2015, A&A, 583, A126
- Schlafly & Finkbeiner (2011) Schlafly E. F., Finkbeiner D. P., 2011, ApJ, 737, 103
- Sirianni et al. (2005) Sirianni M., Jee M. J., Benítez N., Blakeslee J. P., Martel A. R., Meurer G., Clampin M., De Marchi G., Ford H. C., Gilliland R., Hartig G. F., Illingworth G. D., Mack J., McCann W. J., 2005, PASP, 117, 1049
- Teyssier et al. (2012) Teyssier M., Johnston K. V., Kuhlen M., 2012, MNRAS, 426, 1808
- Tollerud et al. (2012) Tollerud E. J., Beaton R. L., Geha M. C., Bullock J. S., Guhathakurta P., Kalirai J. S., Majewski S. R., Kirby E. N., Gilbert K. M., Yniguez B., Patterson R. J., Ostheimer J. C., Cooke J., Dorman C. E., Choudhury A., Cooper M. C., 2012, ApJ, 752, 45
- Watkins et al. (2013) Watkins L. L., Evans N. W., van de Ven G., 2013, MNRAS, 430, 971
- Weisz et al. (2011) Weisz D. R., Dalcanton J. J., Williams B. F., Gilbert K. M., Skillman E. D., Seth A. C., Dolphin A. E., McQuinn K. B. W., Gogarten S. M., Holtzman J., Rosema K., Cole A., Karachentsev I. D., Zaritsky D., 2011, ApJ, 739, 5