Kiloparsec–scale dust disks in high-redshift luminous submillimeter galaxies
Abstract
We present high–resolution (0.16′′) 870m Atacama Large Millimeter/submillimeter Array (ALMA) imaging of 16 luminous () submillimeter galaxies (SMGs) from the ALESS survey of the Extended Chandra Deep Field South. This dust imaging traces the dust–obscured star formation in these galaxies on 1.3 kpc scales. The emission has a median effective radius of ′′0.02′′, corresponding to a typical physical size of 0.2 kpc. We derive a median Sérsic index of 0.2, implying that the dust emission is remarkably disk-like at the current resolution and sensitivity. We use different weighting schemes with the visibilities to search for clumps on 0.12′′ (1.0 kpc) scales, but we find no significant evidence for clumping in the majority of cases. Indeed, we demonstrate using simulations that the observed morphologies are generally consistent with smooth exponential disks, suggesting that caution should be exercised when identifying candidate clumps in even moderate S/N interferometric data. We compare our maps to comparable–resolution HST H160-band images, finding that the stellar morphologies appear significantly more extended and disturbed, and suggesting that major mergers may be responsible for driving the formation of the compact dust disks we observe. The stark contrast between the obscured and unobscured morphologies may also have implications for SED fitting routines that assume the dust is co-located with the optical/near–IR continuum emission. Finally, we discuss the potential of the current bursts of star formation to transform the observed galaxy sizes and light profiles, showing that the descendants of these SMGs are expected to have stellar masses, effective radii, and gas surface densities consistent with the most compact massive (M 1–21011 M⊙) early–type galaxies observed locally.
Key words: galaxies: starburst – galaxies: high-redshift – submillimeter – catalogs
1. INTRODUCTION
How high–redshift galaxies formed their stars remains an open question. Deep (rest–frame) UV/optical surveys have yielded large samples of high–redshift (1.5–3.5) star–forming galaxies selected based on magnitude/color properties (BM/BX, ; e.g., Steidel et al., 2004; Daddi et al., 2004, 2007a, 2007b), the study of which has provided a basic picture of their formation. In particular, studies of the ionized gas kinematics in such galaxies have uncovered a high fraction of large rotating disks among the massive, optically–bright systems (e.g., Förster Schreiber et al., 2006; Shapiro et al., 2008; Swinbank et al., 2012). These studies suggest that secular processes within star–forming galaxies are driving their gas and stars into the central regions, building up exponential disks and massive bulges without the need for major mergers (e.g., Elmegreen et al., 2008; Genzel et al., 2008; Dekel et al., 2009, 2013; Bournaud, 2016).
The most luminous galaxies at high–redshift are the dusty star–forming galaxies originally detected in the submillimeter and known as submillimeter galaxies (SMG; e.g., Blain et al., 2002; Solomon & Vanden Bout, 2005; Carilli & Walter, 2013; Casey et al., 2014). Their large luminosities ( L⊙, qualifying them as ultra– or even hyper–luminous infrared galaxies) make them easier to observe in the distant universe, in principle, though whether their star formation process differs from less extreme galaxies is still debated. The canonical picture is that the majority of SMGs are scaled–up ultra-luminous infrared galaxies (ULIRGs; Sanders & Mirabel, 1996) – i.e., starburst–dominated major mergers (e.g., Narayanan et al., 2010), although non-cosmological hydrodynamic simulations have suggested that SMGs could be a heterogeneous population: a mix of pre-merger pairs of disk galaxies, merger–induced starbursts, and isolated gas–rich disk galaxies undergoing a secular burst (e.g., Hayward et al., 2011, 2012). Still other models posit that the submillimeter-luminous phase is long-lived and associated with the bombardment of a central halo by numerous sub-halos in early Universe proto-clusters (Narayanan et al., 2015). Finally, some models propose that SMGs may simply represent the most massive extension of the normal star–forming galaxy population (e.g., Kereš et al., 2005, 2009b, 2009a; Davé et al., 2010). This last theory may be at odds with claims that normal (BM/BX, ) high–redshift star–forming galaxies seem to follow a different sequence than SMGs on the / plane (Genzel et al. 2010, e.g.,; Daddi et al. 2010, e.g.,; Hodge et al. 2015, e.g.,; although see Ivison et al. 2011).
In order to better understand how SMGs fit into the larger evolutionary picture – and, more broadly, how star formation occurred in high–redshift galaxies in general – resolved observations of the spatial distribution of the star formation are essential. However, studies based solely in the (rest–frame) optical/UV (e.g., Chapman et al., 2003b, 2005; Swinbank et al., 2010a; Chen et al., 2015) must contend with dust–obscuration, which can make such emission challenging to detect in the most highly star–forming galaxies, and where patchy reddening could potentially affect the apparent morphology, particularly in the rest–frame UV. Some studies therefore use the Plateau de Bure Interferometer (PdBI) and Karl G. Jansky Very Large Array (VLA) to target radio synchrotron emission, a potential proxy for star formation, or molecular line emission (CO), which traces the gas reservoirs required to fuel star formation, at sub-arcsecond resolution (0.2′′; e.g., Tacconi et al., 2010; Engel et al., 2010; Bothwell et al., 2010; Hodge et al., 2012, 2013a; Tacconi et al., 2013; Genzel et al., 2013; Aravena et al., 2014; Bolatto et al., 2015; Miettinen et al., 2015). The molecular gas studies in particular reveal large clumpy disks in both the more ‘normal’ high–redshift galaxies and even in some SMGs (Hodge et al., 2012), in apparent agreement with claims of kpc-scale star-forming regions in high-redshift galaxies from the rest-frame optical/UV (e.g., Elmegreen et al., 2004; Förster Schreiber et al., 2011; Guo et al., 2012, 2015) and H line emission (Genzel et al., 2011). Such massive kpc–scale clumps are thought to form in–situ by gravitational instability due to the gas–richness of these high–redshift galaxies (e.g., Dekel et al., 2009; Bournaud et al., 2014). Moreover, molecular gas observations can also provide valuable information on the kinematics of the systems. For example, based on observations of continuum and various CO transitions (up to CO[7–6]) in a sample of 12 SMGs, Engel et al. (2010) suggested that practically all SMGs are major mergers. However, such studies have been very expensive observationally, and in many cases at best marginally resolve the sources (see Carilli & Walter 2013 for a review).
A more direct way to trace the obscured star–forming regions in high–redshift galaxies is through observations of the dust continuum emission in the rest–frame far-infrared (FIR), corresponding to observed submillimeter wavelengths for sources at . The FIR dust continuum is dominantly powered by recently–formed, massive stars, making it an excellent tracer of the bolometric luminosity – and thus star formation – in dusty starbursts such as SMGs. While the resolution achievable by early submillimeter interferometric observations (e.g., Dannerbauer et al., 2008; Wang et al., 2011; Smolčić et al., 2012; Hodge et al., 2013b) was too poor (1′′) to sufficiently resolve high–redshift galaxies except for in a handful of cases (e.g., Younger et al., 2008; Hodge et al., 2012), recently there have been some first attempts to constrain the sizes of larger samples of SMGs – as well as massive dusty star–forming galaxies selected as likely progenitors of compact quiescent galaxies – in the submillimeter (e.g., Simpson et al., 2015b; Ikarashi et al., 2015; Barro et al., 2016), revealing compact ( kpc) dusty starbursts. However, how this star formation is distributed within the sources – e.g., whether it lies in clumpy disks or is strongly centrally peaked due to the violent and dissipative collapse expected from major merger remnants (Bournaud et al., 2011) – is still unknown. Moreover, only in rare cases of gravitational magnification (Swinbank et al., 2010b; Hatsukade et al., 2015) or case studies of single extreme sources (Hodge et al., 2015; Oteo et al., 2016) have individual star–forming regions in an SMG – or any high–redshift galaxy – been potentially resolved in the FIR. While seemingly consistent with the kpc–scale clumps observed in the rest–frame optical/UV and H/CO line emission, the reality of these low–S/N “clumps” – which are argued to play a key role in high–redshift galaxy formation and evolution – has not yet been confirmed.
With ALMA, the situation is now fundamentally changed. The long baselines and large number of antennas make it possible to resolve the star-forming regions in galaxies on scales of 1 kpc, similar to the resolution achievable for nearby galaxies with Herschel, and at a sensitivity sufficient to map the morphology of the emission. We therefore used ALMA to conduct high–resolution (0.16′′ FWHM) Band 7 (344 GHz) mapping of the (rest–frame) FIR–continuum in 17 SMGs selected from our ALMA Cycle 0 compact configuration survey of single–dish 344 GHz LABOCA sources detected in the Extended Chandra Deep Field South (ECDFS) by Weiß et al. (2009), constituting the largest, most homogenous, and highest–sensitivity sample of interferometrically observed SMGs to date (ALESS; Hodge et al., 2013b; Karim et al., 2013).
We begin in §2 with the details of the observations. Our results are presented in §3, followed by a discussion in §4. We summarize our conclusions in §5. Where applicable we assume a concordance, flat CDM cosmology of H0=71 km s-1 Mpc-1, =0.73, and =0.27 (Spergel et al., 2003, 2007). All magnitudes are on the AB system.
2. Observations and Data Reduction
2.1. Sample Selection & Observations
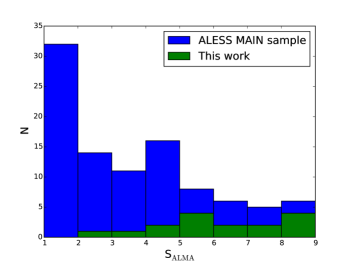
The ALMA observations analyzed here were taken between 11–27 Aug 2015 as part of our rolled–over Cycle 1 Project #2012.1.00307.S. We targeted 15 fields from our Cycle 0 ALESS survey (Hodge et al., 2013b), which itself observed 122 of the 126 single–dish–selected submillimeter sources originally detected in the LESS survey of the ECDFS (Weiß et al., 2009). The 15 fields were selected from 40 fields which, as of the Cycle 1 proposal deadline in early 2012, had either existing or forthcoming deep Hubble Space Telescope (HST) observations through CANDELS or our Cycle 20 HST program (Chen et al., 2015). Specifically, we selected the fields containing the submillimeter–brightest ALMA SMGs from the HST-covered fields, which were themselves randomly selected. Although some of the ALESS SMGs may be marginally resolved in the 1.6′′ (FWHM) Cycle 0 data along one or more axes (and only one source definitively so; Hodge et al., 2013b), no selection was made on source extent or morphology in the ALMA or HST images so as to avoid biasing the results. Four of the SMGs are associated with X–ray sources (ALESS 17.1, 45.1, 67.1, and 73.1; Wang et al., 2013). The flux density distribution for the sources targeted in this program compared with that for the entire ALESS Cycle 0 sample is shown in Figure 1, where we see that the sources targeted in this study are slightly brighter than the average SMGs.
As in our Cycle 0 ALESS program, we observed all fields with ALMA’s Band 7 centered at 344 GHz/870m to facilitate direct comparison of the measured flux densities. We utilized the “single continuum” spectral mode, with 4 128 dual polarization channels over the 8 GHz bandwidth. At this frequency, ALMA has a 17.3′′ primary beam (FWHM).
Three fields (LESS 1, 15 and 67) contained multiple SMGs detected in the Cycle 0 main ALESS catalog at 1.6′′ resolution, and four fields contained SMGs from the Cycle 0 supplementary catalog in addition to the primary source(s) from the main catalog (Hodge et al., 2013b). In all cases except for LESS 1, the ALMA beam was centered on the brightest Cycle 0 ALESS source in the field in order to maximize sensitivity for the high-resolution observations. As a result, the majority of the Cycle 0 supplementary sources fall outside the coverage of the ALMA beam. The observations presented here thus include 18 SMGs from the Cycle 0 main catalog and one SMG from the Cycle 0 supplementary catalog, or 19 SMGs in total (within the 17.3′′ FWHM of the primary beam).
The ALMA observations were requested in the C32-6 configuration and carried out with 46 antennas in an extended configuration (minimum baseline of 15m, maximum baseline of 1.6 km). The phase, flux, and bandpass calibrators were J03482749, J0334401, and J05223627, respectively, and the total integration time on each of the target fields was approximately 8 minutes. The phase stability/weather conditions were good, with a median PWV at zenith of 0.7 mm.
2.2. Data Reduction & Imaging
The ALMA data were reduced using the Common Astronomy Software Application111http://casa.nrao.edu (casa) version 4.3.1. The delivered reduction produced –data products of high quality and was therefore used without further modifications. The –data were imaged using casa version 4.3.1, with subsequent analysis carried out in casa version 4.5.0.
Imaging was carried out using the clean algorithm with a variety of different weightings and –taperings to explore the extent to which the sources were resolved by the observations and the total flux densities were recovered (see §2.3). The (compact configuration) Cycle 0 data were not co–added to the new data given the much poorer data quality and (in some cases) offset pointing centers. For the untapered maps, multi-scale clean (Cornwell, 2008) was employed using scales of [0′′, 0.3′′, 0.6′′, 1.2′′]. While the largest scale was set to approximately encompass the largest coherent structure visible in the maps, we found that the specific number and distribution of these scales did not significantly affect the results, in agreement with other studies (e.g., Rich et al., 2008).
All maps were cleaned interactively using 1.5′′ circular regions around sources with emission in clear excess (4–5) of the residuals. These sources were cleaned down to 2.5, a process which typically required 1–5 major clean cycles of 50 iterations each. The resulting images are 25.6′′ per side and have a pixel scale of 0.02′′, and the naturally weighted maps achieve a typical synthesized beam of 0.17′′0.15′′ and RMS noise of 64 Jy beam-1, corresponding to a rest–frame brightness temperature of T K at . A set of maps was also produced using Briggs weighting with a robust parameter of , resulting in a resolution of 0.12′′0.11′′ and typical RMS noise values of 130 Jy beam-1. We did not attempt to self-calibrate the data. The absolute flux calibration has an uncertainty of 10%, and this uncertainty is not included in the error bars for individual source flux densities.
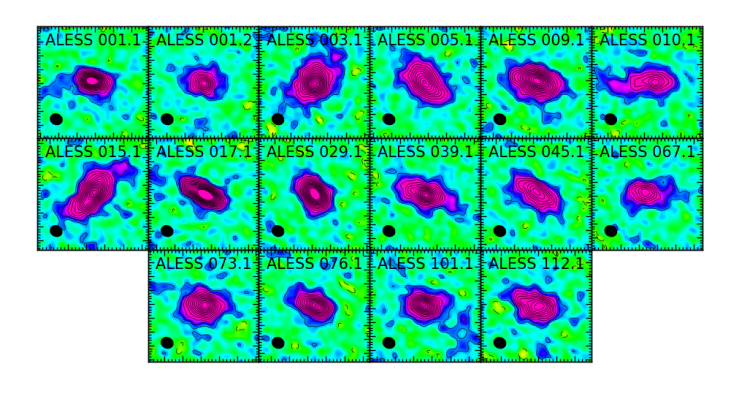
Of the 19 Cycle 0 SMGs targeted by this project, 16 were detected in the new ALMA data at very high (S/Npeak10) significance, allowing us to investigate the distribution of their dusty star formation. These SMGs have flux densities ranging from S mJy in our Cycle 0 data (1.6′′ FWHM). Of the three remaining SMGs, one (ALESS 1.3) was detected at lower significance (S/Npeak10) and two others (ALESS 15.3 and 67.2) were undetected. These sources had flux densities of 2.0 mJy and 1.7 mJy (corresponding to signal–to–noise (S/N) values of 3.8 and 4.2) in the Cycle 0 catalog, respectively, and based on the multi-wavelength data presented in Simpson et al. (2014), it is possible that ALESS 15.3 was spurious and ALESS 67.2 has been resolved out (see Chen et al. 2016, in preparation). In Figure 2, we show image cutouts for each of the 16 strongly detected SMGs in the naturally weighted maps (0.17′′0.15′′ FWHM resolution), where the extended nature of the SMGs is readily apparent. These sources span a redshift range , with a median redshift () and infrared luminosity () consistent with the sample as a whole ( and ; Simpson et al., 2014; Swinbank et al., 2014).
2.3. Recovered Flux Density
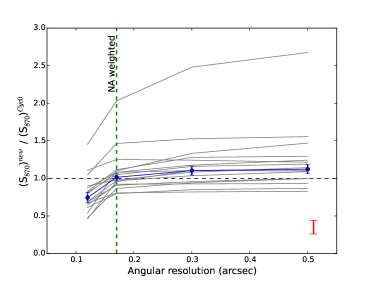
In order to test whether our new, higher-resolution ALMA images recover all of the flux density from the sources, we compared the images made at various spatial resolutions with the results obtained in Cycle 0 using a more compact configuration. The Cycle 0 flux densities were taken from Hodge et al. (2013b) and have been corrected for the effect of flux boosting (e.g., Simpson et al., 2015a), which is a statistical enhancement, on average, of the measured fluxes for populations where fainter sources far outnumber the brighter ones. In such cases, every measurement is more likely to result from one of many fainter sources than from one of few brighter ones relative to the measurement, and the effect is most pronounced for low S/N detections. For the new data imaged at a particular resolution, we calculated the flux density recovered by masking the emission below 2. For the untapered data, we then used the masks from the next lowest resolution to mask the higher-resolution images further (e.g., 0.3′′ masks for the 0.17′′ images; 0.17′′ masks for the 0.12′′ images). This combination of steps allowed us to isolate 2 contiguous emission associated with each detected source in an automated way, which we then summed using an aperture of radius 3, where is the FWHM (major axis) of the synthesized beam at that resolution.
Figure 3 shows the flux density recovered as a function of angular resolution (expressed as a fraction of the Cycle 0 flux density) for individual sources and the sample median. For most sources, the recovered fraction rises steeply from the highest resolution maps (0.1′′; median fraction of ) to the naturally weighted maps (0.16′′; median fraction of ). This indicates, at face value, that the naturally weighted maps are recovering all of the flux detected in the Cycle 0 maps. However, there appears to be a potentially small increase in the recovered fraction in the –tapered data, with median fractions of and in the 0.3′′ and 0.5′′ maps, respectively. This modest excess may in part be due to the uncertainty in the overall flux calibration between the datasets, which, when taken into account, yields a median recovered fraction in the –tapered data consistent with the Cycle 0 values. As the quality of the Cycle 0 data was much poorer (for example, the highest outlier in Figure 3 corresponds to supplementary source ALESS 101.1 from a lower quality map; Hodge et al., 2013b), we conclude that the true flux densities are better determined by the (new) tapered images. This suggests that the naturally weighted images are at most missing a fraction (10–15%) of the emission from what is presumably a more extended component (2′′). We conclude that, in general, the Cycle 1 observations do not appear to be formally resolving out emission due to the array configuration, consistent with the maximum recoverable scale expected for this configuration (2′′). We will investigate whether the emission potentially “missing” from the naturally weighted maps has any implications for the implied galaxy sizes in §3.1.2.
| Source ID | FWHMmajaaFWHM of the major axis derived from a two–dimensional Gaussian fit in the image plane. | bbAxis ratio from the two–dimensional Gaussian fit. | PAccPosition angle from the two–dimensional Gaussian fit. | FWHMcircddFWHM of a one–dimensional Gaussian fit to the azimuthally averaged profile in the image plane. | eeEffective (half–light) radius of the major axis from a two–dimensional Sérsic profile fit. The typical error ranges from 15–27%. | ffSérsic index from the two–dimensional Sérsic profile fit. The typical error is in the range 26–33%. | |
|---|---|---|---|---|---|---|---|
| [′′] | [kpc] | – | [deg] | [′′] | – | – | |
| ALESS 1.1 | 0.270.01 | 1.80.1 | 0.5 | 803 | 0.230.02 | 0.16 | 1.7 |
| ALESS 1.2 | 0.310.03 | 2.10.2 | 0.7 | 8017 | 0.340.03 | 0.23 | 2.4 |
| ALESS 3.1 | 0.380.02 | 2.60.1 | 0.7 | 13810 | 0.330.02 | 0.24 | 1.4 |
| ALESS 5.1 | 0.500.03 | 4.00.2 | 0.6 | 443 | 0.380.01 | 0.26 | 0.7 |
| ALESS 9.1 | 0.440.02 | 3.00.1 | 0.6 | 723 | 0.350.01 | 0.23 | 0.7 |
| ALESS 10.1 | 0.700.06 | 5.20.4 | 0.3 | 943 | 0.400.02 | 0.39 | 1.0 |
| ALESS 15.1 | 0.560.02 | 4.80.2 | 0.4 | 1402 | 0.390.02 | 0.31 | 0.9 |
| ALESS 17.1 | 0.400.02 | 3.50.1 | 0.3 | 621 | 0.290.02 | 0.20 | 0.5 |
| ALESS 29.1 | 0.310.01 | 2.70.1 | 0.6 | 353 | 0.260.01 | 0.16 | 0.7 |
| ALESS 39.1 | 0.470.03 | 3.90.2 | 0.4 | 734 | 0.320.02 | 0.27 | 1.2 |
| ALESS 45.1 | 0.510.04 | 4.30.3 | 0.4 | 562 | 0.370.01 | 0.26 | 0.5 |
| ALESS 67.1 | 0.440.04 | 3.70.3 | 0.5 | 896 | 0.320.02 | 0.25 | 1.2 |
| ALESS 73.1 | 0.360.02 | 2.40.1 | 0.7 | 899 | 0.340.02 | 0.20 | 1.0 |
| ALESS 76.1 | 0.330.02 | 2.50.2 | 0.5 | 643 | 0.270.01 | 0.17 | 0.6 |
| ALESS 101.1 | 0.320.02 | 2.50.2 | 0.6 | 807 | 0.270.02 | 0.27 | 2.5 |
| ALESS 112.1 | 0.450.03 | 3.80.2 | 0.6 | 704 | 0.360.01 | 0.22 | 0.5 |
3. RESULTS
3.1. The dust profiles of submillimeter galaxies
3.1.1 Image plane
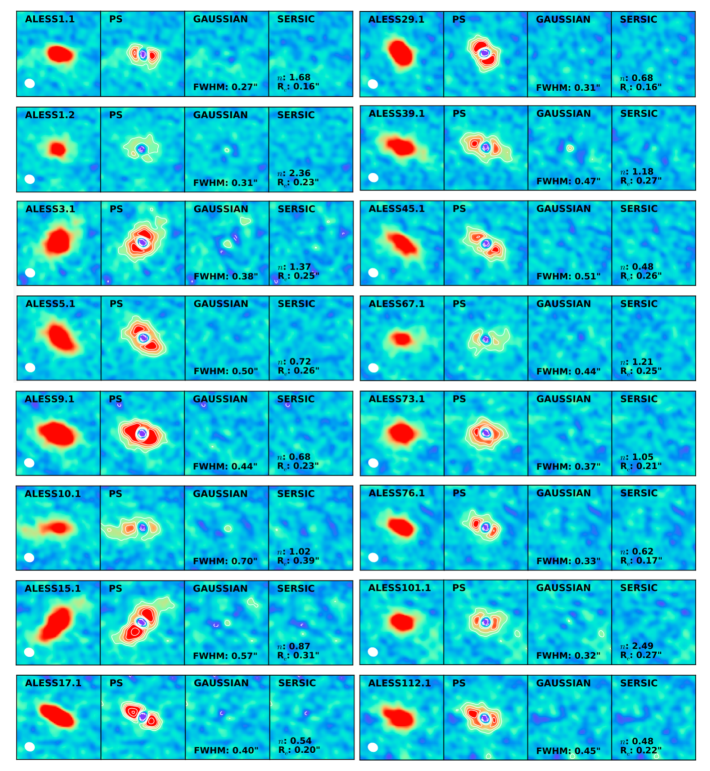
Figure 2 demonstrates that the dust-obscured star formation in these SMGs is extended on scales larger than our beam size (0.17′′0.15′′). Following Simpson et al. (2015b), we quantified the morphology and extent of the emission by fitting each source in the image plane with three models: (1) a point source (assuming the clean beam); (2) a two–dimensional Gaussian; and (3) a two–dimensional Sérsic profile. The residuals from the various fits are shown in Figure A1 in the Appendix. The point source fit is ruled out in all cases by 5 residuals. The parameters for the (deconvolved) two–dimensional Gaussian and Sérsic profile fits for all SMGs are listed in Table 1. While many of the SMGs appear elliptical, this is most likely due to inclination and optical depth effects. As such, we report the parameters for the fits along the major axis of each source, though we also quote the axis ratios from the Gaussian fits for completeness.
The median major axis size of the Gaussian fits is FWHM0.42′′0.04′′, and the median axis ratio is , where the errors on the median values were calculated via bootstrapping. The corresponding median physical size is FWHM3.20.4 kpc. In the majority (9/16) of the sources, there is no significant evidence (i.e., 3 residuals from the Gaussian model) that the extra degree of freedom required for the Sérsic profile fits is justified. The remaining sources show 3–5 residuals from the Gaussian model, indicating that the Sérsic profile is preferred. The median Sérsic profile has an index of 0.2 and an effective radius of ′′0.02′′, corresponding to a typical physical size of 0.2 kpc. Noting that a Gaussian fit is equivalent to a Sérsic profile fit with and FWHM2.02, the median Sérsic profile appears more centrally peaked than a Gaussian profile, and is consistent with an exponential disk. Only two SMGs (ALESS 1.2 and 101.1) have estimated Sérsic indices 2, indicating more centrally peaked emission. The four SMGs associated with X–ray sources (ALESS 17.1, 45.1, 67.1, and 73.1) have median parameters (′′0.02′′, 0.2) consistent with the full sample.
In order to test the robustness of the derived parameters, we inserted 10,000 model sources with S/N ratios similar to our observations into the naturally weighted maps to see how well we could recover their Sérsic parameters. The input parameters were drawn from uniform distributions with ranges , , and axis ratio . We find that the input parameters are well-recovered, with systematic biases at the 1% level. The 1 scatter is a function of the input parameters, ranging from 15–27% for the effective radius and 26–33% for the Sérsic index.
Finally, we create a deep composite image by combining 2′′ cutouts centered on the source centroids. Prior to the stacking, the individual sources were rotated to a common major axis. The best–fit two–dimensional Gaussian model has a FWHM of 0.40′′0.01′′, consistent with the median FWHM of the individual two–dimensional Gaussian fits. The best–fit Sérsic profile has a Sérsic index of and an effective radius of , again indicating that the light profile of the dust emission is consistent with that of an exponential disk.
3.1.2 –plane fits
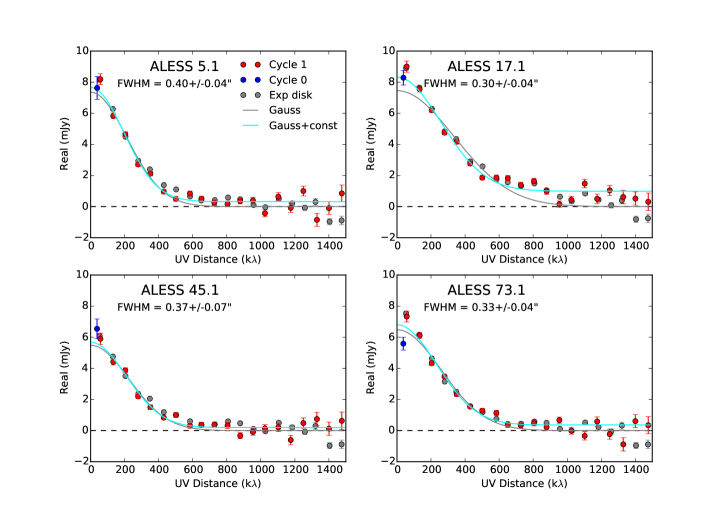
One way to address whether any flux “missing” from the naturally weighted images is having an impact on the source sizes measured in the image plane is to measure the sizes directly in the –plane. Figure 4 shows the –data for four isolated ALESS sources. The phase center of the new Cycle 1 datasets have been shifted to center exactly on the ALESS SMGs, and the data have then been radially averaged in bins of 75 k. Also shown are simulated profiles of smooth exponential disks () with the same flux densities, effective radii, and axial ratios as those of the sources, and with added noise.
To compare these data to the low-resolution Cycle 0 observations, we applied the same procedure to the Cycle 0 data, which have also been scaled by the response of the Cycle 0 primary beam at the position of the SMG. As the majority of the SMGs are unresolved in the Cycle 0 data, only the central data point is shown. There is indeed no evidence that the Cycle 1 data are missing any emission, in agreement with §2.3.
We then fit the Cycle 1 -profiles with two models: 1) a Gaussian, 2) a Gaussian plus a constant. The latter represents a point source (or point sources) in the image plane and was found to be necessary due to the signal evident at large –distances in the plots (particularly ALESS 17.1). We find that this point–source component makes up 5% of the total emission in ALESS 5.1, 45.1, and 73.1, but it constitutes 15% of the emission in ALESS 17.1. This is likely caused by the large ellipticity observed in ALESS 17.1, which is nearly unresolved along its minor axis in our map, combined with the fact that the shortest spacings play a larger role in the –plane fitting. The FWHM values resulting from the Gaussianconstant model are listed in Figure 4.
These sizes can be most directly compared to one-dimensional (circular) Gaussian fits from azimuthally averaged data in the image plane (Table 1). These values tend to be somewhat smaller on average than the 2D elliptical Gaussian fit values (median FWHM1D/FWHM2D0.790.07), reflecting the ellipticity of the emission observed in the individual sources. When we include a point source component in the –plane model, we find that the FWHM sizes derived from fitting in the image and –planes agree (within the uncertainties). From this test and those reported in the §A.1, we conclude that the sizes measured in the image plane are robust, and that they are unaffected by the presence of any potentially “missing” emission.
3.2. Comparison to stellar emission
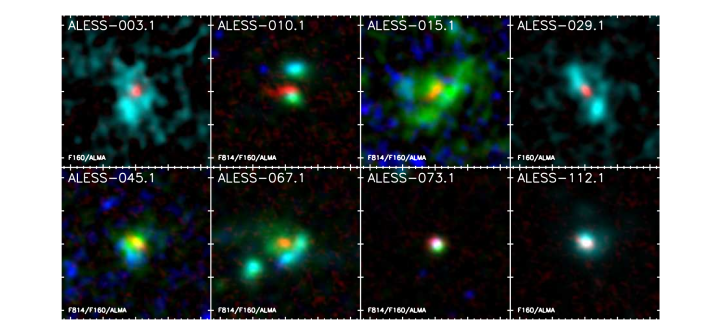
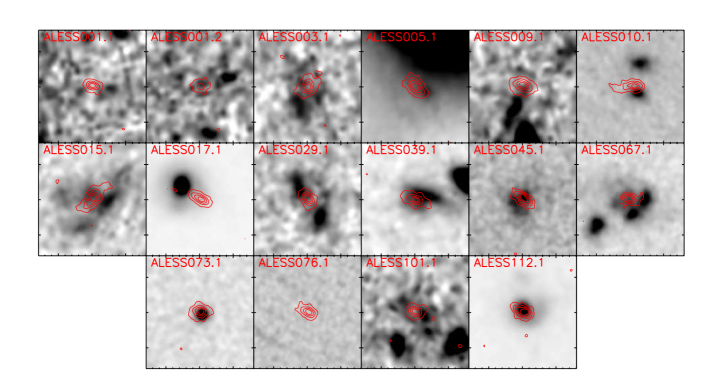
Our SMGs were selected to have HST WFC3 imaging at comparable (0.15′′) resolution in one or more bands, providing a less dust–sensitive probe (than optical imaging) of the stellar distribution on kpc scales. We tied the astrometry of the HST images to the IRAC images, and the relative astrometry between the HST and ALMA images is expected to be accurate to 0.1′′. False–color images constructed from a combination of the HST and ALMA data are shown as multi–band color images for a selection of SMGs with the most complete data in Figure 5, where a variety of stellar morphologies are observed. The 870m contours for the full sample are overplotted on the H160–band imaging in Figure A2. The source positions (and/or stellar environments) of ALESS 5.1 and 10.1 suggest these sources are potentially weakly lensed. In particular, the redshifts of the nearby bright H160–band counterparts suggest that these sources are at lower redshift, although we cannot rule out that they are mergers.
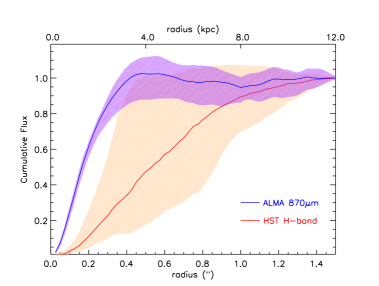
It is immediately clear from these comparisons that the obscured star formation traced by the dust emission is generally more compact than the stellar emission. To quantify this effect, the median curves of growth for the naturally weighted ALMA 870m maps and HST H160–band imaging are shown in Figure 6. These growth curves in both cases were calculated using a 1.5′′ radius aperture centered on the ALMA emission, assuming this is indicating the mass–weighted center of the system. The ALMA 870m curve dips below a cumulative fraction of 1.0 at large (0.6′′) radii due to the presence of negative sidelobes in the ALMA maps. Calculated in this way, the median half–light radius of the ALMA 870m emission is 0.16′′0.02′′, in agreement with the direct integration value given in §A.1, while the median half–light radius of the H160–band imaging is 0.5′′0.1′′ – a factor of three larger.
These comparison also clearly demonstrate the morphological contrast between the internal structure of the obscured and unobscured star formation. While we find evidence that the obscured star formation is distributed in smooth exponential disks at a resolution of 0.16′′, the stellar emission on the same scales appears very clumpy and irregular. Chen et al. (2015) studied the stellar morphologies of a larger sample of 48 ALESS SMGs (including those presented here) and reported that of the 80% detected in the H160–band down to a median sensitivity of H mag, 829% appear to have disturbed morphologies. This implies that the irregular stellar morphologies we observe are representative of the larger sample. Based on a statistical comparison with the lower–resolution Cycle 0 data, Chen et al. (2015) also reported an offset between the H160–band components and the dusty star–forming regions, which they argued could be due to either obscuration of the rest–frame optical/UV imaging or real misalignment between the dusty star–forming regions and the location of the majority of the unobscured stellar continuum emission within the SMGs. They argue that the latter scenario is more likely, given the lack of a difference between the low– and high–redshift subsamples, as the morphological –correction implies that the rest–frame UV emission traced in higher–redshift sources will be more sensitive to clumpy star–forming regions and dust obscuration. The present comparison demonstrates that the asymmetric, morphologically complex stellar emission indeed appears to be largely uncorrelated with the sites of the ongoing dusty star formation on a case–by–case basis, confirming that the misalignment is real.
We conclude that the obscured star formation traced by the ALMA 870m emission is both significantly smoother and more compact than the unobscured stellar emission. However, it is possible that the resolution of the current ALMA data (0.16′′; 1.3 kpc at ) is still slightly too coarse to resolve any potential clump–like structure. We investigate whether the dust emission shows evidence for clumpy structure as we push down to smaller spatial scales in the next section.
3.3. Clumps
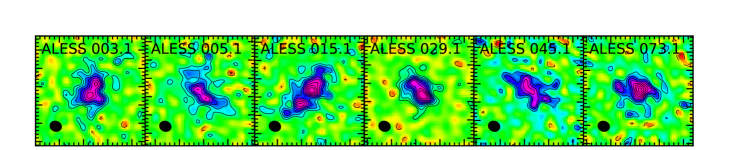
Massive (108–1010 M⊙) kpc–scale star–forming clumps have been argued to be an important feature of high-redshift galaxies, with observational evidence claimed for such clumps in the rest-frame UV (e.g., Elmegreen & Elmegreen, 2005; Guo et al., 2012), rest-frame optical (e.g., Elmegreen et al., 2009; Förster Schreiber et al., 2011), NIR integral field spectroscopy (e.g., Genzel et al., 2008, 2011), and potentially also CO and rest-frame FIR emission in a handful of the brightest and/or strongly lensed sources (e.g., Tacconi et al., 2010; Swinbank et al., 2010b, 2011; Hodge et al., 2012; Oteo et al., 2016). It has been proposed that these clumps form in–situ from the fragmentation of gravitationally unstable gas disks (e.g., Noguchi, 1998; Agertz et al., 2009; Bournaud et al., 2012), though it has also been suggested that some of the most massive clumps may be accreted cores of satellite galaxies (e.g., Mandelker et al., 2016; Oklopcic et al., 2016), and reconciling the existence of such clumps with the presence of certain stellar feedback recipes makes them an important testbed of feedback processes in galaxy formation (e.g., Mayer et al., 2016). To search for such clumps in our SMGs, we re-image the ALMA 870m data with a Briggs robust parameter of , resulting in a resolution of 0.12′′0.11′′. This results in almost a factor of two decrease in beam area over the “native” resolution, corresponding to physical scales of 1.00.9 kpc at 2.5. As a consequence, the typical RMS noise values in the maps approximately doubles to 130 Jy beam-1.
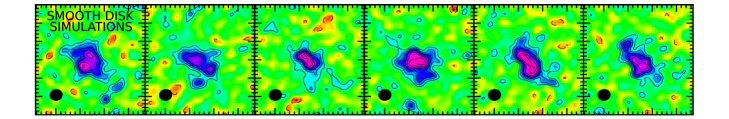
Figure 7 shows several examples of SMGs imaged in this way, where we have selected those which are clumpiest in appearance. It is tempting to conclude from a visual inspection that several of the SMGs break up into a small number of kpc–scale clumps. To test this, we used casa to simulate 16 observations of smooth exponential disks with the same angular resolution and noise levels as the observations in Figure 7. The parameters of the input model were tuned to the typical parameters observed in our SMGs: an effective radius of , an axis ratio of 0.5, and a total flux density of S mJy. Several examples of simulated maps are shown in Figure 7 along with the real data, where just as with the real data, we have selected those which are clumpiest in appearance. Indeed, many of the simulated exponential disks break up into a small number of closely-spaced emission peaks, similar to the observed high-resolution maps. This experiment highlights that caution should be exercised when identifying structure in high–resolution interferometric maps at this S/N level (S/N5–10).
As a more quantitative analysis, we fit each observed SMG with a 2D elliptical Gaussian and subtracted the resulting model of the smooth emission from the high-resolution map. We find that none of the SMGs have residual structure with peak fluxes 3. Of the six SMGs with residuals between 2.5–3, the strongest residual (2.9) is due to the possible structure to the East of the main peak in ALESS 73.1 (Figure 7).
Recognizing that any smooth contribution may be overestimated by this crude method, we note that in all of the sources except for ALESS 15.1, the candidate clumps are only distinct from each other at the 1–2 level even before the subtraction, again consistent with the smooth–disk simulations. The clump candidates in ALESS 15.1 (Figure 7) are the only candidates which are separated in brightness by 4 in the high-resolution maps. These candidates have peak flux densities of 0.8–1.0 mJy beam-1, integrated flux densities of 2.8–4.2 mJy, and FWHM areas of 2.3–2.8 kpc2 (assuming ; Simpson et al., 2014). If this structure is real, then scaling the total estimated star formation rate (130 M⊙ yr-1; Swinbank et al., 2014) by the ratio of the integrated flux density in each clump over that of the source as a whole gives star formation rate surface densities of 15–20 M⊙ yr-1 kpc-2 (c.f., Simpson et al., 2015b). It is possible that these two clump–like structures are the cores of merging galaxies, though we have no way to distinguish between these scenarios with the current data. We find no strong evidence for corresponding structure in the HST H160–band image (see Figure A2), though the counterpart is very faint. We conclude that while there may be a hint of clump–like dust emission in the current 870m data on kpc–scales, higher signal–to–noise observations at higher spatial resolution are required to confirm whether these clumpy structures are indeed real.
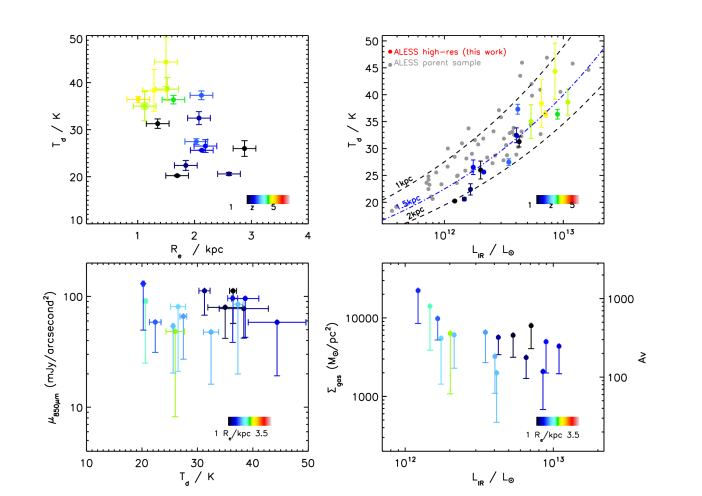
3.4. The – relation and gas surface densities
Infrared–luminous galaxies in the local (e.g., Chapin et al., 2009; Hwang et al., 2010) and high–redshift universe (e.g., Blain et al., 2003; Chapman et al., 2003a) have long been known to show a relation between their dust temperatures and infrared luminosities (the – relation). This relation is not due simply to selection effects, but is instead a consequence of the Stefan–Boltzmann law relating size, luminosity and dust temperature. We plot this relation as well as the – relation for our SMGs in Figure 8, where we have used the and values reported in Swinbank et al. (2014) for those sources without updated spectroscopic redshifts (Danielson et al. 2016, ApJ, submitted). The tracks plotted indicate different physical sizes of a perfect blackbody, and we assume optically thick radiation. We see that the physical scale of the dust emission correlates with redshift and dust temperature. We also see a strong – relation implying sizes of 1–2 kpc (with marginal evidence that the dust emission in higher–luminosity SMGs is more compact). The sizes we measure directly from the high–resolution maps (median 0.2 kpc) are in agreement with the predictions of this simple model. This result contrasts with the conclusion of Yan & Ma (2016) based on the modified blackbody equivalent of the Stefan–Boltzmann law applied to strongly lensed sources, where they suggested that the larger sizes measured for their high–redshift sources must be the result of blending. We note that when we use the modified blackbody equivalent of the Stefan–Boltzmann law instead for our sample, the sizes we measure are still consistent with the predictions (median ratio of /1.10.2).
We then used the resolved nature of our observations to search for correlations between dust/gas surface density and dust temperature/luminosity. Figure 8 shows 870m surface brightness as a function of dust temperature, where we include measurements of both the average and peak surface brightness in each galaxy. No trend is evident between the surface brightness and dust temperature. We have then converted these measurements to gas surface density by scaling the SED–derived dust mass and assuming a gas–to–dust ratio of 100. The corresponding extinction () values were calculated as in Güver & Özel (2009). The gas surface densities implied by our observations are very high – over two orders of magnitude higher than GMCs in the nearby universe (Solomon et al., 1987) – and similar to those found in local ULIRGs. There appears to be no trend between gas surface density/extinction and total infrared luminosity.
4. Discussion
The ALMA imaging presented here allows us to resolve the dust-obscured star formation in a sample of luminous high-redshift dusty star-forming galaxies on scales of 1 kpc. Sérsic profile fits reveal that the galaxies have a median effective radius of ′′0.02′′ at a rest wavelength of m (for a typical source redshift of ), corresponding to a typical physical size of 0.2 kpc. In contrast, Herschel 70–160m imaging of 400 local galaxies and QSO hosts suggests that ULIRGs are exclusively found with very compact ( kpc) morphologies (albeit at shorter rest wavelengths of m; Lutz et al., 2016). This confirms earlier suggestions from CO observations and marginally resolved radio and submillimeter data (e.g., Chapman et al., 2004; Ivison et al., 2010, 2011; Carilli et al., 2010; Hodge et al., 2013a; Simpson et al., 2015b; Ikarashi et al., 2015; Miettinen et al., 2015) that high-redshift dusty star-forming galaxies are indeed larger than similarly luminous local galaxies.
In addition to the observed sizes, the observations presented here resolve the dust emission over many beams at relatively high S/N, allowing us to constrain the more detailed morphology. In particular, there have been a number of claims in the literature that, when observed at high–resolution, the gas reservoirs of SMGs break up into sub–kpc or kpc–sized clumps (e.g., Tacconi et al., 2010; Swinbank et al., 2011; Hodge et al., 2012; Hatsukade et al., 2015). Assuming a constant dust–to–gas ratio – i.e., that the dust follows the gas – the dust distribution should then be similarly clumpy. Such clumpy dust within a rotating gas disk was potentially observed in, for example, the strongly lensed “Eyelash” galaxy by Swinbank et al. (2010b), seeming to confirm this theory. In contrast, we find that the SMGs observed here appear (within the limits of our current resolution and sensitivity) to be smooth and disk–like on kpc–scales, with a median Sérsic index of . Combined with the measured sizes (0.2 kpc), this seems to rule out the sort of extended, clumpy disk galaxies predicted by simulations of violent disk instability (e.g., Dekel et al., 2009; Bournaud et al., 2014) and observed in optically–bright systems (e.g., Förster Schreiber et al., 2006) and potentially even in the ultraluminous SMG GN20 (Hodge et al., 2012, 2015). The relative uniformity of the dust morphologies observed here also seems to contradict models where SMGs are a heterogenous population (e.g., Hayward et al., 2011, 2012), although larger sample sizes covering a larger range of flux densities are required to more thoroughly test this conclusion.
It is, of course, still possible that there is clump–like structure below our current resolution limits. The clumps in the Eyelash and SDP.81 are reported to have physical sizes of only a couple hundred pc (Swinbank et al., 2010b; Hatsukade et al., 2015). Similarly, the dust continuum in the most well-studied local ULIRG, Arp 220, is concentrated in two very compact (30–50 pc) nuclei situated 300 pc apart (although at longer rest-frame wavelengths; e.g., Sakamoto et al., 2008; Barcos-Muñoz et al., 2015; Scoville et al., 2016). We would not be able to resolve the nuclei of Arp 220 at a redshift of with the present observations, and indeed, we may find a hint of clump–like structure in one of our SMGs when we push down to (sub–)kpc scales. However, the simulations and analysis in §3.3 suggest that caution should be exercised when identifying candidate clumps in even moderate S/N interferometric data. Indeed, the sizes we measure from the high–resolution images are consistent with those predicted from the Stefan–Boltzmann law based on the the measured dust temperatures and FIR luminosities, another indication that the emission is relatively smooth. The measured sizes also agree with those estimated from fitting models assuming power–law mass–temperature distributions, again assuming smooth disk emission (Kovács et al., 2010). Significantly higher–S/N observations at higher resolution are required to determine whether the dust emission in these SMGs retains a disk–like appearance on sub–kpc scales.
In contrast to the smooth appearance of the obscured star formation, the matched–resolution HST WFC3 imaging of these SMGs – tracing the unobscured rest–frame optical light – appears clumpy and irregular. The median half–light radius observed for the unobscured stellar emission in these sources corresponds to kpc at , implying that the pre–existing stellar distributions of the SMGs are also significantly more extended than the dust emission. A similar conclusion was drawn regarding the morphology and extent of the stellar component for the larger sample of 48 ALESS SMGs presented by Chen et al. (2015), indicating that stellar morphologies observed in our sources are representative of the parent population. The current study reveals that this unobscured stellar emission is largely uncorrelated with the obscured star-forming regions in individual sources. This observation implies that SED fitting routines assuming a simple dust screen over a single or even composite stellar population may be too simplistic.
The difference observed between the morphology of the obscured star formation and unobscured stellar emission in these SMGs also leads us to consider their formation scenario. Chen et al. (2015) use the apparently disturbed rest–frame optical morphologies, along with the short expected lifetimes of SMGs, to argue that the majority of SMGs are early/mid–stage major mergers, as has been argued previously on the basis of, e.g., radio and submillimeter multiplicity and kinematics (e.g., Swinbank et al., 2006; Engel et al., 2010). Theoretically, the profiles of merger remnants are expected to be relatively compact and strongly centrally peaked due to the violent and dissipative collapse expected in turbulent and clumpy gas (e.g., Bournaud et al., 2011). The small sizes of the dust disks we measure could be consistent with this scenario, though the observed Sérsic indices are lower than expected in the simulations.
If the starbursts in these galaxies are major merger driven, we are likely observing the result of the gas/dust more rapidly (re–)forming disk structures than the existing stellar component. Assuming a typical gas consumption timescale for SMGs of 100 Myr (Bothwell et al., 2013), and based on the apparent dynamical (orbital) timescales (20 Myr) implied assuming velocity widths of 500 km s-1 (Bothwell et al., 2013) and the effective radii measured here, it is possible that the disks have settled while the burst of star formation is still ongoing. It is possible that the more compact stellar counterparts observed in some sources (Figure 5) then correspond to more evolved systems. Simulations show that the old stars present in the existing stellar component may also contract due to the turbulent dissipation of the gas and young stars, which can contain a large fraction of the total mass (Bournaud et al., 2011). The current bursts of star formation thus have the potential to transform both the observed galaxy sizes and the overall light profiles as they evolve.
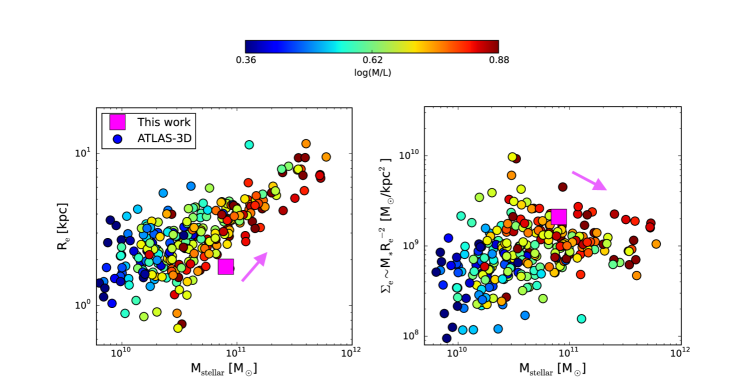
This transformation could also help establish the connection between SMGs and local elliptical galaxies, their proposed descendants (e.g., Eales et al., 1999; Swinbank et al., 2006; Ikarashi et al., 2015). In Figure 9, we compare the properties of the ALESS SMGs studied in this work with the volume–limited ATLAS3D sample of nearby early–type galaxies (Cappellari et al., 2011). The stellar masses, effective radii, and mass surface densities for the ATLAS3D galaxies are discussed in Cappellari et al. (2013). The median properties222We show the median properties of the ALESS SMGs as there can be significant scatter among individual galaxies. of the ALESS SMGs from this work are overplotted, where we use the average gas mass surface densities (Figure 8). If we assume an average stellar mass of M 81010 M⊙ (Simpson et al., 2014) and a gas mass of M 51010 M⊙ (Bothwell et al. 2013; consistent with that derived from the dust masses for our sources), then the descendants of these SMGs would have total masses of M 1–21011 M⊙ (assuming 100% star formation efficiency in the disk). If we then assume sizes of 2–3 kpc (taking the weighted average of the submillimeter and optical sizes, and assuming the stellar components may also contract further; Bournaud et al., 2011), we can estimate how the descendants of SMGs may compare to local early–type galaxies. We find that the SMG descendants have stellar masses, effective radii, and average gas surface densities consistent with the most compact massive (M 1–21011 M⊙) early–type galaxies – with the highest M/L ratios – observed locally (Figure 9).
5. Summary
We have presented high-resolution (0.16′′; 1.3 kpc at ) 870m ALMA imaging of 16 luminous ALESS SMGs, allowing us to clearly resolve the dust-obscured star formation in these galaxies on 1 kpc scales. The median light profile has an effective radius of ′′0.02′′ (corresponding to a typical physical size of 0.2 kpc) and a Sérsic index of 0.2, implying that the dust emission and, by implication, the obscured star formation is remarkably disk-like at the current resolution and sensitivity. We present a series of tests in the image and –planes to confirm that the fraction (10–15%) of emission that may be potentially “missing” from the naturally weighted maps does not bias our conclusions regarding the light profiles or sizes. Our results confirm earlier suggestions that high-redshift dusty star-forming galaxies are indeed larger than similarly luminous local galaxies.
We find that the present observations paint a different picture to the disturbed morphologies observed in the stellar distributions of the SMGs traced by HST H160-band imaging. In particular, the extended, morphologically complex stellar emission appears to be largely uncorrelated with the sites of the ongoing dusty star formation. This observation has implications for SED fitting routines assuming a simple dust screen over a single composite stellar population.
To search for clump–like structure in the dust–obscured star formation, we use different weighting schemes with the visibilities to probe scales of 0.12′′ (1.0 kpc), but we find no significant evidence for clumping in the majority of cases. Indeed, we demonstrate that the observed morphologies are generally consistent with those seen in simulated interferometric images of smooth exponential disks at similar (moderate) S/N. This experiment highlights that caution should be exercised when identifying structure in high–resolution interferometric maps at this S/N level (S/N5–10). While the present observations suggest that kpc–scale clumps of dust (and cool gas) are rare in these systems, higher–S/N observations of the dust-obscured star formation and molecular gas at higher resolution will be crucial in order to test whether the apparently smooth dust (and by implication, gas) distribution becomes more structured on sub–kpc scales.
We examine a number of correlations between physical parameters for these SMGs, including the well-known – relation, and we find that the source sizes we measure directly from the high–resolution maps are consistent with those predicted by this simple relation. This agreement is another indication that the emission is relatively smooth. While the physical scale of the dust emission appears to correlate with dust temperature and redshift, no trend is evident between the surface brightness and dust temperature, nor between gas surface density/extinction and total infrared luminosity. The gas surface densities implied by our observations are significantly higher than GMCs in the nearby universe, and similar to those found in local ULIRGs.
The lack of clumps in the obscured star formation, in combination with the compact sizes, seems to rule out the sort of extended, clumpy disk galaxies predicted by simulations of violent disk instability (e.g., Dekel et al., 2009; Bournaud et al., 2014). The compact nature of the obscured star formation compared to the existing stellar component may instead suggest that the bursts are fueled by major mergers, although the exponential light profiles we observe are seemingly inconsistent with the spheroids that are thought to result from the highly dissipative collapse. The relative uniformity in the observed dust morphologies may contradict suggestions of a heterogeneous SMG population, although larger samples of galaxies covering a wider range of flux densities are required to thoroughly test this conclusion, as these models suggest that the observed morphology is a function of SMG flux density.
Given the stark contrast between the observed dust and stellar morphologies, we suggest that the current bursts of star formation have the potential to transform both the observed galaxy sizes and the overall light profiles as they evolve. This transformation could help establish the connection between high–redshift SMGs and red–and–dead local elliptical galaxies, their proposed descendants. We compare the observed properties of our SMGs to the volume–limited sample of ATLAS3D nearby early–type galaxies, and we suggest that the likely descendants of SMGs have average properties – including stellar masses, effective radii, and gas surface densities – that are consistent with the most compact massive (M 1–21011 M⊙) early–type galaxies observed locally.
.1. A.1. Robustness of parameters
While the analysis in §2.3 shows that the low-resolution Cycle 0 estimated flux density for each SMG is recovered in the new data, the difference between the –tapered and naturally weighted (0.16′′ FWHM synthesized beam) images of the new data implies that the latter may be insensitive to a fraction (10–15%) of the emission from what is presumably a more extended component. In order to test whether this is affecting the parameters derived in the previous section, we have carried out a series of tests in the image plane.
As the first test, we fit two-dimensional Gaussian and Sérsic profiles to the data –tapered to 0.3′′. This tapering should recover the flux potentially “missing” from the naturally weighted maps (see §2.3) but present on the shortest baselines without degrading the image quality more than necessary. The Gaussian fits have a median major axis size of FWHM0.42′′0.04′′, and the Sérsic profile fits have a median index of 0.3 and an effective radius of ′′0.05′′. These values are all consistent with the profiles derived from the naturally weighted maps.
As a second test, we computed the half–light radii for the sources in the naturally weighted maps by simply determining the radius within which half the light is contained – i.e., with no preference for a particular profile. We then repeated this exercise using the total flux estimates from the –tapered maps in the denominator, and conservatively assuming that this flux lies entirely outside the measured radii. The median half–light radii determined in this manner are ′′0.02′′ and ′′0.02′′, respectively – showing excellent agreement.
As a third test, we took the naturally weighted images and added 15% of the emission in a 1′′–diameter uniform disk around each source. We then re-fit the images with two–dimensional Gaussian and Sérsic profiles. The resulting Gaussian fits have a median major axis size of FWHM0.45′′0.03′′, and the Sérsic profile fits have a median index of 0.3 and an effective radius of ′′0.01′′. These results are again consistent with the values measured from the naturally weighted maps, indicating no significant bias in the measured properties as a result of any flux potentially “missing” from the images up to the maximum estimated fraction of 10–15%.
References
- Agertz et al. (2009) Agertz, O., Teyssier, R., & Moore, B. 2009, MNRAS, 397, L64
- Aravena et al. (2014) Aravena, M., Hodge, J. A., Wagg, J., et al. 2014, MNRAS, 442, 558
- Barcos-Muñoz et al. (2015) Barcos-Muñoz, L., Leroy, A. K., Evans, A. S., et al. 2015, ApJ, 799, 10
- Barro et al. (2016) Barro, G., Kriek, M., Pérez-González, P. G., et al. 2016, ApJ, 827, L32
- Blain et al. (2003) Blain, A. W., Barnard, V. E., & Chapman, S. C. 2003, MNRAS, 338, 733
- Blain et al. (2002) Blain, A. W., Smail, I., Ivison, R. J., et al. 2002, Phys. Rep., 369, 111
- Bolatto et al. (2015) Bolatto, A. D., Warren, S. R., Leroy, A. K., et al. 2015, ApJ, 809, 175
- Bothwell et al. (2013) Bothwell, M. S., Smail, I., Chapman, S. C., et al. 2013, MNRAS, 429, 3047
- Bothwell et al. (2010) Bothwell, M. S. et al. 2010, MNRAS, 405, 219
- Bournaud (2016) Bournaud, F. 2016, Galactic Bulges, 418, 355
- Bournaud et al. (2011) Bournaud, F., Chapon, D., Teyssier, R., et al. 2011, ApJ, 730, 4
- Bournaud et al. (2012) Bournaud, F., Juneau, S., Le Floc’h, E., et al. 2012, ApJ, 757, 81
- Bournaud et al. (2014) Bournaud, F., Perret, V., Renaud, F., et al. 2014, ApJ, 780, 57
- Cappellari et al. (2011) Cappellari, M., Emsellem, E., Krajnović, D., et al. 2011, MNRAS, 413, 813
- Cappellari et al. (2013) Cappellari, M., McDermid, R. M., Alatalo, K., et al. 2013, MNRAS, 432, 1862
- Carilli et al. (2010) Carilli, C. L., Daddi, E., Riechers, D., et al. 2010, ApJ, 714, 1407
- Carilli & Walter (2013) Carilli, C. L. & Walter, F. 2013, ARA&A, 51, 105
- Casey et al. (2014) Casey, C. M., Narayanan, D., & Cooray, A. 2014, ArXiv e-prints
- Chapin et al. (2009) Chapin, E. L., Hughes, D. H., & Aretxaga, I. 2009, MNRAS, 393, 653
- Chapman et al. (2005) Chapman, S. C., Blain, A. W., Smail, I., & Ivison, R. J. 2005, ApJ, 622, 772
- Chapman et al. (2003a) Chapman, S. C., Helou, G., Lewis, G. F., & Dale, D. A. 2003a, ApJ, 588, 186
- Chapman et al. (2004) Chapman, S. C., Smail, I., Windhorst, R., et al. 2004, ApJ, 611, 732
- Chapman et al. (2003b) Chapman, S. C., Windhorst, R., Odewahn, S., Yan, H., & Conselice, C. 2003b, ApJ, 599, 92
- Chen et al. (2015) Chen, C.-C., Smail, I., Swinbank, A. M., et al. 2015, ApJ, 799, 194
- Cornwell (2008) Cornwell, T. J. 2008, IEEE Journal of Selected Topics in Signal Processing, 2, 793
- Daddi et al. (2007a) Daddi, E., Alexander, D. M., Dickinson, M., et al. 2007a, ApJ, 670, 173
- Daddi et al. (2010) Daddi, E., Bournaud, F., Walter, F., et al. 2010, ApJ, 713, 686
- Daddi et al. (2004) Daddi, E., Cimatti, A., Renzini, A., et al. 2004, ApJ, 617, 746
- Daddi et al. (2007b) Daddi, E. et al. 2007b, ApJ, 670, 156
- Dannerbauer et al. (2008) Dannerbauer, H., Walter, F., & Morrison, G. 2008, ApJ, 673, L127
- Davé et al. (2010) Davé, R., Finlator, K., Oppenheimer, B. D., Fardal, M., Katz, N., Kereš, D., & Weinberg, D. H. 2010, MNRAS, 404, 1355
- Dekel et al. (2009) Dekel, A., Sari, R., & Ceverino, D. 2009, ApJ, 703, 785
- Dekel et al. (2013) Dekel, A., Zolotov, A., Tweed, D., Cacciato, M., Ceverino, D., & Primack, J. R. 2013, MNRAS, 435, 999
- Eales et al. (1999) Eales, S., Lilly, S., Gear, W., et al. 1999, ApJ, 515, 518
- Elmegreen et al. (2008) Elmegreen, B. G., Bournaud, F., & Elmegreen, D. M. 2008, ApJ, 688, 67
- Elmegreen & Elmegreen (2005) Elmegreen, B. G. & Elmegreen, D. M. 2005, ApJ, 627, 632
- Elmegreen et al. (2009) Elmegreen, B. G., Elmegreen, D. M., Fernandez, M. X., & Lemonias, J. J. 2009, ApJ, 692, 12
- Elmegreen et al. (2004) Elmegreen, D. M., Elmegreen, B. G., & Sheets, C. M. 2004, ApJ, 603, 74
- Engel et al. (2010) Engel, H. et al. 2010, ApJ, 724, 233
- Förster Schreiber et al. (2011) Förster Schreiber, N. M., Shapley, A. E., Genzel, R., et al. 2011, ApJ, 739, 45
- Förster Schreiber et al. (2006) Förster Schreiber, N. M. et al. 2006, ApJ, 645, 1062
- Genzel et al. (2011) Genzel, R., Newman, S., Jones, T., et al. 2011, ApJ, 733, 101
- Genzel et al. (2010) Genzel, R., Tacconi, L. J., Gracia-Carpio, J., et al. 2010, MNRAS, 407, 2091
- Genzel et al. (2013) Genzel, R., Tacconi, L. J., Kurk, J., et al. 2013, ApJ, 773, 68
- Genzel et al. (2008) Genzel, R. et al. 2008, ApJ, 687, 59
- Guo et al. (2015) Guo, Y., Ferguson, H. C., Bell, E. F., et al. 2015, ApJ, 800, 39
- Guo et al. (2012) Guo, Y., Giavalisco, M., Ferguson, H. C., Cassata, P., & Koekemoer, A. M. 2012, ApJ, 757, 120
- Güver & Özel (2009) Güver, T. & Özel, F. 2009, MNRAS, 400, 2050
- Hatsukade et al. (2015) Hatsukade, B., Tamura, Y., Iono, D., Matsuda, Y., Hayashi, M., & Oguri, M. 2015, PASJ, 67, 93
- Hayward et al. (2012) Hayward, C. C., Jonsson, P., Kereš, D., et al. 2012, MNRAS, 424, 951
- Hayward et al. (2011) Hayward, C. C., Kereš, D., Jonsson, P., et al. 2011, ApJ, 743, 159
- Hodge et al. (2012) Hodge, J. A., Carilli, C. L., Walter, F., et al. 2012, ApJ, 760, 11
- Hodge et al. (2013a) —. 2013a, ApJ, 776, 22
- Hodge et al. (2013b) Hodge, J. A., Karim, A., Smail, I., et al. 2013b, ApJ, 768, 91
- Hodge et al. (2015) Hodge, J. A., Riechers, D., Decarli, R., et al. 2015, ApJ, 798, L18
- Hwang et al. (2010) Hwang, H. S., Elbaz, D., Magdis, G., et al. 2010, MNRAS, 409, 75
- Ikarashi et al. (2015) Ikarashi, S., Ivison, R. J., Caputi, K. I., et al. 2015, ApJ, 810, 133
- Ivison et al. (2011) Ivison, R. J., Papadopoulos, P. P., Smail, I., et al. 2011, MNRAS, 412, 1913
- Ivison et al. (2010) Ivison, R. J., Smail, I., Papadopoulos, P. P., et al. 2010, MNRAS, 404, 198
- Karim et al. (2013) Karim, A., Swinbank, A. M., Hodge, J. A., et al. 2013, MNRAS, 432, 2
- Kereš et al. (2009a) Kereš, D., Katz, N., Davé, R., Fardal, M., & Weinberg, D. H. 2009a, MNRAS, 396, 2332
- Kereš et al. (2009b) Kereš, D., Katz, N., Fardal, M., Davé, R., & Weinberg, D. H. 2009b, MNRAS, 395, 160
- Kereš et al. (2005) Kereš, D., Katz, N., Weinberg, D. H., & Davé, R. 2005, MNRAS, 363, 2
- Kovács et al. (2010) Kovács, A., Omont, A., Beelen, A., et al. 2010, ApJ, 717, 29
- Lutz et al. (2016) Lutz, D., Berta, S., Contursi, A., Förster Schreiber, N. M., Genzel, R., Graciá-Carpio, J., Herrera-Camus, R., Netzer, H., Sturm, E., Tacconi, L. J., Tadaki, K., & Veilleux, S. 2016, A&A, 591, A136
- Mandelker et al. (2016) Mandelker, N., Dekel, A., Ceverino, D., DeGraf, C., Guo, Y., & Primack, J. 2016, MNRAS
- Mayer et al. (2016) Mayer, L., Tamburello, V., Lupi, A., Keller, B., Wadsley, J., & Madau, P. 2016, ArXiv e-prints
- Miettinen et al. (2015) Miettinen, O., Novak, M., Smolčić, V., et al. 2015, A&A, 584, A32
- Narayanan et al. (2010) Narayanan, D., Hayward, C. C., Cox, T. J., et al. 2010, MNRAS, 401, 1613
- Narayanan et al. (2015) Narayanan, D., Turk, M., Feldmann, R., et al. 2015, Nature, 525, 496
- Noguchi (1998) Noguchi, M. 1998, Nature, 392, 253
- Oklopcic et al. (2016) Oklopcic, A., Hopkins, P. F., Feldmann, R., Keres, D., Faucher-Giguere, C.-A., & Murray, N. 2016, ArXiv e-prints
- Oteo et al. (2016) Oteo, I., Ivison, R. J., Dunne, L., et al. 2016, ApJ, 827, 34
- Rich et al. (2008) Rich, J. W., de Blok, W. J. G., Cornwell, T. J., et al. 2008, AJ, 136, 2897
- Sakamoto et al. (2008) Sakamoto, K., Wang, J., Wiedner, M. C., et al. 2008, ApJ, 684, 957
- Sanders & Mirabel (1996) Sanders, D. B. & Mirabel, I. F. 1996, ARA&A, 34, 749
- Scoville et al. (2016) Scoville, N., Murchikova, L., Walter, F., et al. 2016, ArXiv e-prints
- Shapiro et al. (2008) Shapiro, K. L. et al. 2008, ApJ, 682, 231
- Simpson et al. (2015a) Simpson, J. M., Smail, I., Swinbank, A. M., et al. 2015a, ApJ, 807, 128
- Simpson et al. (2015b) —. 2015b, ApJ, 799, 81
- Simpson et al. (2014) Simpson, J. M., Swinbank, A. M., Smail, I., et al. 2014, ApJ, 788, 125
- Smolčić et al. (2012) Smolčić, V., Aravena, M., Navarrete, F., et al. 2012, A&A, 548, A4
- Solomon et al. (1987) Solomon, P. M., Rivolo, A. R., Barrett, J., & Yahil, A. 1987, ApJ, 319, 730
- Solomon & Vanden Bout (2005) Solomon, P. M. & Vanden Bout, P. A. 2005, ARA&A, 43, 677
- Spergel et al. (2003) Spergel, D. N. et al. 2003, ApJS, 148, 175
- Spergel et al. (2007) —. 2007, ApJS, 170, 377
- Steidel et al. (2004) Steidel, C. C., Shapley, A. E., Pettini, M., Adelberger, K. L., Erb, D. K., Reddy, N. A., & Hunt, M. P. 2004, ApJ, 604, 534
- Swinbank et al. (2006) Swinbank, A. M., Chapman, S. C., Smail, I., et al. 2006, MNRAS, 371, 465
- Swinbank et al. (2011) Swinbank, A. M., Papadopoulos, P. P., Cox, P., et al. 2011, ApJ, 742, 11
- Swinbank et al. (2014) Swinbank, A. M., Simpson, J. M., Smail, I., et al. 2014, MNRAS, 438, 1267
- Swinbank et al. (2010a) Swinbank, A. M., Smail, I., Chapman, S. C., Borys, C., Alexander, D. M., Blain, A. W., Conselice, C. J., Hainline, L. J., & Ivison, R. J. 2010a, MNRAS, 405, 234
- Swinbank et al. (2012) Swinbank, A. M., Sobral, D., Smail, I., et al. 2012, MNRAS, 426, 935
- Swinbank et al. (2010b) Swinbank, A. M. et al. 2010b, Nature, 464, 733
- Tacconi et al. (2013) Tacconi, L. J., Neri, R., Genzel, R., et al. 2013, ApJ, 768, 74
- Tacconi et al. (2010) Tacconi, L. J. et al. 2010, Nature, 463, 781
- Wang et al. (2013) Wang, S. X., Brandt, W. N., Luo, B., et al. 2013, ApJ, 778, 179
- Wang et al. (2011) Wang, W.-H., Cowie, L. L., Barger, A. J., & Williams, J. P. 2011, ApJ, 726, L18
- Weiß et al. (2009) Weiß, A. et al. 2009, ApJ, 707, 1201
- Yan & Ma (2016) Yan, H. & Ma, Z. 2016, ApJ, 820, L16
- Younger et al. (2008) Younger, J. D. et al. 2008, ApJ, 688, 59