Raman study of the vibrational modes in ZnGeN2 (0001)
Abstract
A Raman spectroscopy study was carried out for ZnGeN2 with direction of propagation along the (0001) crystallographic direction on hexagonal single crystal platelets obtained by reaction of gaseous ammonia with a Zn-Ge-Sn liquid alloy at 758 ∘C. The sample geometry allowed measurement of the and Raman modes. First-principles calculations were carried out of the spectra. Measurements with crossed polarizers yielded spectra that agreed well with first-principles calculations of the modes. Measurements with parallel polarizers should in principle provide the modes. However, for most of the Raman modes, the LO-TO splitting was calculated to be very small, and for the few modes which were predicted to have larger LO-TO splittings, the LO mode was not observed. This absence is tentatively explained in terms of overdamped LO-plasmon coupling. LO-TO mode crossing was identified by comparing the calculated eigenvectors and intensities of individual modes. Some features in the experimental spectra were identified as arising from critical points in the phonon density of states and are indicative of the degree of disorder on the cation lattice.
pacs:
78.30.Fs,63.20.dkI Introduction
ZnGeN2 is a heterovalent ternary analogue of wurtzite GaN, obtained conceptually by substitution of each pair of Ga atoms, belonging to group III, by a Zn (group II) and Ge (group IV) atom. There has been increasing interest lately in the heterovalent ternary nitrides. This interest is motivated in part by the search for alternatives to the binary nitrides that would be composed entirely of abundant elements. In addition, the increased complexity of the compounds offers opportunities for developing doping strategies, engineering defects, and tailoring properties, that are not available in the simpler, binary nitrides. The prospect of combining the two families of materials in heterostructures offers additional opportunities. For example, while the band gap of ZnGeN2 is within 100 meV or so of that of GaN, the band offset is predicted to to be as large as 40 percent of the band gap.Punya and Lambrecht (2013) This situation offers the prospect of designing novel nitride heterostructures based upon the type-II character of the interface, taking advantage also of the close lattice match and similar optimal growth temperatures of the two materials.Han et al. (2014)
The increased complexity of the lattice, compared to the binary nitrides, also presents a possibly more difficult task when attempting to determine fundamental properties of the materials. Depending on the growth conditions, ZnGeN2 may exhibit either a disordered (wurtzite-like) or ordered structure.Blanton et al. (2013) In a recent paper, it was shown that even the disordered phase may obey locally the octet rule of having exactly two Zn atoms and two Ge atoms as nearest neighbors of each N atom.Quayle et al. (2015) This phase involves a disordered mixture at the atomic scale of two stacking arrangements of rows of atoms in the basal plane, each row containing alternating Zn and Ge atoms, corresponding to two simple ordering schemes with space groups Pna21 and Pmc21. To date, only the Pna21 structure, which has a calculated energy of formation 120 meV/formula unit less than that of the Pmc21 structure,Quayle et al. (2015) has been observed.
The Pna21 structure of ZnGeN2 was observed first by neutron diffraction.Wintenberger et al. (1973) Because it has 16 atoms per unit cell, its vibrational spectrum is much more complex than that of the wurtzite structure. The vibrational spectrum of ZnGeN2 was studied computationally in a series of papers.Lambrecht et al. (2005); Paudel and Lambrecht (2008); Lambrecht and Punya (2013) The first report of a measured Raman spectrum was for polycrystalline material. The unpolarized spectrum showed no well-resolved Raman peaks.Viennois et al. (2001) Subsequently, Raman spectra were measured for hexagonally faceted single crystals of diameters of a few microns and lengths of tens of microns along the c axis by Peshek et al. Peshek et al. (2008) Using this geometry and exploiting Raman polarization dependent selection rules, it was possible to measure the and TO modes. In addition, there was clear correlation between some features in the measured spectra with peaks in the calculated phonon density of states.
In this paper we report a new growth procedure, which leads to platelet shaped crystallites with the plane of the platelet being the -plane. This geometry offers the opportunity to measure the Raman spectrum and, in principle, the LO modes, and is the preferred growth direction for heterostructures and films grown on substrates. Since the same orientation will occur in films grown on the basal plane, it is important to establish the corresponding Raman spectrum experimentally as it could become useful to monitor the quality of crystal growth. By using cross-polarized as well as parallel-polarized spectra for different orientations relative to the hexagonally shaped plates, we were able to identify the modes and the modes. Good correspondence between theory and experiment was obtained for the modes and the modes that show weak LO-TO splitting. However, for the few modes that show a larger LO-TO splitting, the LO peaks were not visible in the experimental spectra. This result is explained in terms of overdamped LO-plasmon coupling. While one can not in principle associate the TO modes to corresponding LO modes on a one-to-one basis, an approximate correspondence can be established based on their Raman intensities, which indicates that these modes have similar eigenvectors. Within this correspondence, we show computationally that a mode crossing occurs. The modes which are found to be strongly Raman active are found to be only weakly infrared active, and vice versa.
II Methods
II.1 Experimental
ZnGeN2 was synthesized in a quartz tube furnace by exposing a Ge-Zn-Sn liquid to gaseous ammonia at 758 ∘C. To form the liquid, a small amount of Sn (50 mg) was placed on a [111] oriented Ge wafer. A small amount of Ge melted to form a liquid alloy that was in equilibrium with the underlying solid Ge. The Zn was supplied by a heated Zn crucible upstream of the Ge wafer, which maintained a Zn pressure in the growth chamber of approximately 0.03 atm. Based on equilibrium data, the predicted liquid composition was 31% Sn, 15% Zn, and 54% Ge. The NH3 pressure was maintained at 0.31 atm and the H2 carrier gas pressure was 0.63 atm. The growth time was 4.0 hours. Platelet-shaped crystals approximately 20 microns in diameter formed on the surface of the melt. The resulting ZnGeN2 platelets had ordered cation lattices, corresponding to the Pna21 spacegroup as evidenced by x-ray diffraction. The lattice parameters (a= Å, b= Å, c= Å) indicate the orthorhombic distortion associated with ordering.
Micro-Raman measurements were performed using a 633 nm laser focused through a 50 objective to a spot size of approximately 1 micron. The scattered light was collected in reflection using the same objective. The sample was rotated in order to change the direction of incident polarization with respect to the crystallographic axes.
II.2 Computational
The vibrational modes were calculated using density functional perturbation theory,Gonze (1997); Gonze and Lee (1997) also called linear response theory, within a plane wave basis set pseudopotential method using the ABINIT code.Gonze et al. (2002/11) The calculations were performed in the local density approximation (LDA),Perdew and Wang (1992) and used the relativistic Hartwigsen, Goedecker, Hutter (HGH) norm-conserving pseudopotentials.Hartwigsen et al. (1998) A large plane wave cut-off of 80 Hartree was used and the Brillouin zone integration used a integration mesh. For Zn the electrons were treated as valence electrons while for Ge they were included in the pseudized core.
III Results
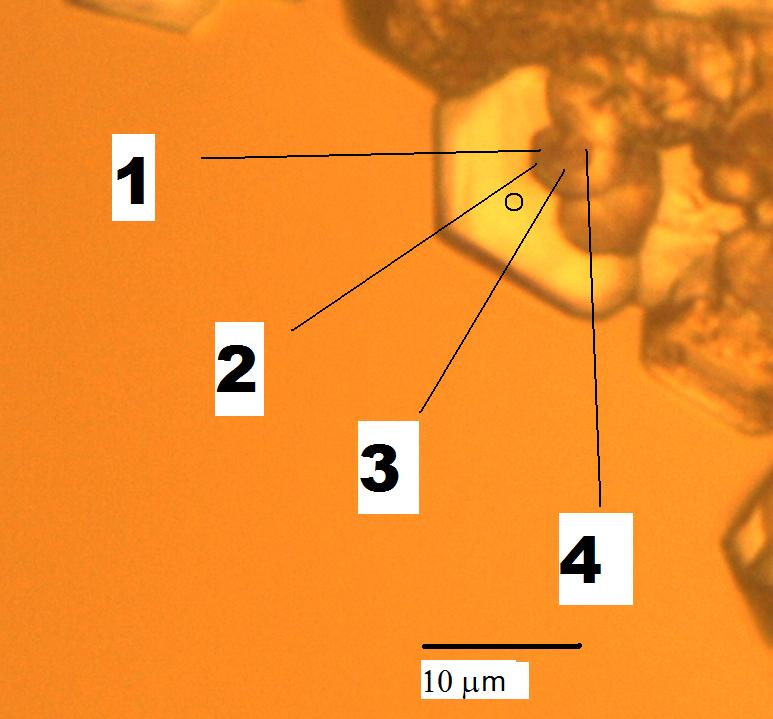
The Raman spectra were recorded for a hexagonal platelet for several polarization directions as indicated in Fig. 1. The scattering geometry has the wavevector of the laser light at nearly normal incidence to the plane of the platelets; that is, along the -direction. When the incoming and scattered light have parallel polarizations, the symmetry modes are excited. The Raman tensor for symmetry has different components for the , and polarizations of the incoming and scattered light. Since the wavevector is along and a vector’s component belongs to the irreducible representation of the point group, the spectrum measured in this way should correspond to the longitudinal optical modes. Although the modes contain displacements of the atoms along and as well as , only their -components contribute to the Raman tensor. For example, the Raman tensor element
| (1) |
involves the displacements eigenvector of the -th mode of symmetry, with the Cartesian component and the index of the atom in the unit cell. Although there is a sum over and , because of the third rank tensorial nature of the derivative of the susceptibility versus atomic displacements only the elements of the tensor are non-zero and thus only the displacements contribute. On the other hand, the modes correspond to the Raman tensor and should be measurable with crossed polarizers. However, we do not have an independent measure of which is the and which is the direction on the platelet. We assume that must point either to the corner of the hexagonal plate or to the middle of the side, but there are still multiple corners and sides that could be the crystal’s or directions. We utilized the selection rules to narrow down the choices. For a general direction in the plane, and parallel polarizers, the intensity should be proportional to
| (2) |
with the azumuthal angle measured from the axis. For parallel polarizations, if is in a direction between and both and modes will be present in the spectrum. Only when or does the spectrum contain no modes.
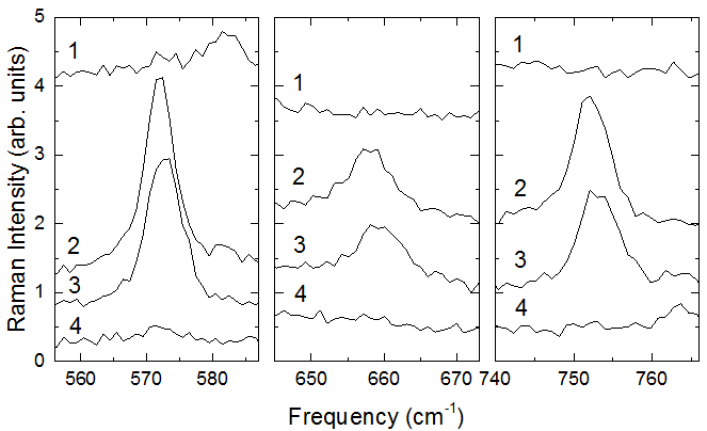
To determine which are the and axes, we first show the spectra under parallel polarizers in Fig. 2 for the four directions shown in Fig. 1. The peaks at 572, 658, and 753 cm-1 are the three strongest measured modes. These modes can be identified with the calculated modes at 568, 654 and 754 cm-1 reported in Ref. Lambrecht et al., 2005. Their Raman intensities were reported in Ref. Paudel and Lambrecht, 2008. In the present calculation, these modes occur at 577, 664 and 764 cm-1.
| Expt. | Calc. | Diff. | (10) | Other333Calculations from Lambrecht et al. Lambrecht et al. (2005) | Diff. |
|---|---|---|---|---|---|
| 133.9 | 132.3 | 129.9 | |||
| 160.0 | 163.5 | 163.0 | |||
| 186.0 | 184.5 | 182.3 | |||
| 202.2 | 202.1 | 200.6 | |||
| 265.4 | 269.4 | 266.5 | |||
| 334.1 | 334.6 | 340.7 | |||
| 470.0 | 472.1 | 470.8 | |||
| 565.4 | 553.1 | 555.2 | |||
| 572.4 | 577.4 | 567.6 | |||
| 658.1 | 664.5 | 653.6 | |||
| 753.0 | 764.0 | 753.6 | |||
| 785.9 | 798.5 | 819.9 | |||
| Max diff | |||||
| RMS diff |
According to Equation 2, when is in the or direction, no modes should be present. Clearly for directions 1 and 4 the modes at 572, 658 and 753 cm-1 are almost completely suppressed, and thus we identify one of the directions 1 or 4 as the direction and the other as the direction. Which is which will be determined below on the basis of the modes.
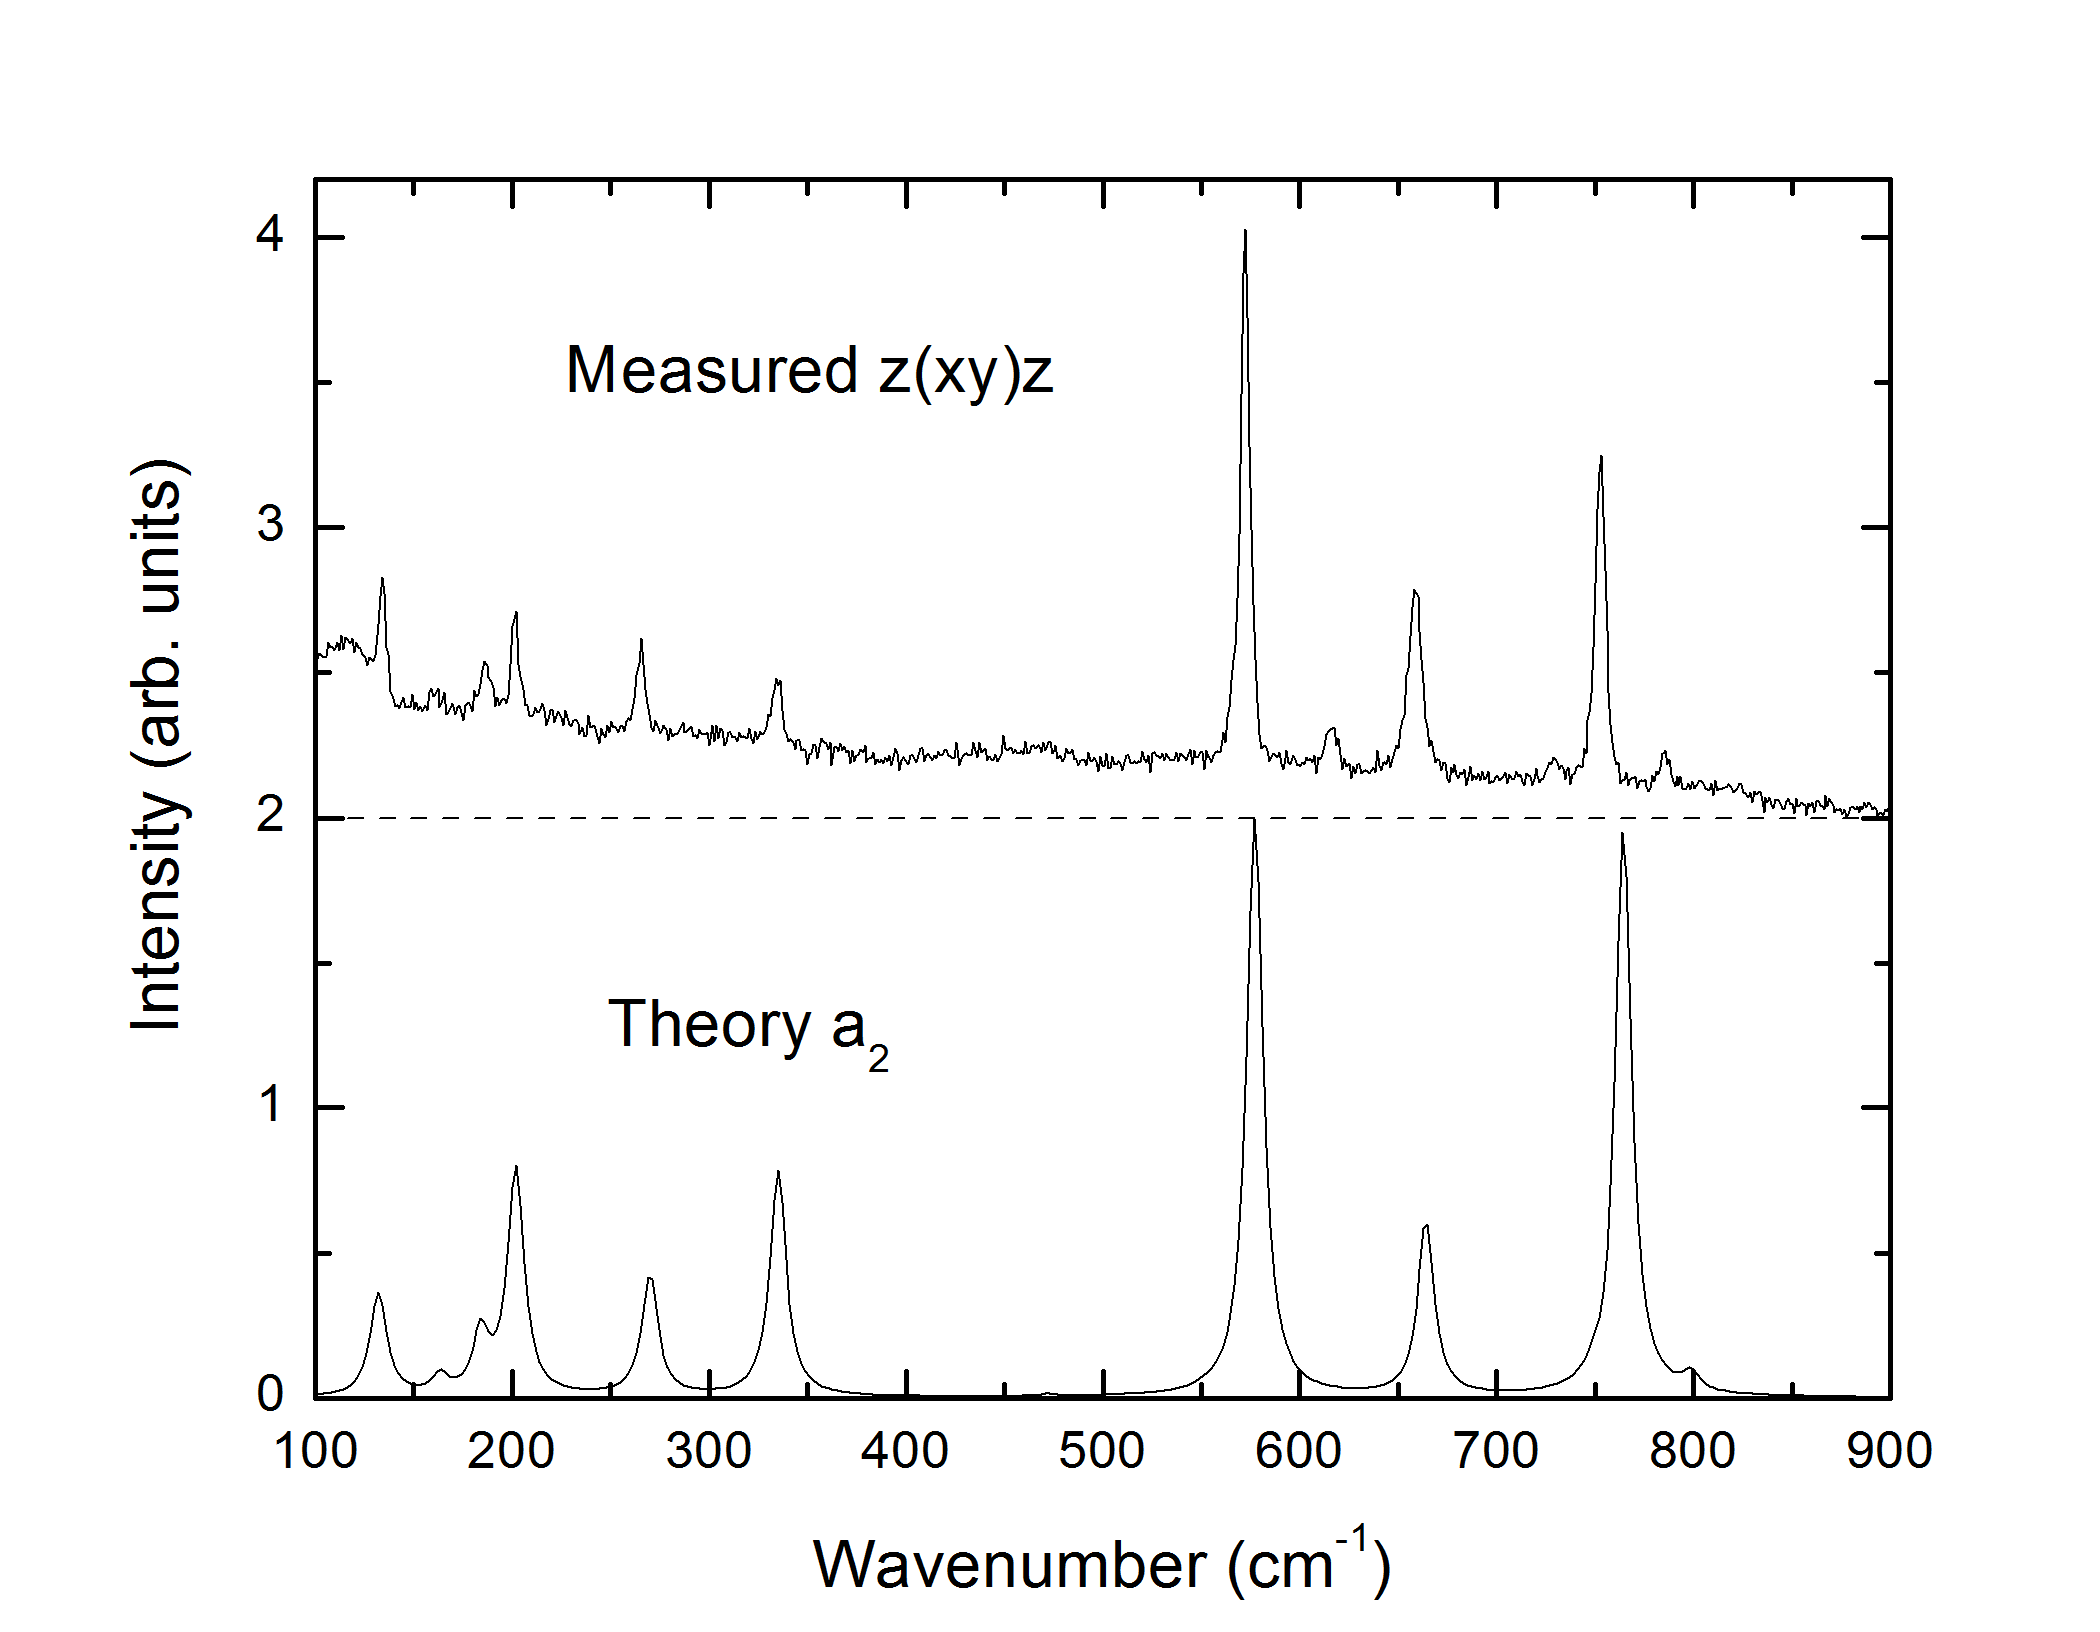
The spectrum under crossed polarizers with incoming polarization along one of these directions is shown in Fig. 3. We can now clearly identify all twelve modes. The measured values are compared with the present calculation and a previous oneLambrecht et al. (2005) in Table 1, and the differences between these and the experimental values is noted. The new calculation using a more accurate pseudopotential gives a slightly smaller maximum and average difference. Most frequencies are obtained to within 1% and the maximum difference between experimental and calculated values is 2%. The small peak at 617 cm-1 may result from incomplete suppression of the strong peak by the crossed polarizers, but the small peak at 726 cm-1 cannot be accounted for in this manner and is unexplained.
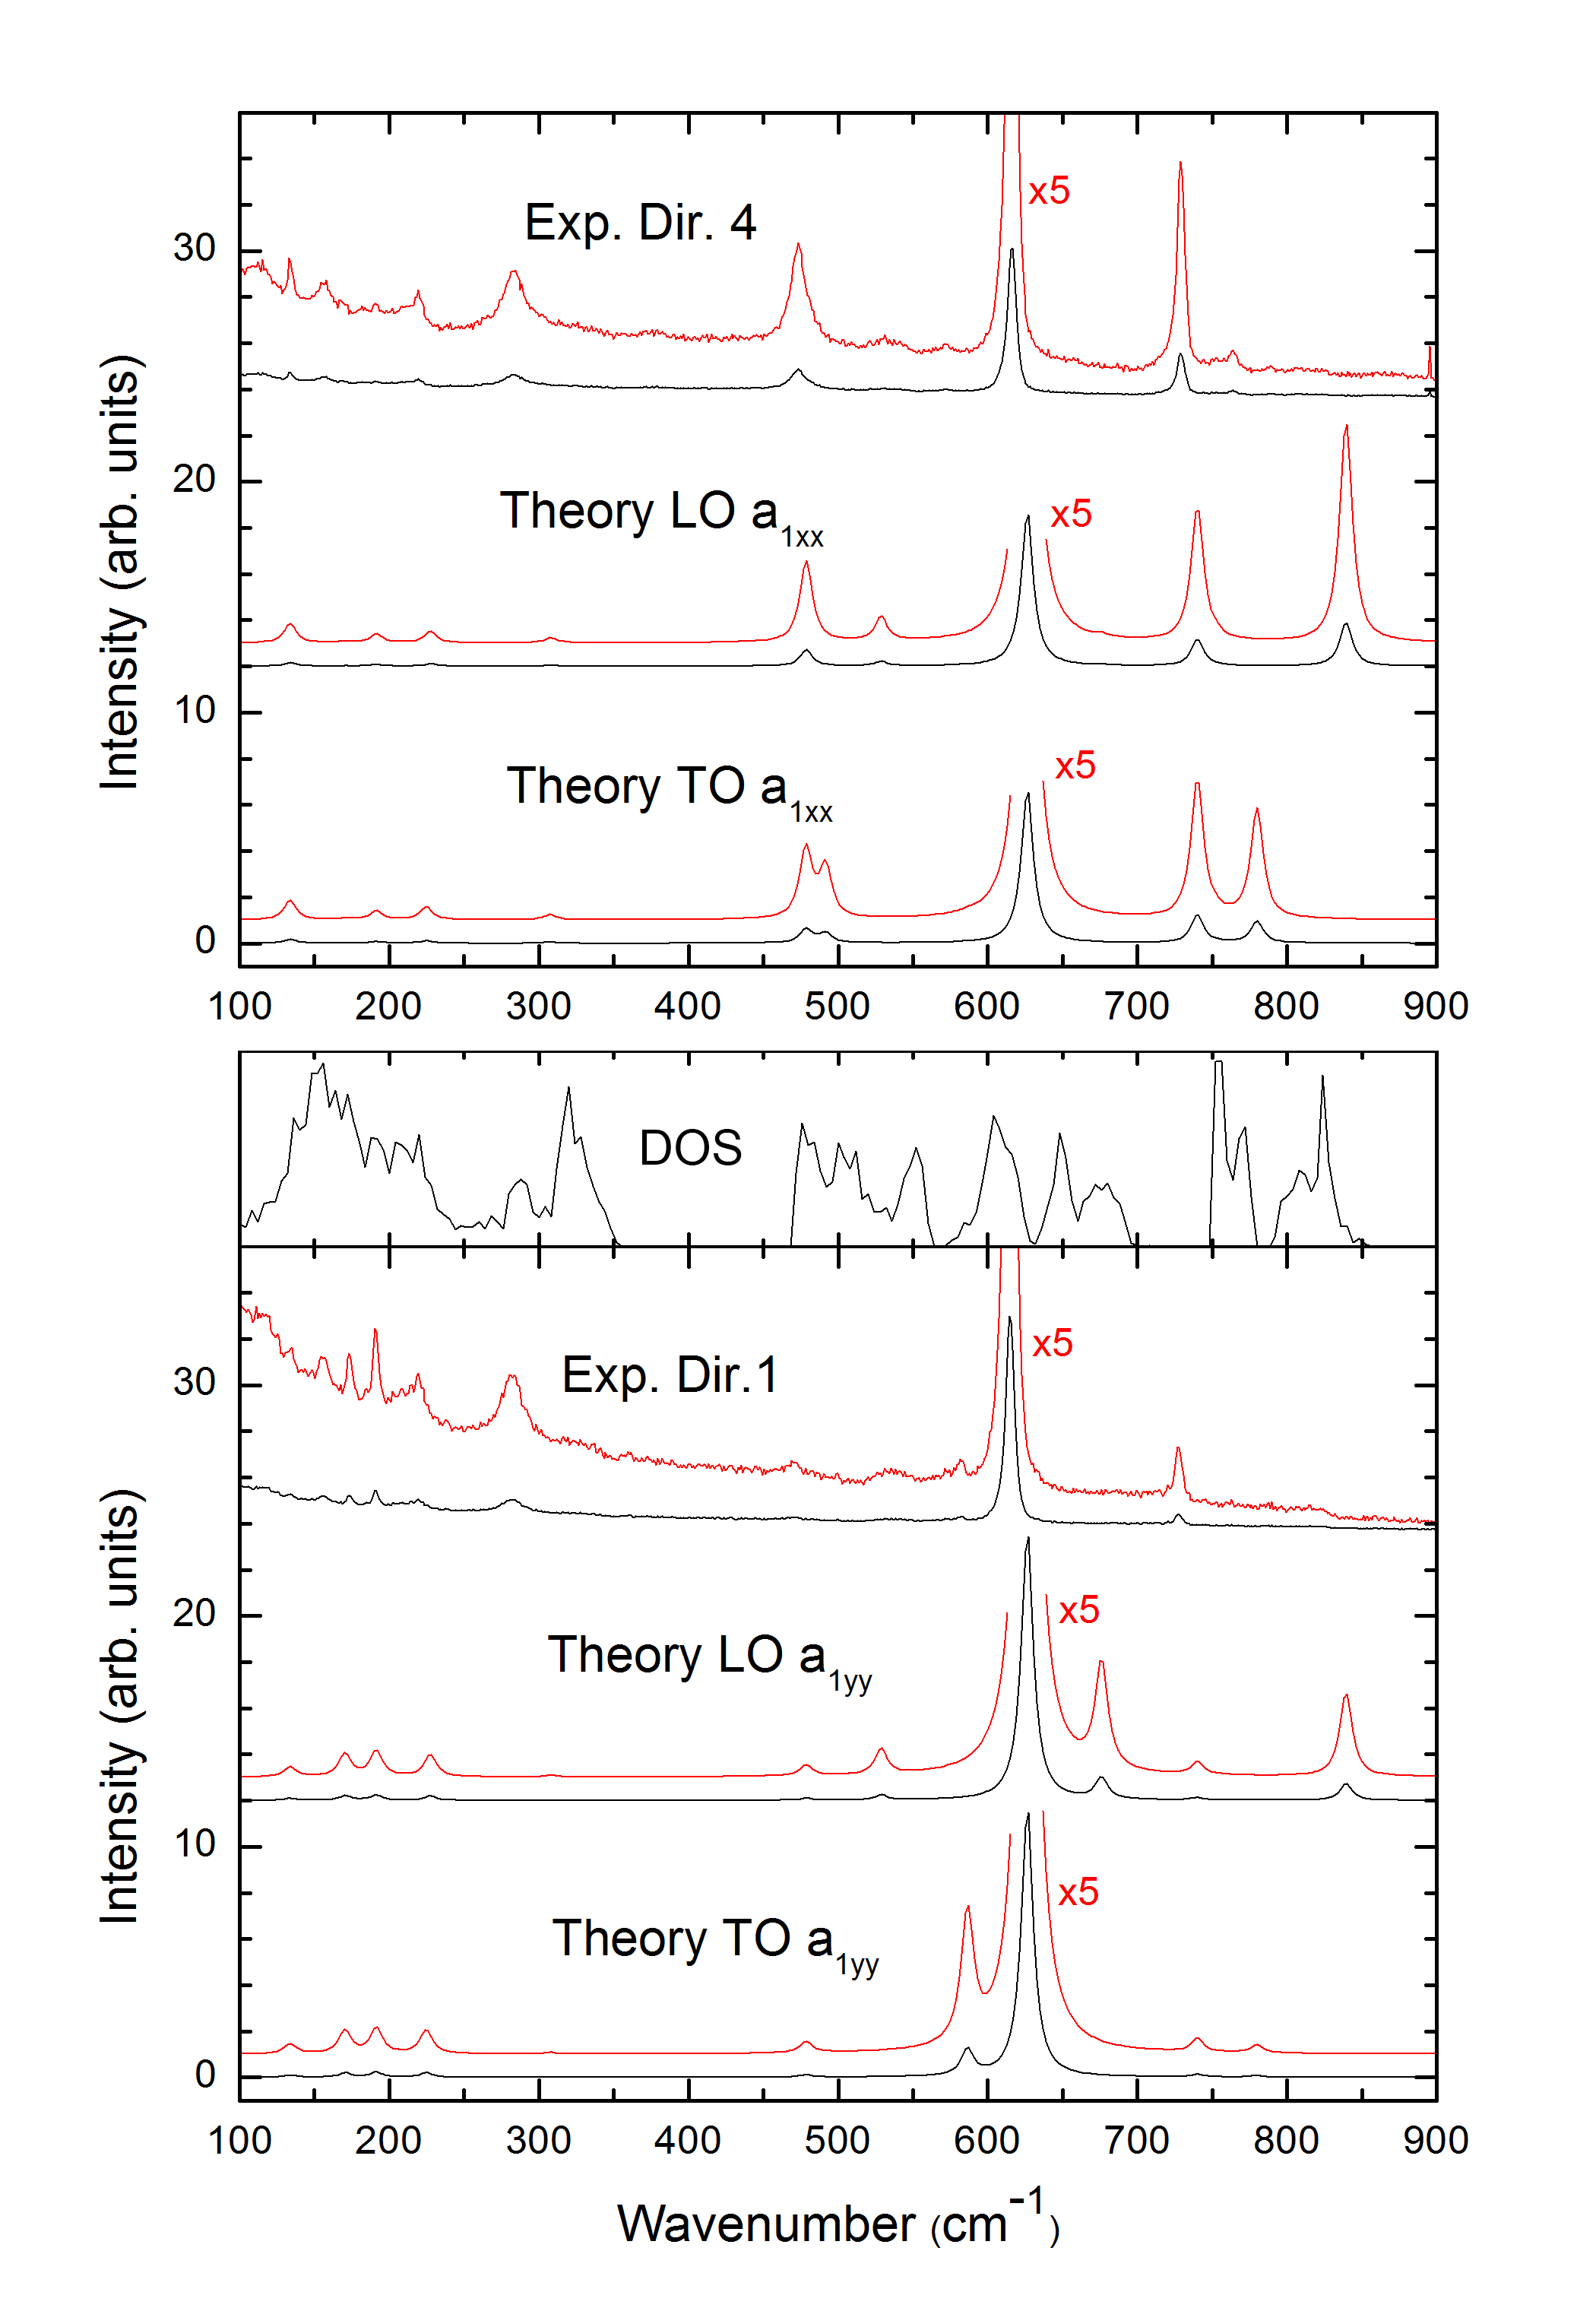
In Fig. 4 we show the spectra under parallel polarizers for directions 1 and 4 compared with calculated Raman spectra for the and Raman tensor components, respectively, for the longitudinal and transverse modes. First we note that the spectrum for direction 1 best corresponds to the calculated spectrum for the Raman tensor and for direction 4 to the Raman tensor. The collection times for the measured spectra in directions 1 and 4 were identical and the spectra were scaled by the same factor in the figure. The four calculated spectra were scaled by a common factor in order to make the measured and calculated intensities roughly comparable. We can see that the absolute intensity as well as the ratio of the strongest peak (at 614.5 cm-1) to the other peaks is higher for the experimental direction 1 and for the calculate component. Secondly, the details of the spectrum in the low frequency range also match best when identifying direction 4 with and direction 1 with . In the experimental spectra, the peak at 132.8 cm-1 is stronger in direction 4, and the peaks at 173.0 and 191.4 cm-1 are stronger in direction 1. These peaks correspond to the calculated modes at 133.9, 170.5, and 191.7 cm-1. The calculated peak positions for are listed in Table 2. The calculated peak at 133.9 cm-1 is predicted to be stronger in the direction, while the peaks at 170.5 and 191.7 cm-1 are predicted to be stronger in the direction.
Although the material is mostly ordered as evidenced by the lattice parameters, there is possibly some disorder on the lattice and thus we can expect that phonon density of states (DOS) features would appear in the measured spectra. Generally, the presence of DOS features in the Raman spectra of the present material is much less pronounced than in the spectra of the material grown by Peshek et al. Peshek et al. (2008). However, there are some features in the measured spectra which we believe might be associated with DOS features because of their proximity to predicted DOS features and because of the lack of variablity of the intensities and shapes of the features with polarization direction. A comparison of the measured spectra with the calculated DOSPeshek et al. (2008); Paudel and Lambrecht (2008) is shown in Fig. 4. There is a feature in the measured spectra at 156.7 cm-1 that has the same intensity for both directions of polarization. This feature is most likely associated with a peak in the DOS. Likewise, the feature at 219.4 cm-1 is the same for both directions and coincides with a steep ledge in the DOS. Theory also predicts a DOS peak at 225.2 cm-1 that is very close to the measured feature. There is a large broad measured feature at 283.4 cm-1 that is the same for both directions of polarization. The small predicted peak at 307.5 cm-1 might be contributing to this feature as well.
There is a large feature at 473 cm-1 that is much stronger in the direction 4 spectrum than in direction 1. This feature corresponds to the predicted peak at 478.5 cm-1, which is indeed predicted to be more intense in the direction. The dominant feature in all spectra is the intense peak measured at 614 cm-1, which corresponds to the 626.6 cm-1 peak in the calculated spectra. This peak is observed to be more intense in direction 1 and is predicted to be more intense in the direction. Another intense feature is the peak at 728.7 cm-1 in the measured spectra, which corresponds to the predicted peak at 740.5 cm-1. With all three of these peaks, the relative intensities in each direction of polarization are consistent with our assignment of direction 4 being the direction and direction 1 being the direction.
| Expt. | Calculation | ||||||
| a.u.=253.264 m2/s2 | |||||||
| 132.8 | 133.9 | 133.9 | |||||
| 173.0 | 170.5 | 170.6 | |||||
| 191.4 | 191.7 | 191.7 | |||||
| 219.4 | 225.2 | 227.9 | |||||
| 283.4 | 306.8 | 307.5 | |||||
| 473.0 | 478.5 | 478.6 | |||||
| 536.0 | 491.4 | 528.6 | |||||
| 580.0 | 586.5 | 676.2 | |||||
| 614.5 | 626.6 | 626.6 | |||||
| 728.7 | 740.5 | 740.5 | |||||
| 760.0 | 779.4 | 839.0 | |||||
In order to better understand the relations between the TO and LO modes we first examine the theoretical results. The TO and LO modes are listed in Table 2 along with some of their associated calculated quantities. For completeness’ sake we also report the calculated and modes in the appendix, although it was not possible to measure these with the present samples and scattering geometry. In the table we have assigned each LO mode to a corresponding TO mode. Strictly speaking, one cannot make a one-to-one correspondence between TO and LO modes of the same symmetry. The LO modes result from diagonalizing a force constant matrix, which includes long-range forces resulting from the coupling of the Born effective charges to the electric field produced by the dipoles for longitudinal modes in the limit of the wavevector . These forces are absent for transverse modes. In the calculations, this long-range electric field (here along ) is modeled as a static electric field, and we obtain a different set of modes when this field is included, compared to when it is not included. This result is referred to as the “non-analyticity” in the -direction. Since the frequencies with (LO) and without (TO) this non-analyticity result from diagonalizing different matrices (including one zero eigenvalue) in the two cases, there is no reason why the eigenvalues and eigenvectors should match up on a one-to-one basis. Nonetheless, there is a significant similarity in eigenvectors between most mode pairs and hence, in an approximate way, one could identify the modes according to the overlap between the LO and TO eigenvectors rather than simply ordering them according to increasing frequency. This similarity in their eigenvectors is manifested in the Raman tensor values, and the LO and TO mode correspondences were assigned with these considerations in mind.
The chosen LO-TO mode correspondences also become apparent when considering the calculated oscillator strengths of the modes, listed in Table 2. The oscillator strength is proportional to the long-range electric field set up in the crystal as a result of the normal mode oscillation and so should be related to the size of the LO-TO shift. Three of the eleven modes have significantly larger calculated oscillator strengths than the other modes and accordingly the LO-TO shifts associated with these assigned mode pairs are the largest of the eleven mode pairs. We note that in crystals with inversion symmetry modes are either Raman active or IR active but not both. Although in the present case we do not have inversion symmetry, there still appears to be clear distinction between modes that are strong in IR and weak in Raman or vice versa. Calculated IR spectra were reported in Ref. Paudel and Lambrecht, 2008, Fig. 1, and show indeed only three strong peaks in the spectrum, corresponding to TO modes, and three corresponding peaks in the spectra corresponding to LO modes.
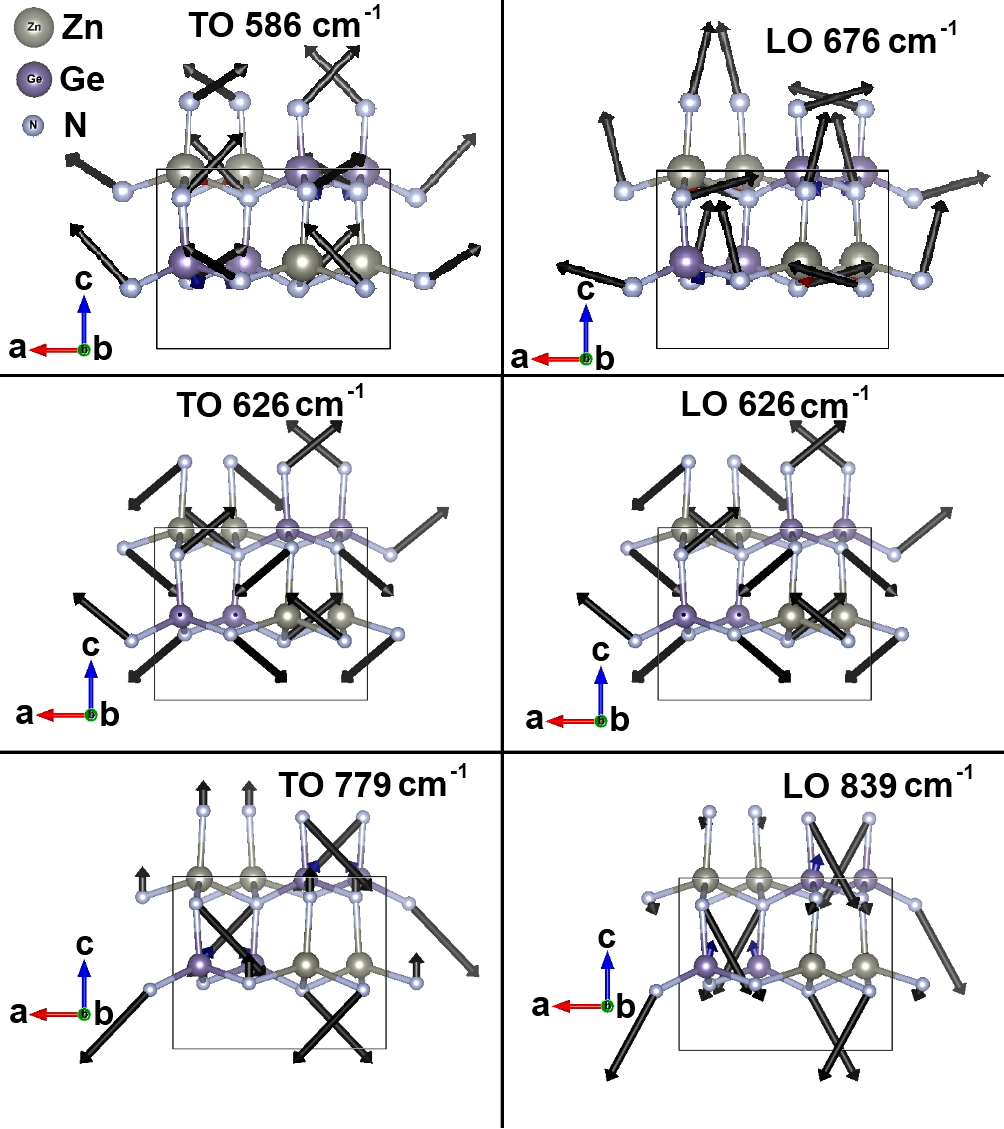
To further emphasize the correspondence between TO and LO modes, we also examine the normal mode vibration patterns. Fig. 5 shows the normal mode vibration patterns for some selected TO-LO mode pairs. First, the eigenvectors for the mode pair calculated at 626 cm-1 (corresponding to 614.5 cm-1 in the experiment) are nearly unchanged since the polarization and resulting electric field are very small for this mode, leading to a very small LO-TO frequency shift. The calculated TO mode at 586 cm-1 shifts to 676 cm-1. In a sense this mode has crossed the mode at 626 cm-1 in frequency space. We can see more resemblance of the 586 cm-1 eigenvector to the 676 cm-1 mode than to the 626 cm-1 mode. Nonetheless we can see that some displacements in the 676 cm-1 mode are more aligned with the direction, which demonstrates the effect of the electric field in the direction occuring in the LO mode. Notably, the nitrogen atom displacements in the left of the unit cell straighten out. The TO mode at 779 cm-1 shifts to 839 cm-1 due to the LO shift. In this case the modification to the eigenvector due to the electric field in the direction can be understood qualitatively. The nitrogen atoms are negatively charged while the germanium and zinc atoms are positively charged. The electric field in the direction then modifies the displacements of each atom type oppositely. Also note that in all of these relatively high frequency modes the predominant motions occur for the nitrogen atoms.
Two of the three LO modes that have a significant LO-TO frequency shift are not present in the measured spectra. The LO mode at 668 cm-1 in the spectrum is predicted to be large, but it is not seen in either experimental spectrum. Likewise, the LO mode at 839 cm-1 is not seen in either measured spectrum. There is a broad feature in both measured spectra around 536 cm-1 that is close to the third predicted LO mode with a large LO-TO shift at 528 cm-1. However, this feature could also be associated with a DOS feature. Generally, the LO modes lie close to DOS peaks and could be hidden by them but the DOS features in the 650-700 cm-1 do not stand out above the background and the predicted LO peak at 839 cm-1 lies definitely above the highest DOS peaks.
We hypothesize that these LO modes with large induced electric fields are being suppressed due to an overdamped plasmon coupling. LO phonon modes couple to the plasma through the electric field. In GaN, the low carrier mobility dampens the coupled LO-plasmon mode. In GaN doped with Si to a concentration of 2.51018 cm-3, the LO mode is already broadened to the point where it cannot be separated from the background noise.Kozawa et al. (1994) In Kozawa et al. Kozawa et al. (1994) a plasmon broadening factor of 930 cm-1 was extracted for the highest carrier concentration sample where the peak is still visible. This result corresponds to a carrier mobility of order 50 cm2/Vs. We may expect reasonably that a similar or even larger broadening and carrier concentration occurs in our ZnGeN2 samples. The carrier concentration of the present ZnGeN2 platelets could presently not be measured, but ZnGeN2 rods grown using a similar method and at a similar temperature were measured and a carrier concentration of order 1019 cm-3 was estimated.Dyck et al. (2016) We have measured the spectra up to 1230 cm-1 and did not find any indication of an upper LO-plasmon coupled peak in this range. This result indicates that the plasmon frequency could be even higher and outside the range measured and indicates the carrier concentrations would be larger than cm-3. With a broadening factor of order 1000-2000 cm-1 as obtained by Mohajerani et al. Mohajerani et al. (2016) for GaN nanorods, our simulations of the Raman spectra following the approach described by Kozawa et al. Kozawa et al. (1994) indicate that the upper branch is very weak and broad compared to the lower branch and likely not detectable. For a carrier concentration of order cm-3 the plasmon mode would already be above 2000 cm. The lower branches in this case are so close to the TO mode that they become indistinguishable from it.
With the scattering geometry used, in principle we expect to only see longitudinal modes. However, because we used a high numerical aperture objective, there was some portion of the incident light with wavevector in directions other than the direction. Because of this situation we might expect to see some intensity from TO modes. For example, the small peak in the direction 4 spectrum at 760 cm-1 could well be a trace of the strong TO peak predicted to be at 776 cm-1. Similarly, the small peak in the direction 1 spectrum at 580 cm-1 could stem from the strong TO peak predicted at 585 cm-1. The third TO peak which is predicted to have a large LO-TO splitting is located at 491.4 cm-1, just to the higher energy side of the large peak at 478.6 cm-1. In the measured spectrum in direction 4, this TO peak might be contributing to the slight asymmetry of this large feature at 473.0 cm-1. These small traces of the TO Raman peaks observed further support our assignment of the crystallographic orientation of the measured platelet. As mentioned in the previous paragraph, the observation of these traces of the TO modes could also be explained by the fact that they coincide with the lower branches of the plasmon coupled modes. Since the latter are so close to the pure TO modes, they cannot be distinguished in the present spectra. In the work on GaN rods by Mohajerani et al. Mohajerani et al. (2016) the modes could be distinguished from the pure TO mode as broad peaks essentially hidden as subtle changes in the background and thanks to careful fitting over a range of samples with systematically changing carrier concentration. Unfortunately, we are not yet in a position to carry out such measurements in the present samples and thus our conjecture of the presence of LO-plasmon coupling is still indirectly based on the non-observation of LO peaks.
IV Conclusions
ZnGeN2 was grown with a preferential c-oriented platelet type of crystal habit by exposing a Ge-Sn-Zn liquid to ammonia at 758∘C . Micro-Raman measurements were carried out on these platelets for different orientations of the polarization directions with respect to the crystallite orientation in the plane and with parallel or crossed incident versus scattered polarization. Combined with first-principles calculations these measurements allowed us to determine which were the and directions on the platelet and to measure the and Raman modes. Most of the predicted peak locations were within 5 cm-1 of the measured values, and the predicted relative intensities agreed semi-quantitatively with the measured peaks. The LO peaks of the three modes that were predicted to have large LO-TO frequency shifts were not detected, likely because of over-damped coupling to plasmons. This result is consistent with the expected high unintentional n-type doping.
Acknowledgements.
This work was supported by the National Science Foundation under grants No. DMR-1006132, DMR-1409346 (E. B and K. K.), and DMR-1533957 (M. H. and W. R. L.). Calculations made use of the High Performance Computing Resource in the Core Facility for Advanced Research Computing at Case Western Reserve University.Appendix A
| a.u.=253.264 m2/s2 | ||||
| 168.2 | 168.7 | |||
| 194.3 | 194.4 | |||
| 239.7 | 241.8 | |||
| 305.6 | 308.9 | |||
| 326.4 | 326.4 | |||
| 517.7 | 540.7 | |||
| 546.6 | 551.3 | |||
| 616.2 | 705.4 | |||
| 656.3 | 656.2 | |||
| 768.9 | 821.4 | |||
| 799.4 | 796.7 | |||
| 133.2 | 133.4 | |||
| 167.3 | 167.3 | |||
| 208.4 | 210.3 | |||
| 270.3 | 270.6 | |||
| 341.6 | 341.7 | |||
| 478.7 | 490.6 | |||
| 508.2 | 562.2 | |||
| 599.3 | 638.8 | |||
| 677.9 | 678.0 | |||
| 756.4 | 796.1 | |||
| 808.2 | 842.1 |
References
- Punya and Lambrecht (2013) A. Punya and W. R. L. Lambrecht, Phys. Rev. B 88, 075302 (2013), URL http://link.aps.org/doi/10.1103/PhysRevB.88.075302.
- Han et al. (2014) L. Han, K. Kash, and H. Zhao, in Proceedings of SPIE, Light-Emitting Diodes: Materials, Devices, and Applications for Solid State Lighting XVII (2014), pp. 90030W–1–5.
- Blanton et al. (2013) E. Blanton, K. He, J. Shan, and K. Kash, in Symposium E/H – Photovoltaic Technologies, Devices and Systems Based on Inorganic Materials, Small Organic Molecules and Hybrids (2013), vol. 1493 of MRS Proceedings, pp. 237–242, URL http://journals.cambridge.org/article_S1946427413002352.
- Quayle et al. (2015) P. C. Quayle, E. W. Blanton, A. Punya, G. T. Junno, K. He, L. Han, H. Zhao, J. Shan, W. R. L. Lambrecht, and K. Kash, Phys. Rev. B 91, 205207 (2015), URL http://link.aps.org/doi/10.1103/PhysRevB.91.205207.
- Wintenberger et al. (1973) M. Wintenberger, M. Maunaye, and Y. Laurent, Mat. Res. Bull. 8, 1049 (1973).
- Lambrecht et al. (2005) W. R. L. Lambrecht, E. Alldredge, and K. Kim, Phys. Rev. B 72, 155202 (2005).
- Paudel and Lambrecht (2008) T. R. Paudel and W. R. L. Lambrecht, Phys. Rev. B 78, 115204 (pages 12) (2008), URL http://link.aps.org/abstract/PRB/v78/e115204.
- Lambrecht and Punya (2013) W. R. L. Lambrecht and A. Punya, in III-Nitride Semiconductors and their Modern Devices, edited by B. Gill (Oxford University Press, 2013), pp. 519–585.
- Viennois et al. (2001) R. Viennois, T. Taliercio, V. Potin, A. Errebbahi, B. Gil, S. Charar, A. Haidoux, and J.-C. Tédenac, Mater. Sci. Eng. B 82, 45 (2001).
- Peshek et al. (2008) T. J. Peshek, T. R. Paudel, K. Kash, and W. R. L. Lambrecht, Phys. Rev. B 77, 235213 (pages 9) (2008), URL http://link.aps.org/abstract/PRB/v77/e235213.
- Gonze (1997) X. Gonze, Phys. Rev. B 55, 10337 (1997).
- Gonze and Lee (1997) X. Gonze and C. Lee, Phys. Rev. B 55, 10355 (1997).
- Gonze et al. (2002/11) X. Gonze, J. M. Beuken, R. Caracas, F. Detraux, M. Fuchs, G. M. Rignanese, M. Sindic, L.and Verstraete, G. Zerah, and F. Jollet, Computational Materials Science 25,3, 478 (2002/11), URL http://www.abinit.org.
- Perdew and Wang (1992) J. P. Perdew and Y. Wang, Phys. Rev. B 45, 13244 (1992), URL http://link.aps.org/doi/10.1103/PhysRevB.45.13244.
- Hartwigsen et al. (1998) C. Hartwigsen, S. Goedecker, and J. Hutter, Phys. Rev. B 58, 3641 (1998), URL http://link.aps.org/doi/10.1103/PhysRevB.58.3641.
- Kozawa et al. (1994) T. Kozawa, T. Kachi, H. Kano, Y. Taga, M. Hashimoto, N. Koide, and K. Manabe, Journal of Applied Physics 75, 1098 (1994), URL http://scitation.aip.org/content/aip/journal/jap/75/2/10.1063/1.356492.
- Dyck et al. (2016) J. S. Dyck, J. R. Colvin, P. C. Quayle, T. J. Peshek, and K. Kash, Journal of Electronic Materials 45, 2920 (2016), ISSN 1543-186X, URL http://dx.doi.org/10.1007/s11664-015-4322-3.
- Mohajerani et al. (2016) M. S. Mohajerani, S. Khachadorian, T. Schimpke, C. Nenstiel, J. Hartmann, J. Ledig, A. Avramescu, M. Strassburg, A. Hoffmann, and A. Waag, Applied Physics Letters 108, 091112 (2016), URL http://scitation.aip.org/content/aip/journal/apl/108/9/10.1063/1.4943079.