A dichotomy between the hard state spectral properties of black hole and neutron star X-ray binaries
Abstract
We analyse the spectra of black hole (BH) and neutron star (NS) X-ray binaries (XBs) in the hard state using archival RXTE observations. We find that there is a clear dichotomy in the strength of Comptonisation between NS and BH sources, as measured by both the Compton parameter and amplification factor , with distinct groups of BH and NS XBs separated at and . The electron temperature can occupy a broad range in BH systems, from keV, whereas for NSs is peaked at keV, but can extend to higher values. The difference between BHs and NSs in implies that is higher at a given optical depth for BH XBs. Our results also imply that for NS systems the accreting material loses of its energy through Comptonisation in the corona. The remaining energy is released on the surface of the neutron star, making it a powerful source of soft radiation, which alters the properties of the Comptonising corona. Finally, we find evidence at the confidence level that Comptonisation parameters may be correlated with the neutron star spin, whereas no correlation with the BH spin is found. Our results highlight a further observational distinction between BH and NS XBs that is a consequence of NSs possessing a physical surface.
keywords:
X-ray:binaries.1 Introduction
X-ray binaries (XBs) are observed in a rich variety of states and phenomenologies (e.g. Remillard & McClintock, 2006; Belloni, 2010; Gilfanov, 2010). However, from a broad perspective their behaviour can be reduced to a discussion of two spectral states. These are comprised of a soft state, where the spectra peak below 10 keV and are well-described as optically thick emission from a geometrically thin disc (Shakura & Sunyaev, 1973), and a hard state where the spectra follow a roughly power law shape to tens or hundreds of keV (e.g. Syunyaev et al., 1991; Tanaka & Shibazaki, 1996; Ibragimov et al., 2005; Gilfanov, 2010).
The precise emission geometry of the hard state remains unknown, however, the observed photon index is consistent with the bulk of the emission arising from the unsaturated Comptonisation of seed photons by a hot electron cloud of temperature and optical depth (Sunyaev & Titarchuk, 1980). The interplay between these two properties can be accounted for by describing the spectral shape in terms of the Compton -parameter
| (1) |
which is a measure of the average change in energy a population of photons will experience while travelling through a finite medium.
Comptonisation is a cooling process, where hot electrons impart energy through scattering with lower energy photons, which means that the supply and temperature of the seed photons will affect the properties of the Comptonising media. Sunyaev & Titarchuk (1989) showed that if the seed photons originate in the accretion disc and close to the Comptonising cloud then it is necessary to account for photon feedback, where Comptonised photons are subsequently absorbed by the disc, increasing the temperature and numerosity of seed photons going into the cloud, causing more Comptonisation and a greater cooling of the Comptonising media. In the case of a uniform thermal electron cloud blanketing the disc, this will result in softer (and more rapidly softening) spectra than is typically observed from BH XBs (Haardt & Maraschi, 1993), thus strongly disfavouring such a scenario (Gilfanov et al., 1995; Churazov, Gilfanov & Revnivtsev, 2001). The hard state geometry is therefore subject to two important constraints; the absence of the the soft state emission consistent with an optically thick accretion disc (with keV), and the positioning of the two emission regions (seed photon source and Comptonising electron cloud) such that the effect of photon feedback is reduced.
Some fraction of the Comptonised photons will be intercepted by the disc and ‘reflected’ into the line-of-sight by further Compton scattering and florescence. These processes give rise to a complex spectral component that typically peaks at energies of keV (the so-called ‘Compton hump’, see Sunyaev & Titarchuk, 1980, Fig. 10a,c) and adds further fluorescent emission to the spectrum. The reflection component is present in both BH XBs (due to interaction of X-rays with the accretion disc and the surface of the normal star, Basko, Sunyaev & Titarchuk, 1974) and active galactic nuclei (Nandra & Pounds, 1994), and complicates attempts to understand the dominant Comptonised emission owing to proximity of the Compton hump to the plausible location of the high-energy turn-off (corresponding to ). Typical attempts to take reflection into account involve adding sophisticated reflection components (such as the Xspec models pexrav (Magdziarz & Zdziarski, 1995) or reflionx (Ross & Fabian, 2005)) to unsophisticated models of Comptonisation, such as a cut-off power law. This inaccurate representation of the Comptonisation means that interesting properties such as the electron temperature or Compton -parameter are then inferred from the best fit of a cut-off power law to the data, rather than a direct treatment of these quantities. In addition to this, Ibragimov et al. (2005) showed that the strength of the reflected component (defined in terms of the solid angle subtended by the portion of the disc in line-of-sight to the corona) is systematically over-estimated by such treatment. It has been known for some time that correlates strongly with photon index (Gilfanov, Churazov & Revnivtsev, 1999; Revnivtsev, Gilfanov & Churazov, 2001; Ibragimov et al., 2005), increasing as spectra become softer (implying a decreasing -parameter). Similar behaviour has been observed for AGN spectra (Zdziarski, Lubiński & Smith, 1999; Gilfanov, Churazov & Revnivtsev, 2000; Zdziarski et al., 2003). This relationship clearly favours the accretion disc as the source of the seed photons for Comptonisation, as the radiation being intercepted by the disc is increasing in tandem with the seed photon flux incident on the electron cloud. However, there is increasing evidence that at lower luminosities synchrotron photons from the magnetised corona may contribute a significant, perhaps dominant, population of seed photons, motivating the creation of so-called hybrid models. Such models typically comprise both a low-energy thermal population and an additional high-energy non-thermal population of electrons (see e.g. Coppi, 1999; Merloni & Fabian, 2001; Del Santo et al., 2013).
Typical attempts to understand the geometry of the hard state either consider a truncated disc with an electron cloud close to the compact object (e.g. Poutanen, Krolik & Ryde, 1997), where the innermost portions of the disc have either evaporated to form an optically thin, hot flow (Meyer & Meyer-Hofmeister, 1994) or are absent altogether, with the hard X-ray emission stemming from the base of the jet (Markoff, Falcke & Fender, 2001; Markoff, Nowak & Wilms, 2005), which is always concurrent with the hard state (Fender, Belloni & Gallo, 2004). Other plausible geometries invoke the presence of non-uniform or dynamic coronae (Beloborodov, 1999). Possible hard state geometries are discussed in detail by Done, Gierliński & Kubota (2007) and Gilfanov (2010).
A majority of NS XBs also exhibit soft and hard states (Hasinger & van der Klis, 1989), but differ observationally from BH XBs (e.g. Gilfanov, 2010) in that the hard state is always at a relatively low luminosity in the range (), what is often referred to as the ‘island state’. The majority of observational differences arise due to the presence of a physical surface. The difference in angular momentum between the innermost portions of the disc and the surface leads to the formation of a boundary layer, an ever-present (Shakura & Sunyaev, 1988) portion of the flow where the kinetic energy of the accreting material is surrendered (Sibgatullin & Sunyaev, 2000). In addition, material will accumulate on the NS surface until the critical density for thermonuclear ignition is reached, which leads to powerful explosions that are observed as type-I X-ray bursts (see Strohmayer & Bildsten, 2006, for review).
Gilfanov, Revnivtsev & Molkov (2003) used Fourier-resolved spectroscopy to show that the boundary layer has a similar spectrum across a handful of sources, and can be approximated by a Wien spectrum of characteristic temperature keV. The emission from the boundary layer, or even the NS surface itself, should provide additional seed photons for Comptonisation in the hard state, affecting the properties of the Comptonising media (Sunyaev & Titarchuk, 1989). Indeed, it is observed that the hard state of NSs is generally softer than that of BHs (Syunyaev et al., 1991; Gilfanov et al., 1993; Churazov et al., 1995; Done & Gierliński, 2003), which could be attributed to the Comptonising corona being cooler in such systems. We emphasise that when discussing the hard state in this paper we refer specifically to the traditional ‘low/hard’ state, where the source is at comparatively low luminosity (, in the case of NSs) and not the states that can occur at higher luminosities when a strongly Comptonised component is also present in the spectrum.
Distinguishing BH from NS in an XB requires dynamical mass measurements obtained by optical or IR spectroscopy of transient sources during quiescence, when the optical emission is dominated by the companion (see Charles & Coe, 2006, for review). However, our ability to firmly identify BHs is limited by the necessity for a source to be transient and for the secondary to be observable with optical instrumentation. Such limitations mean that formally discerning BH from NS in extragalactic studies is practically impossible. Therefore, there is an increasing list of behaviours that can be used to identify an XB as a black hole ‘candidate’ (BHC), or definitively as a NS. Most strikingly, NS LMXBs display temporal behaviour that is not observed from BH LMXBs, such as type-I X-ray bursts and, when in the hard state, a significant amount of noise in their X-ray variability for frequencies greater than Hz (Sunyaev & Revnivtsev, 2000). While BHs and NSs exhibit similar X-ray states, there are some important state-dependent spectral differences, as BH sources should be softer during the so-called soft or thermal dominant state when the strongest source of emission is from the disk. This emission is characterised by the temperature of innermost portion of the disk, its position determined by the ISCO of the compact object, which will be larger for BHs than for NSs (for which the minimum inner disc radius can be also set by the radius of the NS). In this paper we propose another spectral technique for distinguishing the nature of the compact object in XBs based on the Comptonisation properties of their coronae in the hard state.
The paper is organised as follows. In § 2 we assemble a sample of BH and NS XBs for which RXTE observations of the hard states are available and outline the subsequent reduction process. We also outline the reduction of a handful of archival, simultaneous XMM-Newton observations (§ 2.2). In § 3 we analyse RXTE spectra over a broad energy range ( keV) with the sophisticated Comptonisation model of Poutanen & Svensson (1996), allowing us to separate out the properties of the seed photon population, reprocessing materials and the Comptonising region, then present our results in § 3.2. Discussion in § 5.1 demonstrates that NSs have a systemically lower Compton -parameter and we posit that this is a consequence of the physical surface providing additional seed photons for Comptonisation, producing different physical properties of the Comptonising media. The diagnostic potential of the observed differences in hard state spectra is considered, both in the context of Galactic and Extragalactic X-ray binary studies. We then investigate surprisingly high seed photon temperatures (§ 5.5), and use simultaneous XMM observations to show that these are systematically over-estimated by fitting to the RXTE bandpass and establish that this does not alter significantly the principal conclusions of this work. We summarise our conclusions in § 6.
2 Data Reduction
2.1 RXTE Data
We first identified a selection of known BH and NS XBs (Ritter & Kolb, 2003) where repeated RXTE observations exist in the HEASARC archive111https://heasarc.gsfc.nasa.gov/db-perl/W3Browse/w3browse.pl. In the case of NSs, our requirement that the source exhibits the classic hard (aka ‘island’) state meant that no Z-track sources were considered. As a preliminary step we constructed lightcurves for each source, covering the whole RXTE mission, in order to identify periods when each source was in the hard state. For each sub-observation we retrieved the PCA standard2 data products, housekeeping data and filter file. These files allow us to produce deadtime corrected, background uncorrected lightcurves and hardness-intensity diagrams (HIDs) without having to download the entire RXTE archive of observations for each source. For this exercise we use data exclusively from PCU2, which was always turned on during observations. Using HEAsoft 6.15 we extract 16s-binned lightcurves from three energy ranges; keV, keV and . In order to compensate for long-term variation in the gain of the detector we converted to absolute channels, which depend on the mission epoch222http://heasarc.gsfc.nasa.gov/docs/xte/e-c_table.html. Using the intensities for each band we calculate a hardness ratio for each point in the lightcurve. This hardness ratio is similar to that used by Lin, Remillard & Homan (2007), who showed that for typical NS XBs the hard and soft states are fully distinguishable by comparing the intensity in the PCA above and below keV. Based on inspection of the hardness-intensity diagrams, we chose sub-observations for analysis where for the majority of time bins. We apply an additional constraint by considering data only where , in the interest of achieving good statistics for spectral fitting as well as consistent handling of the background for all sources. Where possible we include data from multiple outbursts of a given source. A list of the sources studied in this work is presented in table 1 together with the assumed distance, BH mass and equivalent Hydrogen column density used in our analyses.
The hard state datasets used in this work are presented in table 2. After downloading the full dataset for each sub-observation, we produced full 64s-binned lightcurves using both the left- and right-anode chains from the first Xenon layer PCU2 data that were both deadtime and background corrected (using the bright background model). In the interests of good calibration we chose not to include PCU0 or PCU1 data obtained after the failure of their respective propane layers in 2000 and 2006. Further, we filtered these data to exclude periods when the pointing was greater than 0.02 degrees off-target, when the elevation was less than 10 degrees, in the period immediately preceding the passage of the satellite through the South Atlantic Anomaly (SAA), and periods of 600s after PCA breakdown events. We determined the optimal PCA configuration for each observation, so as to maximise the number of counts in the eventual spectra, and produced lightcurves and hardness ratios using these configurations. Good time interval (GTI) files were produced based on these lightcurves, covering continuous portions of the observation and also ignoring any short-term events such as X-ray bursts. These GTIs have typical durations of ks.
We extract source and background PCA spectra for each GTI, again using both left and right anodes. Both source and background are subsequently deadtime corrected and response files generated. The PCA spectra are then rebinned such that there are a minimum of 40 counts per bin, which enables the use of the statistic in spectral fitting. As is standard practice, we add a systematic uncertainty to each bin.
| Source | Distance | Mass | Ref. | |
|---|---|---|---|---|
| kpc | ||||
| GS 1354-64 | 0.73 | A | ||
| GRO J1654-40 | 0.53 | B,M | ||
| GX 339-4 | 0.37 | C,L | ||
| XTE J1550-564 | 1.01 | D,N | ||
| XTE J1118+480 | 0.013 | E,O | ||
| Cyg X-1 | 0.721 | F,P | ||
| 4U 1543-47 | 0.35 | K | ||
| 4U 1636-536 | 0.27 | G | ||
| 4U 1705-44 | 0.67 | J | ||
| 4U 1728-33 | 1.24 | I | ||
| Aql X-1 | 0.28 | J | ||
| 4U 1608-52 | 1.81 | J |
HEXTE source and background spectra were extracted over the same GTI files using the ftool HXTLCURV, and the correct response files generated. We use both cluster A and cluster B data prior to 2004, when cluster A ceased to move between on- and off-target pointings, and use only cluster B data for the period between 2004 and December 2010. This process also produced 64s-binned background-subtracted lightcurves, which were used in the creation of good time intervals.
| Source Name | Observations | PCUs | Exposure (ks) | ||
|---|---|---|---|---|---|
| Black Holes | PCA | HEXTE-B | HEXTE-A | ||
| GS 1354-64 | 20431-01-03-00 | 0,1,2,3,4 | 26.787 | 1.666 | 1.67 |
| GS 1354-64 | 20431-01-04-00 | 0,1,2,3,4 | 13.58 | 0.774 | 0.792 |
| GS 1354-64 | 20431-01-05-00 | 0,1,2,3,4 | 12.493 | 0.776 | 0.776 |
| GS 1354-64 | 20431-01-05-00 | 0,1,2,3,4 | 15.6 | 0.969 | 0.999 |
| 4U 1543-47 | 70124-02-06-00 | 2,3 | 1.692 | 0.293 | 0.293 |
| 4U 1550-564 | 30188-06-01-00 | 0,1,2,3,4 | 2.014 | 0.129 | 0.126 |
| 4U 1550-564 | 30188-06-01-01 | 0,1,2,3,4 | 3.249 | 0.237 | 0.259 |
| 4U 1550-564 | 30188-06-01-02 | 0,1,2,3,4 | 5.905 | 0.362 | 0.368 |
| 4U 1550-564 | 50134-02-01-00 | 0,1,2,3,4 | 3.872 | 0.255 | 0.255 |
| 4U 1550-564 | 50135-01-03-00 | 2,3,4 | 6.781 | 0.674 | 0.662 |
| 4U 1550-564 | 50135-01-05-00 | 2,3,4 | 3.594 | 0.403 | 0.391 |
| 4U 1550-564 | 50135-01-06-00 | 2,3 | 2.743 | 0.475 | 0.476 |
| 4U 1550-564 | 50137-02-07-00 | 2,3,4 | 1.404 | 0.18 | 0.158 |
| Cyg X-1 | 20173-01-01-00 | 0,1,2,3,4 | 9.639 | 0.621 | 0.604 |
| Cyg X-1 | 20173-01-01-00 | 0,1,2,3,4 | 14.492 | 0.922 | 0.909 |
| Cyg X-1 | 20173-01-01-00 | 0,1,2,3,4 | 16.237 | 1.025 | 1.003 |
| Cyg X-1 | 20173-01-01-00 | 0,1,2,3,4 | 16.936 | 1.029 | 1.022 |
| Cyg X-1 | 20173-01-02-00 | 0,1,2,3,4 | 12.704 | 0.789 | 0.786 |
| Cyg X-1 | 20173-01-02-00 | 0,1,2,3,4 | 15.66 | 0.969 | 0.945 |
| Cyg X-1 | 20173-01-02-00 | 0,1,2,3,4 | 16.044 | 0.969 | 0.974 |
| Cyg X-1 | 80110-01-43-00 | 2,3 | 6.348 | 0.989 | |
| Cyg X-1 | 80110-01-44-00 | 2,3 | 3.318 | 0.584 | |
| Cyg X-1 | 80110-01-45-00 | 2,3 | 3.38 | 0.621 | |
| Cyg X-1 | 94108-01-01-00 | 2 | 2.982 | 1.028 | |
| GX 339-4 | 92035-01-01-01 | 2 | 3.049 | 1.139 | |
| GX 339-4 | 92035-01-01-02 | 2 | 3.581 | 1.243 | |
| GX 339-4 | 92035-01-02-04 | 2 | 3.071 | 0.962 | |
| GX 339-4 | 92035-01-02-04 | 2 | 2.99 | 0.999 | |
| GX 339-4 | 90118-01-06-00 | 2 | 1.520 | 0.523 | 0.522 |
| XTE J1118+480 | 50133-01-01-00 | 2,3,4 | 6.757 | 0.703 | 0.733 |
| XTE J1118+480 | 50133-01-02-00 | 2,3,4 | 7.98 | 0.859 | 0.868 |
| XTE J1118+480 | 50133-01-02-01 | 2,3,4 | 6.636 | 0.757 | 0.767 |
| XTE J1118+480 | 50133-01-02-01 | 2,3,4 | 7.439 | 0.869 | 0.864 |
| XTE J1118+480 | 50133-01-02-01 | 2,3,4 | 6.741 | 0.79 | 0.788 |
| XTE J1118+480 | 50133-01-03-00 | 2,3,4 | 9.478 | 1 | 1.026 |
| XTE J1118+480 | 50133-01-03-00 | 2,3,4 | 9.608 | 0.985 | 1.03 |
| GRO J1654-40 | 50133-01-03-00 | 2,3 | 3.477 | 0.317 | |
| GRO J1654-40 | 91702-01-01-03 | 2,3 | 3.273 | 0.53 | |
| GRO J1654-40 | 91702-01-01-04 | 2,3 | 5.697 | 0.92 | |
| GRO J1654-40 | 91702-01-01-05 | 2,3 | 1.908 | 0.359 | |
| Neutron Stars | |||||
| 4U 1608-52 | 60052-03-01-06 | 2,3,4 | 10.451 | 1.265 | 1.274 |
| 4U 1608-52 | 60052-03-02-02 | 2,3,4 | 13.786 | 1.487 | 1.501 |
| 4U 1608-52 | 60052-03-02-02 | 2,3,4 | 13.119 | 1.384 | 1.41 |
| 4U 1608-52 | 60052-03-02-04 | 2,3,4 | 9.422 | 1.13 | 1.136 |
| 4U 1608-52 | 60052-03-02-06 | 2,3,4 | 9.378 | 1.136 | 1.136 |
| 4U 1636-536 | 92023-02-08-00 | 2 | 1.949 | 0.666 | |
| 4U 1636-536 | 92023-02-09-00 | 2 | 1.469 | 0.464 | |
| 4U 1636-536 | 92023-02-10-00 | 2 | 1.4 | 0.411 | |
| 4U 1636-536 | 92023-02-11-00 | 2 | 2.023 | 0.696 | |
| 4U 1636-536 | 92023-02-12-00 | 2 | 0.801 | 0.294 | |
| 4U 1636-536 | 94310-01-04-00 | 2 | 2.322 | 0.708 | |
| 4U 1705-44 | 20073-04-01-00 | 0,1,2,3,4 | 12.255 | 0.677 | 0.678 |
| 4U 1705-44 | 20073-04-01-00 | 0,1,2,3,4 | 13.974 | 0.804 | 0.804 |
| 4U 1728-34 | 92023-03-47-00 | 2 | 1.958 | 0.614 | |
| 4U 1728-34 | 92023-03-49-00 | 2 | 2.11 | 0.733 | |
| Aql X-1 | 50049-01-04-01 | 1,2,3 | 6.049 | 0.749 | 0.763 |
| Aql X-1 | 91414-01-07-03 | 2,3,4 | 5.934 | 0.722 | |
| Aql X-1 | 91414-01-08-05 | 2,3,4 | 3.703 | 0.433 | |
| Aql X-1 | 91414-01-08-07 | 2,3,4 | 5.834 | 0.623 |
2.2 XMM Data
To explore the effects of bandpass on our spectral fitting results, we identified three simultaneous XMM observations where three of our sources were in the hard state. We chose to reduce only EPIC-pn data obtained in timing mode to avoid the controversial arguments surrounding the data reduction of bright point sources observed in imaging mode (Done & Diaz Trigo, 2010; Miller et al., 2010). See table 3 for a list of XMM observations used, the exposure of the resulting spectrum and the corresponding simultaneous RXTE observation ID.
Each dataset was reduced using SAS release 14.0.0 (SAS development Team, 2014). Based on inspection of the keV lightcurve, background flares were identified and filtered out into a new event file. The spectra were extracted from all RAWY and from 5 RAWX either side of the three central columns, which were excluded in the interests of reducing the effect of pile-up. Pile-up was found to be negligible in the resultant spectra using the tool epatplot. The high number of counts present in the wings of the point-spread function mean that any attempt to extract a background spectrum from a supposed ‘source-free’ region will be impossible, and most-likely result in the over-subtraction of background during spectral fitting, skewing the spectral shape (see discussion in Done & Diaz Trigo, 2010). As is now standard practice we chose to assume the contribution from the background spectrum will be negligible in comparison with the source spectra. We applied a grouping of a minimum of 50 counts per spectral bin, and added a systematic uncertainty. These spectra are analysed and discussed in section 5.5.
3 Analysis
Spectral fitting was carried out for each source using an absorbed Comptonisation model with an additional Gaussian component to model the fluorescent Fe emission. Using the combined PCA and HEXTE spectra, we were able to fit over the keV and keV ranges, respectively, for all spectra with the exception of those from P20431 (GS 1354-64), when we used HEXTE spectra above 30 keV owing to calibration uncertainties beneath this energy. We chose to employ the Xspec model compps (Poutanen & Svensson, 1996), which models the Comptonised emission and its reflection by material in the accretion disk. For compps we leave as free parameters the electron temperature , seed photon temperature of a multi-colour disc , Compton -parameter, relative reflection factor and the normalisation. We fix the relevant parameters such that the electron distribution is Maxwellian, and assume a spherical geometry () for the treatment of radiative transfer and photon escape probability and a binary inclination of . All other parameters remain at their default values. We model the absorption column using phabs, with fixed at the Galactic value (table 1) as reported from the 21 cm survey carried out by Kalberla et al. (2005). A multiplicative constant is included in the model so as to account for the difference in calibration between PCA and HEXTE. Ultimately the spectral model used in Xspec can be described as const(phabs(compps+gauss)) .
| Source | ObsId | Sim. RXTE | Exp. (ks) |
|---|---|---|---|
| 4U 1636-536 | 0606070401 | 94310-01-04-00 | 25.553 |
| Cyg X-1 | 0605610401 | 94108-01-01-00 | 19.754 |
| GX 339-4 | 0204730201 | 90118-01-06-00 | 80.022 |
Before fitting the spectra we attempted to constrain the calibration constant by reducing contemporaneous Crab observations for each dataset when the right combination of PCUs were active. We found while subsequently fitting XBs that the calibration constant recovered from fitting was consistent with that found from fitting the Crab spectra with an absorbed power law, with in the range .
We chose to limit the available parameter space to explore, based on reasonable physical criteria. We restricted the peak energy of the Gaussian to a range of keV, allowing for the moderate resolution of RXTE in the vicinity of the relativistically broadened Fe K line, where crudely modelling the excess emission with a Gaussian could conceivably lead to a recovered in the range described. We also restrict the Gaussian width keV. We restrict the electron temperature of the plasma to values above 10 keV, the minimum value for which the numerical method used by the model can be expected to produce reasonable results. Finally, we constrain the seed photon temperature to negative values, which forces Xspec to model the seed photon spectra as emission from a conventional disc blackbody (i.e. Shakura & Sunyaev, 1973).
3.1 Mitigating contamination from Galactic ridge emission
The majority of sources within our sample lie within 10 degrees of the Galactic plane. The low spatial resolution of RXTE () means that the spectra of sources in our sample are susceptible to contamination from the Galactic ridge (GR). The keV GR flux can be as high as (Revnivtsev, 2003), or in RXTE PCA terms. For many of the sources in our sample, their Galactic longitudes are large enough and/or their count rates are so high () as to render any effect on the spectral shape negligible, and we do not take GR emission into account for modelling their spectra. However, some spectra were observed at count rates of the order , and for sources close to the Galactic plane we take further consideration.
To attempt to correct for the effect of GR emission we add an additional model consisting of a simple power law () and Gaussian line ( keV, keV with a normalisation tied to that of the power law such as to produce an equivalent width keV), as found by Revnivtsev (2003). We made use of the Xspec cflux component to fix the overall flux contribution of the model between keV to a value calculated using the NIR-GR X-ray flux relation,
| (2) |
as found by Revnivtsev et al. (2006). To obtain the NIR flux in the vicinity of the source, we measured the flux at the source position on the COBE-DIRBE map (Bennett et al., 1996) and corrected for extinction using the relation (Rieke & Lebofsky, 1985), where was determined from the absorption column as presented by Dickey & Lockman (1990).
For the majority of sources the GR emission was found to be , however, of particular note is the NS source 4U , for which we estimate the GR flux to be due to its position close to the Galactic centre.
3.2 Parameter Estimation
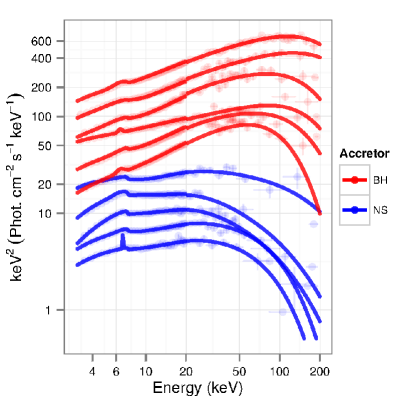
Performing traditional spectral fitting using models containing a compps component with as a free parameter is computationally expensive; a single spectral fit can take a typical desktop computer many minutes to complete. A fortiori the calculation of 1D uncertainty intervals using the error command, or even a 2D examination of the parameter space using a steppar grid (a technique that will vary on a source-to-source basis, and should only be used on two parameters at a time). Therefore, we choose to employ Monte Carlo algorithms to robustly explore the parameter space favoured by our spectra. Facility for Markov-Chain MC has been integrated into Xspec for some time, and has proved successful in the past for the calculation of confidence intervals (for example, Burke et al., 2013), however, it is non-trivial to assess how well the chain has converged around the posterior distribution in a consistent way. To bypass this problem we make use of analysis software BXA (Buchner et al., 2014), which connects the nested sampling algorithm MultiNest (Feroz, Hobson & Bridges, 2009) with Xspec. Our methodology followed a two-step approach, primarily fitting the spectra in the nominal way with Xspec, to guarantee that the model can describe the data in a manner acceptable by the test, and then using BXA to explore the parameter space. To find 2D confidence regions we bin over a given 2D plane, rank each bin by the number of MCMC samples it contains and then iteratively sum successive bins of decreasing rank until we have defined an area containing of samples. In figure 1 we display examples of the best-fit model and unfolded spectra.
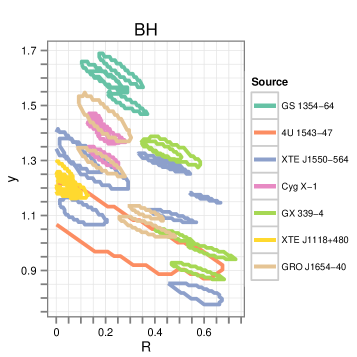
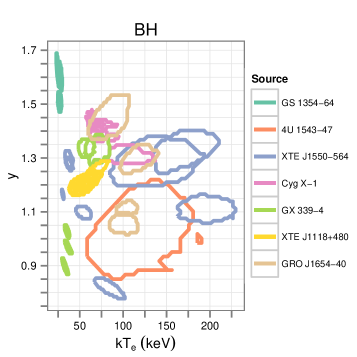
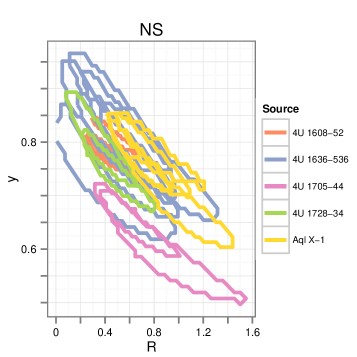
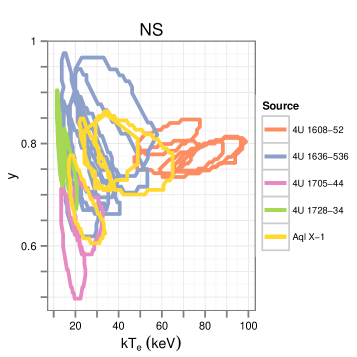
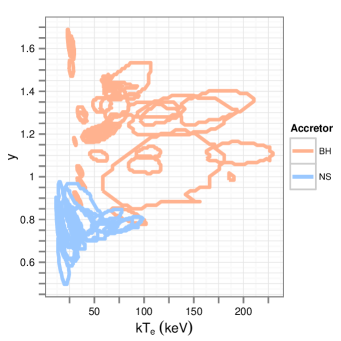
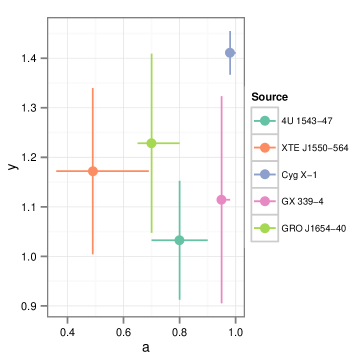
We present the 1D confidence intervals of compps parameters in table 4, which we quote at the level throughout this work unless stated otherwise. In the top two rows of figure 2 we present the and planes for individual BHs and NSs. In the lower row, we present the two samples together.
| Source | obsID | R | y | Norm. | |||
| GS 1354-64 | P20431 | 5.31 | |||||
| GS 1354-64 | P20431 | 5.03 | |||||
| GS 1354-64 | P20431 | 4.73 | |||||
| GS 1354-64 | P20431 | 4.80 | |||||
| 4U 1543-47 | P70124 | 1.92 | |||||
| XTE J1550-564 | P30188 | 26.0 | |||||
| XTE J1550-564 | P30188 | 25.7 | |||||
| XTE J1550-564 | P30188 | 29.3 | |||||
| XTE J1550-564 | P50134 | 19.4 | |||||
| XTE J1550-564 | P50135 | 8.58 | |||||
| XTE J1550-564 | P50135 | 7.45 | |||||
| XTE J1550-564 | P50135 | 6.93 | |||||
| XTE J1550-564 | P50137 | 20.9 | |||||
| Cyg X-1 | P20173 | 30.0 | |||||
| Cyg X-1 | P20173 | 33.8 | |||||
| Cyg X-1 | P20173 | 35.6 | |||||
| Cyg X-1 | P20173 | 31.7 | |||||
| Cyg X-1 | P20173 | 28.5 | |||||
| Cyg X-1 | P20173 | 29.2 | |||||
| Cyg X-1 | P20173 | 28.4 | |||||
| Cyg X-1 | P80110 | 48.2 | |||||
| Cyg X-1 | P80110 | 31.5 | |||||
| Cyg X-1 | P80110 | 32.9 | |||||
| Cyg X-1 | P94108 | 31.1 | |||||
| GX 339-4 | P92035 | 19.2 | |||||
| GX 339-4 | P92035 | 21.4 | |||||
| GX 339-4 | P92035 | 23.4 | |||||
| GX 339-4 | P92052 | 8.95 | |||||
| GX 339-4 | P90118 | 6.47 | |||||
| XTE J1118+480 | P50133 | 3.14 | |||||
| XTE J1118+480 | P50133 | 3.66 | |||||
| XTE J1118+480 | P50133 | 3.33 | |||||
| XTE J1118+480 | P50133 | 3.43 | |||||
| XTE J1118+480 | P50133 | 3.33 | |||||
| XTE J1118+480 | P50133 | 3.51 | |||||
| XTE J1118+480 | P50133 | 3.48 | |||||
| GRO J1654-40 | P91702 | 8.55 | |||||
| GRO J1654-40 | P91702 | 11.3 | |||||
| GRO J1654-40 | P91702 | 13.0 | |||||
| GRO J1654-40 | P91702 | 13.7 | |||||
| 4U 1608-52 | P60052 | 2.63 | |||||
| 4U 1608-52 | P60052 | 2.27 | |||||
| 4U 1608-52 | P60052 | 2.31 | |||||
| 4U 1608-52 | P60052 | 2.36 | |||||
| 4U 1608-52 | P60052 | 2.78 | |||||
| 4U 1636-536 | P92023 | 2.49 | |||||
| 4U 1636-536 | P92023 | 2.83 | |||||
| 4U 1636-536 | P92023 | 3.13 | |||||
| 4U 1636-536 | P92023 | 3.65 | |||||
| 4U 1636-536 | P92023 | 3.56 | |||||
| 4U 1636-536 | P94310 | 2.17 | |||||
| 4U 1705-44 | P20073 | 2.73 | |||||
| 4U 1705-44 | P20073 | 2.52 | |||||
| 4U 1728-33 | P92023 | 6.69 | |||||
| 4U 1728-33 | P92023 | 6.97 | |||||
| Aql X-1 | P50049 | 5.85 | |||||
| Aql X-1 | P91414 | 2.37 | |||||
| Aql X-1 | P91414 | 3.68 | |||||
| Aql X-1 | P91414 | 3.51 |
| Source | obsID | Norm. | |||
|---|---|---|---|---|---|
| GS 1354-64 | P20431 | ||||
| GS 1354-64 | P20431 | ||||
| GS 1354-64 | P20431 | ||||
| GS 1354-64 | P20431 | ||||
| 4U 1543-47 | P70124 | ||||
| XTE J1550-564 | P30188 | ||||
| XTE J1550-564 | P30188 | ||||
| XTE J1550-564 | P30188 | ||||
| XTE J1550-564 | P50134 | ||||
| XTE J1550-564 | P50135 | ||||
| XTE J1550-564 | P50135 | ||||
| XTE J1550-564 | P50135 | ||||
| XTE J1550-564 | P50137 | ||||
| Cyg X-1 | P20173 | ||||
| Cyg X-1 | P20173 | ||||
| Cyg X-1 | P20173 | ||||
| Cyg X-1 | P20173 | ||||
| Cyg X-1 | P20173 | ||||
| Cyg X-1 | P20173 | ||||
| Cyg X-1 | P20173 | ||||
| Cyg X-1 | P80110 | ||||
| Cyg X-1 | P80110 | ||||
| Cyg X-1 | P80110 | ||||
| Cyg X-1 | P94108 | ||||
| GX 339-4 | P92035 | ||||
| GX 339-4 | P92035 | ||||
| GX 339-4 | P92035 | ||||
| GX 339-4 | P92052 | ||||
| GX 339-4 | P90118 | ||||
| XTE J1118+480 | P50133 | ||||
| XTE J1118+480 | P50133 | ||||
| XTE J1118+480 | P50133 | ||||
| XTE J1118+480 | P50133 | ||||
| XTE J1118+480 | P50133 | ||||
| XTE J1118+480 | P50133 | ||||
| XTE J1118+480 | P50133 | ||||
| GRO J1654-40 | P91702 | ||||
| GRO J1654-40 | P91702 | ||||
| GRO J1654-40 | P91702 | ||||
| GRO J1654-40 | P91702 | ||||
| 4U 1608-52 | P60052 | ||||
| 4U 1608-52 | P60052 | ||||
| 4U 1608-52 | P60052 | ||||
| 4U 1608-52 | P60052 | ||||
| 4U 1608-52 | P60052 | ||||
| 4U 1636-536 | P92023 | ||||
| 4U 1636-536 | P92023 | ||||
| 4U 1636-536 | P92023 | ||||
| 4U 1636-536 | P92023 | ||||
| 4U 1636-536 | P92023 | ||||
| 4U 1636-536 | P94310 | ||||
| 4U 1705-44 | P20073 | ||||
| 4U 1705-44 | P20073 | ||||
| 4U 1728-33 | P92023 | ||||
| 4U 1728-33 | P92023 | ||||
| Aql X-1 | P50049 | ||||
| Aql X-1 | P91414 | ||||
| Aql X-1 | P91414 | ||||
| Aql X-1 | P91414 |
4 Discussion
5 The plane
There is a strong degeneracy between and , which is similar to the well-known degeneracy between and photon index (Zdziarski, Lubiński & Smith, 1999; Gilfanov, Churazov & Revnivtsev, 1999). This degeneracy coupled with the relatively large confidence intervals means that no obvious trend can be seen for NS systems on the plane. Most spectra for a particular NS occupy a similar position in the parameter space, showing no clear evolution. This is to be expected because these sources spend most of their time in the soft (banana) state, which transitions to a low/hard state where the data are of lower quality, leading to larger uncertainties in spectral fitting. The transition to the high-intensity soft state occurs on such short timescales that it is unlikely to observe an Atoll source over a range of intensities while the spectra are hard. In contrast there is some notable evolution in the plane for several of the BH sources, most notably 4U , GX and XTE J. When the spectra are taken from the same outburst where the source rises in intensity through the hard state, near to the point where the source transitions; this leads to an increased and a reduction in . This behaviour is of the same nature as the correlations in X-ray binaries and AGN observed previously (Zdziarski, Lubiński & Smith, 1999; Gilfanov, Churazov & Revnivtsev, 1999, 2000; Zdziarski et al., 2003), albeit with larger scatter.
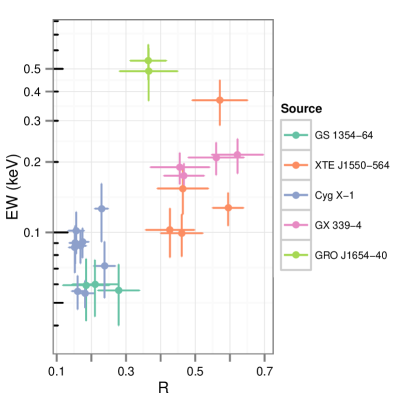
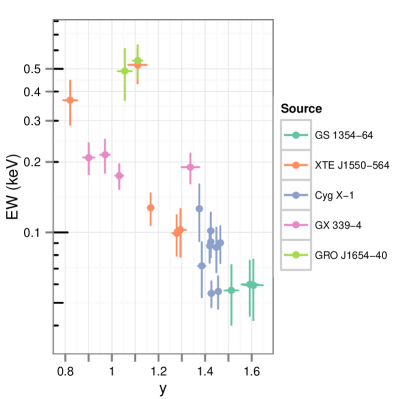
In our spectral model there are two independent measures of the strength of reprocessed emission; the reflection strength () in the Comptonising component and the equivalent width of the Gaussian line used to model the Fe emission. While it is likely that a Gaussian is a poor description of the line profile, the moderate spectral resolution of the PCA instrument means that it is adequate for the purpose of characterising the emission strength. Using similar spectral models, it has been shown that and the equivalent width of the line correctly rank the spectra in terms of the relative amount of reprocessed emission contributing to the spectrum (e.g., Gilfanov, Churazov & Revnivtsev, 1999). In figure 3 we show that there is a reasonable correlation between the and when the two parameters are well constrained (which includes the majority of BH sources but not NS sources). This demonstrates that the spectral modelling returns a consistent measure of the relative amount of reprocessed emission present in a spectrum, even if the exact value of is systematically under- or over-estimated as a result of not accounting for certain physical variables, such as the ionisation state of the reprocessing material. We also find a clear anti-correlation between and . Interestingly, it has much smaller scatter, than relation between and , and in this respect is more similar to the previously observed correlations.
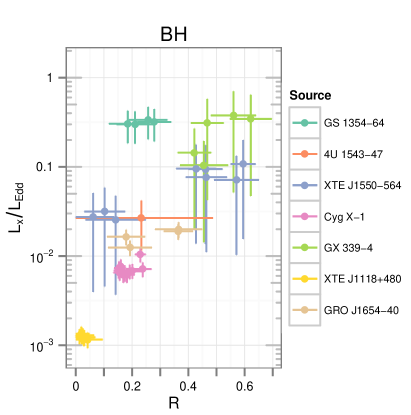
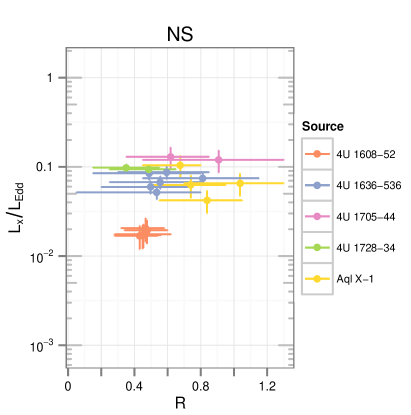
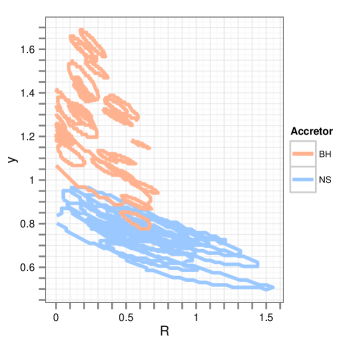
In figure 4 we plot against luminosity, indicating a trend of increasing with accretion rate. The highest luminosities are consistent with for both BH and NS samples (we note that the large uncertainties in for some sources originate from the large uncertainty in the distances to some sources). For NSs the connection between luminosity and reflection is less clear, though this is more difficult to ascertain because of the lack of luminosity variation in the NS hard state compared to that of BH XBs. The trend between with is not mirrored by the Compton parameter, for which much larger scatter is observed.
5.1 Comptonisation properties of LMXBs
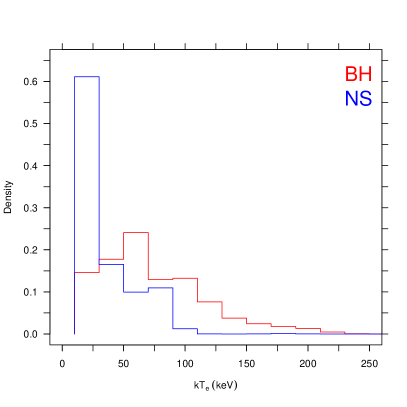
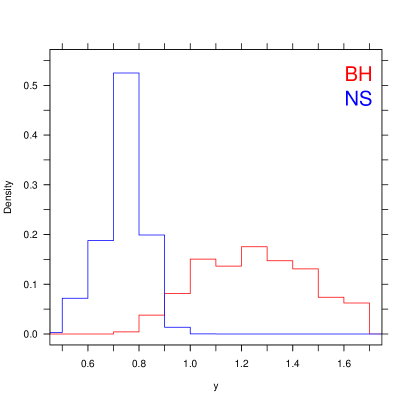
As one can see from figure 2, there is a clear dichotomy in between the NS and BH groups, divided between . This is excellent qualitative support for the hypothesis that the electron cloud properties in NSs will be affected by additional seed photons from the neutron star, and that this will be observable in the emergent spectrum (Sunyaev & Titarchuk, 1989). In figure 5 we plot the normalised 1D posterior distributions of and for NSs and BHs,
| (3) |
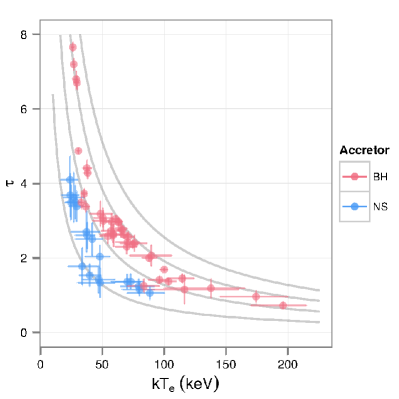
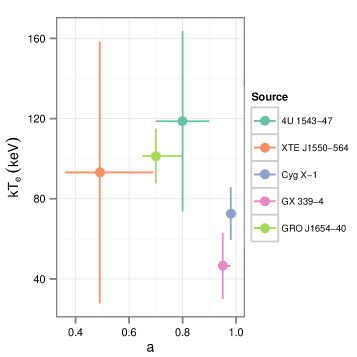
where is the number of spectra for a given source and denotes the 1D posterior distribution of for the spectrum of source . Figure 5 highlights the well known dearth of higher temperature () electron clouds in NS XBs which distribution peaks at keV. BH systems, on the other hand, cover a greater range of observed extending to keV. Interestingly, BH systems can be also observed at similar low as seen for NSs. The distribution of NS systems over -parameter is also narrow and strongly peaked at , whereas BH systems are rather broadly distributed between . Figure 5 illustrates that there is a clear dichotomy in the -parameter distribution with little overlap between BH and NS systems. In figure 6 we demonstrate that for a given optical depth the coronae in BH XBs will be at a higher temperature than that measured in NS XBs. Alternatively, it can be expressed in terms of BH coronae having larger optical depth at the same temperature.
Several assumptions were made during spectral analysis, including freezing some parameters at a fixed value for all sources. However, it is unlikely that this greatly affects our conclusions. The inclination is not well-constrained for a given source unless in extremis, for which dips or eclipses would be observed, but this is also when the inclination would have the greatest effect on our results (some studies suggest a dependence on with inclination Makishima et al., 2008; Zhang et al., 2014). Therefore the lack of extreme inclinations in our sample means that it is unlikely that the observed difference in is the result of some systematic difference in inclination between the BH and NS groups. To see if any dependence exists in our results, it is instructive to compare the analyses of Cyg X and GRO J1654-40, which are known to have and respectively. We find no firm evidence of a dependence between and in the current work. Two of the GRO J1654-40 spectra are consistent with those of Cyg X-1 in terms of (figure 2), while two have significantly smaller , and larger . The two GRO J1654-40 spectra that are consistent with those of Cyg X-1 in terms of and are at a higher (Table 4), and this fits with simple geometric reasoning that a higher (lower ) should be observed for a given luminosity the greater the inclination of the source.
5.2 Compton Amplification
We calculate a Compton amplification factor , which we define as the ratio of the measured luminosity in the keV band to the seed photon luminosity , which we calculate from the seed photon temperature and compps normalisation , for a source at distance
| (4) |
Note that with this definition, is only a proxy to the true value of the Compton amplification factor. The main sources of inaccuracy are: (i) the limited energy range in which the luminosity of the Comptonised component is calculated; (ii) lack of the correction for the interstellar absorption; (iii) a bias in measuring the temperature and normalisation of the seed photons spectrum caused by the limited low energy coverage of the RXTE data (see section 5.5). However, as shown in Section 5.5, these factors introduce a rather uniform downward bias in , affecting BH and NS systems in a similar way. The values of Compton amplification factor computed using the broad band data (combined XMM-Newton and RXTE) and corrected for the interstellar absorption are consistent with the values reported here within a factor of .
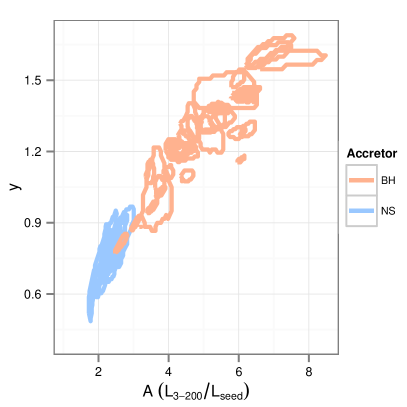
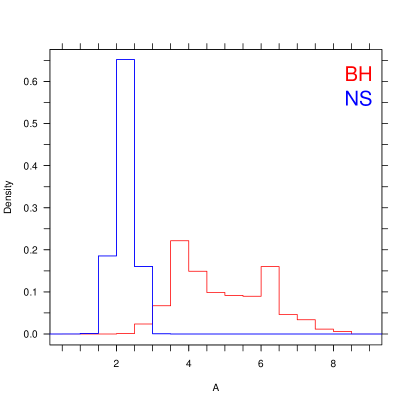
In figure 7 we plot the Compton parameter against , following a positive trend, which is expected as both quantities are a direct proxy for the Comptonising ability of the corona. We find that no NSs have , while BHs occupy a range of , as it is further illustrated in figure 8, where we plot the distribution of sources over the amplification factor, separately for NS and BH systems.
To understand the physical implications of our results in terms of the supply of seed photons, we invoke the following, admittedly very simplistic, considerations. In case of BHs, the Compton amplification factor is (assuming that seed photons are supplied by the accretion disk):
| (5) |
where the factor accounts for the fact that only some fraction of the disc emission is intercepted by the hot Comptonising corona. The largeness of the () is qualitatively consistent with the truncated disc picture (note however, that estimation of the disc truncation radius from eq.(5) requires knowledge of the factor and the feedback coefficient between the corona and the accretion disc (see Gilfanov et al., 1995).
In the case of NS, there is an additional potentially powerful source of soft emission, the surface of the neutron star, therefore the Compton amplification factor equals to:
| (6) |
where, as before, accounts for the fraction of disc photons intercepted by the corona and is a similar fraction for photons emitted by the neutron star. If the NS is surrounded by the (quasi-) spherically symmetric corona, , as (figure 6). It is plausible that the decrease of the Compton amplification factor in NS systems is caused by the contribution of the NS luminosity, rather than by a global change of the accretion geometry, therefore . For the purpose of this crude estimation we will further ignore and assume . Taking into account that and , where and are the energy release in the hot corona and on the NS surface, we can rewrite eq.(6):
| (7) |
from which we obtain:
| (8) |
We thus conclude that accreting material looses in the Comptonisation process in the corona about of the total energy it possessed upon entering the corona. Remaining energy is released in the form of kinetic energy of the infalling matter on the surface of the neutron star, thus making it a powerful source of soft seed photons for Comptonisation. This explains systematically lower Compton amplification factor and lower -parameter in the NS systems. It is interesting to note that the fraction of accretion energy released on the NS surface in the hard state is comparable to that in the soft state (Shakura & Sunyaev, 1988). It’s particular value in the hard state is controlled by the efficiency of Comptonisation and coupling between protons and electrons in the hot corona.
5.3 Effects of rotation on Comptonisation properties
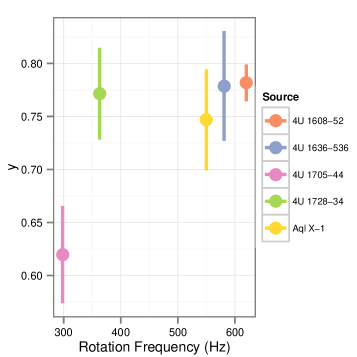
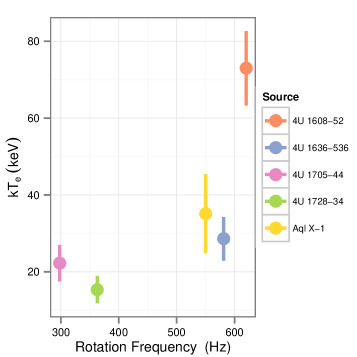
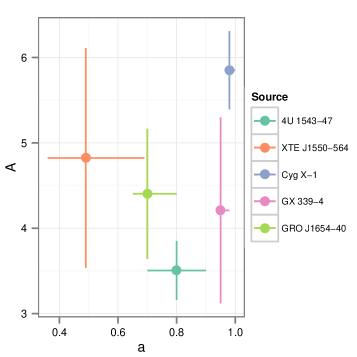
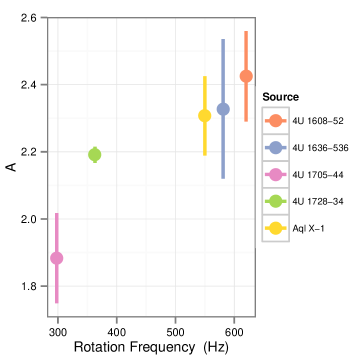
It is anticipated that the rotation of a compact object is an important parameter in the context of the spectral formation, and to test this we take the step of plotting the Comptonisation parameters against rotation frequency (for sources for which the rotation is known). For NS rotation we use measurements of the burst oscillation frequency (see e.g. Strohmayer et al., 1996) or in one instance the difference in frequency between kHz QPOs (4U , for which burst oscillations have never been observed, Ford, van der Klis & Kaaret, 1998), while for BHs we use the dimensionless spin parameter, , as found from either studies of the fluorescent iron line profile (see Fabian et al., 1989; Laor, 1991; Reynolds & Nowak, 2003), in the case of , or the thermal continuum of the accretion disc (Zhang, Cui & Chen, 1997; McClintock, Narayan & Steiner, 2014) for all other sources. In figure 9 we present the key Comptonisation parameters against compact object rotation. For each source we defined the mean value for each spectral parameter to be used as a characteristic value. Black hole spins were obtained from García et al. (2015) (GX ), Narayan, McClintock & Tchekhovskoy (2014) (GRO J, 4U ), Gou et al. (2014) (Cyg ), Steiner et al. (2011) (XTE J). Neutron star rotation frequencies were obtained from Muno et al. (2001) and Ford, van der Klis & Kaaret (1998) (4U ).
In the case of NSs, there seems to be some correlation between the spin frequency and the Compton amplification , which may also be present with and . The Spearman rank correlation test (Spearman, 1904) gives an estimate of the probability of appearance of the observed correlations of points by chance of 0.017, 0.08 and 0.13 for , and respectively. Therefore, the correlation of A with spin frequency is detected at the confidence level equivalent to for a Gaussian distribution. Although this is not enough to claim a confident detection, the probability of such correlation to be real is quite high.
A positive correlation between the strength of Comptonisation and the intrinsic NS rotation frequency is to be expected on theoretical grounds. Indeed, for the standard Keplerian accretion disk, the luminosity of the boundary layer on the NS surface is, in the Newtonian approximation:
| (9) |
where – the linear velocity of the neutron star surface at the equator and – Keplerian velocity near the NS surface (Shakura & Sunyaev, 1988; Kluzniak, 1988; Sibgatullin & Sunyaev, 2000). The higher the NS spin (i.e. higher )333note that in all cases where the NS spin is measured, , the smaller is the . As for NS systems , and, by definition, , higher spin systems should have smaller and, correspondingly, larger . In order words, for a slowly rotating NS, the luminosity of its surface is higher and Comptonisation in the corona is weaker. Copious soft photons are more efficient in cooling electrons of the corona, leading to decrease of , and (Sunyaev & Titarchuk, 1989). In the hard state sources considered here the inner accretion flow is hot, geometrically thick and probably, sub-Keplerian, however qualitatively, the picture outlined above holds. In addition to being a confirmation of the theoretical picture, this behaviour also presents the exciting potential of being able to determine a NS spin from the X-ray spectra alone.
For BHs, there is no such obvious trend between the Comptonisation properties and spin, however, these spins are much less well constrained than NS rotation frequencies and may be subject to systematic uncertainties arising from choice of spectral model.
5.4 Classifying compact objects from Comptonisation parameters
The observed dichotomy between BH and NS LMXBs in the properties of the Comptonising media has an intriguing potential as a diagnostic. Conclusive classification of a compact object as a BH requires dynamical mass measurements obtained by optical or IR spectroscopy of transient sources during quiescence, when the optical emission is dominated by the companion (see Charles & Coe, 2006, for review). The necessity for a source to be transient, and for the secondary to be bright enough to study with optical instrumentation, limits our ability to firmly identify BHs. However, there is an increasing list of behaviours that can be used to identify a system as containing a black hole ‘candidate’ (BHC). Examples of temporal behaviour displayed by NS LMXBs but not BH LMXBs include type-I X-ray bursts and a significant amount of noise in their X-ray variability at frequencies greater than Hz while in the hard state (Sunyaev & Revnivtsev, 2000). We can also look to the spectral properties, as BH sources should be softer during the so-called high state, where the emission from the disc dominates. Such emission is characterised by the temperature of innermost portion of the disc, the position of which is determined by the ISCO of the compact object, which we naturally expect to be larger for BHs than for NSs ( for which the inner disc radius my be determined by the NS radius). The temperature of the inner accretion disc has been used for the classification of BHs in Extragalactic studies (e.g. Brassington et al., 2010; Burke et al., 2013; Lin et al., 2015), where dynamical determination of the mass is nearly impossible and photon-starved X-ray lightcurves limit our ability to identify X-ray bursts but longer observation times yield an adequate spectral quality for analysis.
From the observed distribution of the the Compton y-parameter and amplification factor during the hard state we propose a further characteristic property for distinguishing BHs from NSs. The population is clearly bimodal about and (as measured over the keV energy band, see further discussion in §5.5), with some slight overlap (figure 5). Determination of the Compton parameter can be immediately incorporated into the analysis of newly discovered Galactic XBs and may prove effective for studying populations of Extragalactic XBs using future X-ray telescopes.
5.4.1 Comparison with other Comptonisation models
It is prudent to examine whether the observed parameter degeneracy is apparent when using different or more sophisticated Comptonisation models. For this task we choose eqpair (an extension of the code presented in Coppi, 1992, 1999), which considers a hot plasma within which a hybrid of thermal and non-thermal emission processes take place, while the reflection component is considered by the same routines as compps. The model is parametrised in terms of the ratio of the hard to soft compactnesses , the soft photon compactness , seed photon blackbody temperature , Thomson scattering depth , the fraction of power supplied to energetic particles that goes into accelerating non-thermal particles and the reflection fraction . An aspect of this particular model is that the electron temperature is not a parameter, but it is calculated self-consistently and can be extracted through setting the Xspec chatter level to 15.
Taking sources whose spectra were typical of those possessing either a BH or NS – 4U from the NSs and Cyg X-1 from the BHs – and we analysed several spectra for each source (those from P92023 for 4U , and from P20173 for Cyg X-1), but with eqpair taking the place of compps, achieving acceptable fits. The range of reported for each source was keV for the NS, and keV for the BH, consistent with our compps results (table 4). Most strikingly we observe a clear difference in the range of best-fit and values for the two objects. For the BH we find , while the NS varies between . As the total luminosity of escaping photons must be equal to the luminosity of the input photons for this model, which is to say , one can consider the a proxy for the amplification factor, the dichotomy in which appears to be preserved. For the NS we find in the range , and a range of for the BH. Just as the dichotomy in spectral parameters found using compps can be expressed as a different optical depth for a given (figure 6) and the two sources have quite different , the significance of the difference in is not immediately apparent. However, and seem to obey a separation between NSs and BHs in the same sense as the separation seen in figure 6. For this experiment, Xspec returned a range of , with no clear separation between BH and NS sources. Finally, we find for the BH, fully consistent with the value returned from compps, however, for the NS we find , significantly less than found previously. As the treatment of the reflection is the same for both compps and eqpair (using the ireflct model) this suggests there is some difference in spectral shape between the two Comptonisation models.
We emphasise that any attempt to use Comptonisation properties as a diagnostic of the nature of the compact object should first establish how the dichotomy is manifested in the specific spectral model being used. We caution against the practice of taking any favoured Comptonisation model that might happen to feature as a free parameter, performing spectral fitting and declaring evidence in favour of a BH or NS based on the results of this paper. Such experiments should always be prefaced by work establishing the dichotomy for that particular model using either known sources (as in this work) or by studying the effects of fitting such models to simulated compps spectra based on the ‘typical’ BH and NS spectral shapes (table 4).
5.5 Systematic inaccuracies in seed photon spectral parameters
On inspection the seed photon temperatures () and compps normalisations for some of the sources appear incompatible with the interpretation of the hard state in terms of a truncated disc. In this scenario an optically thick accretion disc provides the seed photons for Comptonisation in a hot corona close to the compact object. Truncation of the disc in the hard state is motivated by the absence of the thermal component that dominates the spectra during the high/soft state that is well-described in terms of the thermal spectrum expected from the optically thick, geometrically thin disc of Shakura & Sunyaev (1973). The peak temperature of this disc in the soft state is keV for BHs, and the inferred radius is consistent with the range of conceivable radii for the ISCO (see review by Done, Gierliński & Kubota, 2007). From the absence of such emission it follows that the disc must either be truncated at some radius during the hard state (Esin, McClintock & Narayan, 1997; Gilfanov, Churazov & Sunyaev, 1997; Churazov, Gilfanov & Revnivtsev, 2001), or have significant portions obscured by the Comptonising media. However, a non-truncated disc would cool the corona too quickly; increased Comptonisation leading to a reduction in the coronal temperature but increasing the incident flux of up-scattered photons back into the disc, in turn increasing the supply of seed photons.
| Source | R | y | Norm. | A | ||||
|---|---|---|---|---|---|---|---|---|
| keV | keV | keV | ||||||
| 4U 1636-536 | 3.0 | |||||||
| Cyg X-1 | 7.7 | |||||||
| GX 339-4 | 6.7 |
Truncation models are disputed despite a strong theoretical justification and an ability to offer prosaic qualitative explanations for various hard state phenomena, such as the launching of jets (e.g. Fender, Belloni & Gallo, 2004). Detractors primarily argue that the broadening of emission lines by smearing due to special and general relativistic effects shows that the line emitting region, assumed to be in the disc, must be close to the compact object (Miller et al., 2006; Reis, Fabian & Miller, 2010; Reis et al., 2012). These results are in-turn disputed on the grounds of unreliable data reduction (see discussions in Done & Diaz Trigo, 2010; Miller et al., 2010, regarding pile up effects on line profiles), the nature of the continuum modelling (Kolehmainen, Done & Díaz Trigo, 2014) and the constituents of the line profile itself (Plant et al., 2015, argue that there are many ionized species present in the vicinity of the Fe ) that result in an apparently broader line profile than any one individual line possesses.
For our BH sample, 3–200 keV luminosities are typically in the range, corresponding to the mass accretion rate of . From these mass accretion rates and the lower-limit to BH masses taken from Table 1, the theory of the standard accretion disc (Shakura & Sunyaev, 1973) predicts a maximal disc temperature for a non-rotating BH in the keV range. Correcting for spectral hardening (, Suleimanov et al., 2011) the observed temperatures should be in the range keV. These values of should be considered an upper-limit since they are calculated based on the lower mass estimate of the BHs, and we do not expect the disc to extend to the vicinity of the ISCO while in the hard state. For example, a disc truncated at will have innermost temperatures reduced to of the theoretical maximum because .
Across our sample of NS LMXBs the theoretical maximum disc temperature we estimate from the luminosities is keV, which becomes keV after correcting for spectral hardening. As for black holes, the temperature will be by a factor of a few smaller for a disc truncated at a . However, in the case of NSs a significant fraction of the seed photons may originate on the surface of the NS itself. Taking into account that the typical luminosity enhancement factor for NS sources is (figure 8), this implies an average seed photon luminosity (). Therefore the maximum temperature of the seed photon spectra, corrected for spectral hardening (assuming correction factor of , Suleimanov et al., 2011) should produce a typical keV, assuming the NS radius of km. These figures are in good agreement with an ongoing Suzaku study by Zhang et al. (in prep.).
From fitting RXTE spectra we obtain values of keV for BHs, and of keV for NSs (Table 4). For the majority of BHs, the best fit values are a factor of times larger than the expected for the truncated disk. The difference between measured and predicted temperatures may be much smaller in the case of NS systems, especially if the seed photon flux is dominated by the neutron star emission.
An important limitation of PCA data is that the spectral fitting can only be performed at energies keV, greater than the plausible values of , especially for BH XBs. We utilised data from simultaneous XMM Newton observations for three sources (table 3) to scrutinise the effect of the RXTE bandpass on , and other parameters. For each source we perform a joint analysis of the EPIC-pn spectrum between keV, the PCA data from keV and HEXTE data over keV. Prior inspection of the XMM data revealed a couple of narrow lines at keV and keV, which are thought to be the result of incorrect compensation for the charge transfer inefficiency of the CCD (Done & Diaz Trigo, 2010). We chose to ignore the data between 1.5 and 2.4 keV rather than further complicate the spectral model with additional lines. We fixed the PCA-HEXTE calibration to the values found from our principal RXTE analysis. A clear excess can be seen at energies keV, which is well-documented feature often modelled as disc emission characterised by keV (e.g. Miller et al., 2006; Gierliński, Done & Page, 2008; Reis, Fabian & Miller, 2010; Kolehmainen, Done & Díaz Trigo, 2014), or as an additional Comptonising component (Ibragimov et al., 2005) or as additional reflection (Clavel et al., 2016). We chose to describe this broad excess emission as the standard geometrically-thin, optically thick accretion disc of Shakura & Sunyaev (1973) using the Xspec model diskbb (Mitsuda et al., 1984). was allowed to vary during the fitting process because of the greater spectral resolution of XMM at energies that are especially influential to the behaviour of this parameter. Acceptable fits were obtained for all three sources and the recovered parameters of interest are presented in table 6.
The excess below 1 keV was adequately described by the diskbb component, and is characterised by an inner-disc temperature of keV, consistent with previous results (Miller et al., 2006; Shidatsu et al., 2013; Kolehmainen, Done & Díaz Trigo, 2014). It should be noted that exact spectral composition of the lower energy spectral shape is the subject of continued debate (for example there are good arguments for the addition of a second Comptonised component or additional reflection, Ibragimov et al., 2005; Sakurai et al., 2012; Clavel et al., 2016), and it is beyond the scope of the current work to reach a complete understanding of the disc geometry. Crucially, the disc seed photon temperatures are in line with expectations and other results in the literature.
As expected, there is reduction in the recovered seed photon temperature of compps when one considers a wider bandpass. For Cyg X-1 with the keV luminosity of ( M) the maximal disc colour temperature after correcting for spectral hardening () is keV. The measured value of keV is consistent with the disc truncated at for a non-rotating BH. In the case of GX , which is probably a less massive BH than Cyg X-1, the expected maximal colour temperature of the disc spans a plausible range of keV (corrected for spectral hardening). The measured value of keV implies a truncation could be as large as . Interestingly, for 4U 1636-536 we obtain from the broad band fit the temperature of keV, much smaller than the maximum expected for this neutron star luminosity,444note that replacing the multicolour disc seed photon spectrum with a black body spectrum further decreases the best-fit value of the seed photon temperature by 0.06 keV. keV, and comparable to the value expected in the accretion disc at .
The shift in between the different analyses is accompanied by some changes in other parameters of interest, in particular in the Comptonisation parameter . On the other hand, the electron temperature remains almost unaffected (tables 4 and 6).
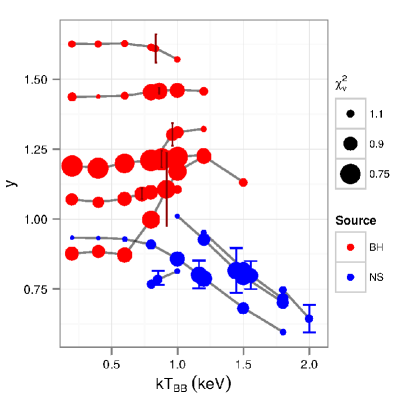
In order to investigate, how significantly the Comptonisation parameter may be affected by the bias in the seed photon temperature caused by the limited bandpass of RXTE, we conduct the following experiment. For a sub-sample of spectra (one spectrum for each source except for 4U1636-536 for which we analysed two spectra, see below), we perform simple fitting with our default spectral model, fixing across a grid of values. For each , we note the , and compare it with a limit corresponding to the theoretical null hypothesis of for a -distribution described by the number of degrees of freedom in that fit, and points with in excess of this are rejected. This gives an indication of the space covered by potential fits that we define as being ‘formally acceptable’. We present the results of this exercise in figure 10, which shows the behaviour of -parameter with , with the quality of the fit denoted by point size.
From this experiment we find that BH spectra are generally compatible with a broad range of , including low values keV predicted by the standard accretion disc model. While best fits generally prefer keV, low values of keV result in sufficiently small , which are formally acceptable (although often outside formal confidence intervals). NS systems, on the other hand, tend to favour higher values of keV. For majority of NS spectra low values of keV result in unacceptable fit quality. This behaviour is consistent with our expectations, that the source of seed photons in BH systems is the (truncated) accretion disk, while in NS systems it is the neutron star surface, having significantly higher temperature. BH systems are subject to a notable upward bias in the seed photon temperatures determined from fitting the 3–200 keV band data, which appears to be the result of the limited bandpass combined with the spectral model which is simplified and not fully adequate. However, there is virtually no degeneracy (with the exception of 4U ) between the seed photon temperature and the -parameter and electron temperature. The NS systems are subject to the bias in the to much lesser extent, if at all, because of the typically higher seed photon temperatures. Although they do show some degeneracy, their seed photon temperatures are measured sufficiently well with the RXTE data. Therefore the dichotomy between the BH coronal properties and those of NSs is secure irrespective of the inaccuracies in determination of the seed spectral properties.
The observation of 4U1636-536, for which simultaneous RXTE and XMM-Newton data were analysed above, seems to differ from other NS spectra555unfortunately, this was the only NS spectrum from our sample, for which simultaneous RXTE and XMM-Newton hard state data were available. The 0.5-200 keV band fitting gave low keV. Consistent with this, in the 3-200 keV fit, low values of keV result in formally acceptable values. On the other hand, the broad band data is consistent with high keV, producing formally acceptable values. In either case, the -parameter is staying well below the boundary. In interpreting these results one should bear in mind that the 0.5–200 keV and 3–200 keV data were fit with different spectral model, which in the former case included the diskbb component. Such behaviour is demonstrated by only this particular observation of the source. For comparison, we plot in figure 10 results for another spectrum of 4U1636-536, which in RXTE data shows a pattern similar to other NS systems.
Any systematic bias in estimating the seed spectral properties, when considering energies keV, will propagate to a bias in our calculation of the the amplification factor (§ 5.2). However, the effect of the reduced seed photon temperature on the calculated seed luminosity is countered by a concurrent increase in model normalisation, obtained in the 0.7-200 keV band fits. Using only RXTE data Cyg X-1 was found to have (), while fitting XMM+RXTE data indicates (see table 6). Comparing the joint XMM-RXTE fitting results with those found from studying the RXTE data only, the of 4U 1636-536 and GX 339-4 goes from to () and from to (), respectively. Therefore for these three sources, the found from fitting the keV is found from fitting the keV data. This further demonstrates that the inaccuracy in the seed photon parameters does not affect our conclusion that the coronae in BH systems are more strongly Comptonising than those found in NS XBs. For completeness, estimating the total unabsorbed flux in the upscattered component over the full bandwidth, keV, leads to a marginal increase in A by 0.7, 0.05 and 0.4 for 4U 1636-536, Cyg X-1 and GX 339-4 respectively. The resulting values of are shown in table 6.
6 Summary
We have analysed hard state spectra from a sample of Galactic X-ray binaries observed by the RXTE satellite. The spectra were well-described by thermal Comptonisation of seed photons from an accretion disc, which we modelled using the compps component in Xspec with an additional Gaussian component to account for fluorescent emission in the vicinity of the Fe complex. Our most striking result is the clear dichotomy in the Compton parameter and the Compton enhancement factor between NSs and BHs (figure 7). The boundary is located at and with black hole systems having systematically higher values of and . Distribution of and for neutron stars are rather narrow and strongly peaked at and ( after correction for absorption and RXTE bandpass). Electron temperature in BH systems can occupy rather broad range of values from keV, while in NS their distribution is strongly peaked at keV with very few spectra exceeding keV. For a given optical depth the electron temperature of the Comptonising media is systematically larger in black holes than in the neutron stars (figure 6). The values of the Compton amplification factor typical for NS systems suggest that in the hard state, accreting material is losing due to Comptonisation in the corona about of the total energy it possessed upon entering the Comptonisation region. Remaining energy is released on the surface of the NS in the form of kinetic energy of the infalling material, making it a powerful source of soft radiation. The smaller Compton parameter for NS LMXBs can be explained in terms of this additional supply of seed photons by the neutron star surface that is of course absent in the case of BHs. The observed dichotomy as a diagnostic tool has excellent potential for distinguishing BH from NS XBs both in our galaxy and beyond.
Acknowledgments
We acknowledge the use of the Legacy Archive for Microwave Background Data Analysis (LAMBDA), part of the High Energy Astrophysics Science Archive Center (HEASARC). HEASARC/LAMBDA is a service of the Astrophysics Science Division at the NASA Goddard Space Flight Center. MG acknowledges a partial support by the RFBR grant No. 15-42-02573. MG acknowledges hospitality of the Kazan Federal University (KFU) and support by the Russian Government Program of Competitive Growth of KFU. We thank the referee for their careful reading of the manuscript and insightful suggestions that improved the quality of the paper.
References
- Basko, Sunyaev & Titarchuk (1974) Basko M. M., Sunyaev R. A., Titarchuk L. G., 1974, A&A, 31, 249
- Belloni (2010) Belloni T. M., 2010, in Lecture Notes in Physics, Berlin Springer Verlag, Vol. 794, Lecture Notes in Physics, Berlin Springer Verlag, Belloni T., ed., p. 53
- Beloborodov (1999) Beloborodov A. M., 1999, ApJL, 510, L123
- Bennett et al. (1996) Bennett C. L. et al., 1996, ApJL, 464, L1
- Brassington et al. (2010) Brassington N. J. et al., 2010, ApJ, 725, 1805
- Buchner et al. (2014) Buchner J. et al., 2014, A&A, 564, A125
- Burke et al. (2013) Burke M. J. et al., 2013, ApJ, 766, 88
- Casares & Jonker (2014) Casares J., Jonker P. G., 2014, Space Sci. Rev., 183, 223
- Casares et al. (2009) Casares J. et al., 2009, ApJS, 181, 238
- Charles & Coe (2006) Charles P. A., Coe M. J., 2006, Optical, ultraviolet and infrared observations of X-ray binaries, Lewin W. H. G., van der Klis M., eds., pp. 215–265
- Churazov, Gilfanov & Revnivtsev (2001) Churazov E., Gilfanov M., Revnivtsev M., 2001, MNRAS, 321, 759
- Churazov et al. (1995) Churazov E. et al., 1995, ApJ, 443, 341
- Clavel et al. (2016) Clavel M., Rodriguez J., Corbel S., Coriat M., 2016, ArXiv e-prints
- Coppi (1992) Coppi P. S., 1992, MNRAS, 258, 657
- Coppi (1999) Coppi P. S., 1999, in Astronomical Society of the Pacific Conference Series, Vol. 161, High Energy Processes in Accreting Black Holes, Poutanen J., Svensson R., eds., p. 375
- Del Santo et al. (2013) Del Santo M., Malzac J., Belmont R., Bouchet L., De Cesare G., 2013, MNRAS, 430, 209
- Dickey & Lockman (1990) Dickey J. M., Lockman F. J., 1990, ARA&A, 28, 215
- Done & Diaz Trigo (2010) Done C., Diaz Trigo M., 2010, MNRAS, 407, 2287
- Done & Gierliński (2003) Done C., Gierliński M., 2003, MNRAS, 342, 1041
- Done, Gierliński & Kubota (2007) Done C., Gierliński M., Kubota A., 2007, A&AR, 15, 1
- Esin, McClintock & Narayan (1997) Esin A. A., McClintock J. E., Narayan R., 1997, ApJ, 489, 865
- Fabian et al. (1989) Fabian A. C., Rees M. J., Stella L., White N. E., 1989, MNRAS, 238, 729
- Fender, Belloni & Gallo (2004) Fender R. P., Belloni T. M., Gallo E., 2004, MNRAS, 355, 1105
- Feroz, Hobson & Bridges (2009) Feroz F., Hobson M. P., Bridges M., 2009, MNRAS, 398, 1601
- Ford, van der Klis & Kaaret (1998) Ford E. C., van der Klis M., Kaaret P., 1998, ApJL, 498, L41
- Galloway et al. (2003) Galloway D. K., Psaltis D., Chakrabarty D., Muno M. P., 2003, ApJ, 590, 999
- Galloway et al. (2006) Galloway D. K., Psaltis D., Muno M. P., Chakrabarty D., 2006, ApJ, 639, 1033
- García et al. (2015) García J. A., Steiner J. F., McClintock J. E., Remillard R. A., Grinberg V., Dauser T., 2015, ApJ, 813, 84
- Gelino et al. (2006) Gelino D. M., Balman Ş., Kızıloǧlu Ü., Yılmaz A., Kalemci E., Tomsick J. A., 2006, ApJ, 642, 438
- Gierliński, Done & Page (2008) Gierliński M., Done C., Page K., 2008, MNRAS, 388, 753
- Gilfanov (2010) Gilfanov M., 2010, in Lecture Notes in Physics, Berlin Springer Verlag, Vol. 794, The Jet Paradigm, Belloni T., ed., p. 17
- Gilfanov, Churazov & Revnivtsev (1999) Gilfanov M., Churazov E., Revnivtsev M., 1999, A&A, 352, 182
- Gilfanov, Churazov & Revnivtsev (2000) Gilfanov M., Churazov E., Revnivtsev M., 2000, in Proceedings of 5-th Sino-German workshop on Astrohpysics, 1999, Eds. Gang Zhao, Jun-Jie Wang, Hong Mei Qiu and Gerhard Boerner, SGSC Conference Series, vol.1, pp. 114–123
- Gilfanov, Churazov & Sunyaev (1997) Gilfanov M., Churazov E., Sunyaev R., 1997, in Lecture Notes in Physics, Berlin Springer Verlag, Vol. 487, Accretion Disks - New Aspects, Meyer-Hofmeister E., Spruit H., eds., p. 45
- Gilfanov et al. (1993) Gilfanov M. et al., 1993, ApJ, 418, 844
- Gilfanov et al. (1995) Gilfanov M. et al., 1995, in NATO Advanced Science Institutes (ASI) Series C, Vol. 450, The Lives of Neutron Stars, Alpar M. A., Kiziloglu U., van Paradijs J., eds., p. 331
- Gilfanov, Revnivtsev & Molkov (2003) Gilfanov M., Revnivtsev M., Molkov S., 2003, A&A, 410, 217
- Gou et al. (2014) Gou L. et al., 2014, ApJ, 790, 29
- Haardt & Maraschi (1993) Haardt F., Maraschi L., 1993, ApJ, 413, 507
- Hasinger & van der Klis (1989) Hasinger G., van der Klis M., 1989, A&A, 225, 79
- Hjellming & Rupen (1995) Hjellming R. M., Rupen M. P., 1995, Nature, 375, 464
- Hynes et al. (2004) Hynes R. I., Steeghs D., Casares J., Charles P. A., O’Brien K., 2004, ApJ, 609, 317
- Ibragimov et al. (2005) Ibragimov A., Poutanen J., Gilfanov M., Zdziarski A. A., Shrader C. R., 2005, MNRAS, 362, 1435
- Jonker & Nelemans (2004) Jonker P. G., Nelemans G., 2004, MNRAS, 354, 355
- Kalberla et al. (2005) Kalberla P. M. W., Burton W. B., Hartmann D., Arnal E. M., Bajaja E., Morras R., Pöppel W. G. L., 2005, A&A, 440, 775
- Khargharia et al. (2013) Khargharia J., Froning C. S., Robinson E. L., Gelino D. M., 2013, AJ, 145, 21
- Kluzniak (1988) Kluzniak W., 1988, PhD thesis, Stanford Univ., CA.
- Kolehmainen, Done & Díaz Trigo (2014) Kolehmainen M., Done C., Díaz Trigo M., 2014, MNRAS, 437, 316
- Laor (1991) Laor A., 1991, ApJ, 376, 90
- Lin et al. (2015) Lin D. et al., 2015, ArXiv e-prints
- Lin, Remillard & Homan (2007) Lin D., Remillard R. A., Homan J., 2007, ApJ, 667, 1073
- Magdziarz & Zdziarski (1995) Magdziarz P., Zdziarski A. A., 1995, MNRAS, 273, 837
- Makishima et al. (2008) Makishima K. et al., 2008, PASJ, 60, 585
- Markoff, Falcke & Fender (2001) Markoff S., Falcke H., Fender R., 2001, A&A, 372, L25
- Markoff, Nowak & Wilms (2005) Markoff S., Nowak M. A., Wilms J., 2005, ApJ, 635, 1203
- McClintock, Narayan & Steiner (2014) McClintock J. E., Narayan R., Steiner J. F., 2014, Space Sci. Rev., 183, 295
- Merloni & Fabian (2001) Merloni A., Fabian A. C., 2001, MNRAS, 321, 549
- Meyer & Meyer-Hofmeister (1994) Meyer F., Meyer-Hofmeister E., 1994, A&A, 288, 175
- Miller et al. (2010) Miller J. M. et al., 2010, ApJ, 724, 1441
- Miller et al. (2006) Miller J. M., Homan J., Steeghs D., Rupen M., Hunstead R. W., Wijnands R., Charles P. A., Fabian A. C., 2006, ApJ, 653, 525
- Mitsuda et al. (1984) Mitsuda K. et al., 1984, PASJ, 36, 741
- Muñoz-Darias, Casares & Martínez-Pais (2008) Muñoz-Darias T., Casares J., Martínez-Pais I. G., 2008, MNRAS, 385, 2205
- Muno et al. (2001) Muno M. P., Chakrabarty D., Galloway D. K., Savov P., 2001, ApJL, 553, L157
- Nandra & Pounds (1994) Nandra K., Pounds K. A., 1994, MNRAS, 268, 405
- Narayan, McClintock & Tchekhovskoy (2014) Narayan R., McClintock J. E., Tchekhovskoy A., 2014, Energy Extraction from Spinning Black Holes Via Relativistic Jets, Bičák J., Ledvinka T., eds., p. 523
- Orosz et al. (2002) Orosz J. A. et al., 2002, ApJ, 568, 845
- Orosz et al. (1998) Orosz J. A., Jain R. K., Bailyn C. D., McClintock J. E., Remillard R. A., 1998, ApJ, 499, 375
- Orosz et al. (2011a) Orosz J. A., McClintock J. E., Aufdenberg J. P., Remillard R. A., Reid M. J., Narayan R., Gou L., 2011a, ApJ, 742, 84
- Orosz et al. (2011b) Orosz J. A., Steiner J. F., McClintock J. E., Torres M. A. P., Remillard R. A., Bailyn C. D., Miller J. M., 2011b, ApJ, 730, 75
- Plant et al. (2015) Plant D. S., Fender R. P., Ponti G., Muñoz-Darias T., Coriat M., 2015, A&A, 573, A120
- Poutanen, Krolik & Ryde (1997) Poutanen J., Krolik J. H., Ryde F., 1997, MNRAS, 292, L21
- Poutanen & Svensson (1996) Poutanen J., Svensson R., 1996, ApJ, 470, 249
- Reid et al. (2011) Reid M. J., McClintock J. E., Narayan R., Gou L., Remillard R. A., Orosz J. A., 2011, ApJ, 742, 83
- Reis, Fabian & Miller (2010) Reis R. C., Fabian A. C., Miller J. M., 2010, MNRAS, 402, 836
- Reis et al. (2012) Reis R. C., Miller J. M., Reynolds M. T., Fabian A. C., Walton D. J., 2012, ApJ, 751, 34
- Remillard & McClintock (2006) Remillard R. A., McClintock J. E., 2006, ARA&A, 44, 49
- Revnivtsev (2003) Revnivtsev M., 2003, A&A, 410, 865
- Revnivtsev, Gilfanov & Churazov (2001) Revnivtsev M., Gilfanov M., Churazov E., 2001, A&A, 380, 520
- Revnivtsev et al. (2006) Revnivtsev M., Sazonov S., Gilfanov M., Churazov E., Sunyaev R., 2006, A&A, 452, 169
- Reynolds & Nowak (2003) Reynolds C. S., Nowak M. A., 2003, Phys. Rep., 377, 389
- Rieke & Lebofsky (1985) Rieke G. H., Lebofsky M. J., 1985, ApJ, 288, 618
- Ritter & Kolb (2003) Ritter H., Kolb U., 2003, A&A, 404, 301
- Ross & Fabian (2005) Ross R. R., Fabian A. C., 2005, MNRAS, 358, 211
- Sakurai et al. (2012) Sakurai S., Yamada S., Torii S., Noda H., Nakazawa K., Makishima K., Takahashi H., 2012, PASJ, 64, 72
- SAS development Team (2014) SAS development Team, 2014, SAS: Science Analysis System for XMM-Newton observatory. Astrophysics Source Code Library
- Shahbaz (2003) Shahbaz T., 2003, MNRAS, 339, 1031
- Shakura & Sunyaev (1973) Shakura N. I., Sunyaev R. A., 1973, A&A, 24, 337
- Shakura & Sunyaev (1988) Shakura N. I., Sunyaev R. A., 1988, Advances in Space Research, 8, 135
- Shidatsu et al. (2013) Shidatsu M. et al., 2013, ApJ, 779, 26
- Sibgatullin & Sunyaev (2000) Sibgatullin N. R., Sunyaev R. A., 2000, Astronomy Letters, 26, 699
- Spearman (1904) Spearman C., 1904, The American Journal of Psychology, 15, 72
- Steiner et al. (2011) Steiner J. F. et al., 2011, MNRAS, 416, 941
- Strohmayer & Bildsten (2006) Strohmayer T., Bildsten L., 2006, New views of thermonuclear bursts, Lewin W. H. G., van der Klis M., eds., pp. 113–156
- Strohmayer et al. (1996) Strohmayer T. E., Zhang W., Swank J. H., Smale A., Titarchuk L., Day C., Lee U., 1996, ApJL, 469, L9
- Suleimanov et al. (2011) Suleimanov V., Poutanen J., Revnivtsev M., Werner K., 2011, ApJ, 742, 122
- Sunyaev & Revnivtsev (2000) Sunyaev R., Revnivtsev M., 2000, A&A, 358, 617
- Sunyaev & Titarchuk (1989) Sunyaev R. A., Titarchuk L., 1989, in ESA Special Publication, Vol. 296, Two Topics in X-Ray Astronomy, Volume 1: X Ray Binaries. Volume 2: AGN and the X Ray Background, Hunt J., Battrick B., eds., pp. 627–631
- Sunyaev & Titarchuk (1980) Sunyaev R. A., Titarchuk L. G., 1980, A&A, 86, 121
- Syunyaev et al. (1991) Syunyaev R. A. et al., 1991, Soviet Astronomy Letters, 17, 409
- Tanaka & Shibazaki (1996) Tanaka Y., Shibazaki N., 1996, ARA&A, 34, 607
- Zdziarski et al. (2003) Zdziarski A. A., Lubiński P., Gilfanov M., Revnivtsev M., 2003, MNRAS, 342, 355
- Zdziarski, Lubiński & Smith (1999) Zdziarski A. A., Lubiński P., Smith D. A., 1999, MNRAS, 303, L11
- Zhang, Cui & Chen (1997) Zhang S. N., Cui W., Chen W., 1997, ApJL, 482, L155
- Zhang et al. (2014) Zhang Z., Makishima K., Sakurai S., Sasano M., Ono K., 2014, PASJ, 66, 120