SDSSJ143244.91+301435.3 at VLBI: a compact radio galaxy in a narrow-line Seyfert 1
Abstract
We present VLBI observations, carried out with the European Very Long Baseline Interferometry Network (EVN), of SDSSJ143244.91+301435.3, a radio-loud narrow-line Seyfert 1 (RL NLS1) characterized by a steep radio spectrum. The source, compact at Very Large Array (VLA) resolution, is resolved on the milliarcsec scale, showing a central region plus two extended structures. The relatively high brightness temperature of all components (5106-1.3108 K) supports the hypothesis that the radio emission is non-thermal and likely produced by a relativistic jet and/or small radio lobes. The observed radio morphology, the lack of a significant core and the presence of a low frequency (230 MHz) spectral turnover are reminiscent of the Compact Steep Spectrum sources (CSS). However, the linear size of the source (0.5 kpc) measured from the EVN map is lower than the value predicted using the turnover/size relation valid for CSS sources (6 kpc). This discrepancy can be explained by an additional component not detected in our observations, accounting for about a quarter of the total source flux density, combined to projection effects. The low core-dominance of the source (CD0.29) confirms that SDSSJ143244.91+301435.3 is not a blazar, i.e. the relativistic jet is not pointing towards the observer. This supports the idea that SDSSJ143244.91+301435.3 may belong to the “parent population” of flat-spectrum RL NLS1 and favours the hypothesis of a direct link between RL NLS1 and compact, possibly young, radio galaxies.
keywords:
galaxies: active - galaxies: nuclei - quasars: individual: SDSSJ143244.91+301435.31 Introduction
Narrow-line Seyfert 1 (NLS1) galaxies represent a class of Active Galactic Nuclei (AGN) characterized by narrow (2000 km s-1) Balmer lines, weak [OIII]5007Å emission compared to the Balmer lines ([OIII]5007Å/H flux ratio below 3) and strong optical FeII emission (e.g. Osterbrock & Pogge 1985; Goodrich 1989; Pogge 2000; Veron-Cetty et al. 2001). The optical properties of NLS1 are usually explained as the consequence of a combination of a low-mass (108 M⊙) central supermassive black-hole (SMBH) with a high accretion rate (close to the Eddington limit). Most of the NLS1 are radio-quiet (RQ) objects while a minority (7 per cent, Komossa et al. 2006) are radio-loud (RL), using the common definition based on the 5 GHz to 4400Å flux density ratio (R5, where RL NLS1 have R10) or an (almost) equivalent definition based on the 1.4 GHz flux density (R1.4, where RL NLS1 have R19, Komossa et al. 2006). The 110 RL NLS1 discovered so far, have been discussed in a number of papers (e.g. Komossa et al. 2006; Yuan et al. 2008; Foschini et al. 2015; Berton et al. 2015; Gu et al. 2015).
A peculiarity of the RL NLS1 discovered to date is that most of them present a compact radio emission (linear size below a few kpc, e.g. Doi et al. 2012 and references therein). Some of the RL NLS1 with the highest values of radio-loudness show strict similarities with blazars (BL Lac objects and flat spectrum radio quasar, FSRQ): a flat or inverted radio spectrum, high brightness temperatures (1011 K, e.g. Yuan et al. 2008) and a detectable gamma-ray emission (in Fermi-LAT, Abdo et al. 2009a; Abdo et al. 2009b; Foschini 2011; Foschini et al. 2015; Liao et al. 2016; Yao et al. 2015a; Yao et al. 2015b). Since blazars are usually believed to be radio galaxies whose relativistic jets are pointing towards the observer (e.g. Urry & Padovani 1995), a natural conclusion is that most of the RL NLS1 discovered so far should also have their jets aligned within small angles to the line of sight. If this picture is correct we expect a population of mis-oriented and unbeamed sources, the so-called parent population, that in the standard beaming model (e.g. Urry & Padovani 1995) is constituted by the class of lobe-dominated radio galaxies. To date, however, only in few RL NLS1 an extended emission has been detected (Whalen et al. 2006; Antón, Browne & Marchã 2008; Doi et al. 2012; Richards & Lister 2015) and only one RL NLS1 (SDSSJ120014.08–004638.7) is a lobe-dominated radio galaxy (Doi et al. 2012). This may suggest that RL NLS1 are intrinsically lacking an extended radio emission component on large scales or that these structures are not detected due to selection effects (e.g. see Richards & Lister 2015). Several hypotheses for the parent population have been recently considered and discussed by Berton et al. (2015) and Berton et al. (2016).
An interesting possibility is that RL NLS1 are young or “frustrated” radio galaxies that either have not yet fully deployed their radio lobes on large scales (at least tens of kpc) or they will never be able to form them. This possibility was suggested on the basis of the similarities found between some RL NLS1 and Compact Steep-Spectrum (CSS) or GHz-Peaked Spectrum (GPS) sources (e.g. Oshlack, Webster & Whiting 2001; Gallo et al. 2006; Komossa et al. 2006; Yuan et al. 2008; Caccianiga et al. 2014; Gu et al. 2015; Gu et al. 2016; Schulz et al. 2016) that are usually believed to be young radio galaxies (e.g. Fanti et al. 1995).
A direct test of this hypothesis, however, is not simple. In sources with the jet oriented close to the line of sight, i.e. RL NLS1 with blazar properties, the analysis of any possible extended emission is difficult due to the dominance of the beamed nuclear emission. Conversely, if the sources have the jet axis close to the plane of the sky, the possible presence of obscuration in the optical and X-rays makes it difficult, if not impossible, to study the nuclear properties and, therefore, to establish the NLS1 nature. A direct test would only be possible by finding and studying sources oriented at intermediate angles, where the NLS1 nature can be established and, at the same time, the amplification of the nuclear emission is not too severe for the analysis of the extended radio properties to be fruitfully carried out. We believe that we have found at least one of such objects: SDSSJ143244.91+301435.3, a new RL NLS1 that we have recently discussed (Caccianiga et al. 2014, hereafter referred as C14) and which shows radio properties suggesting a non-blazar nature. In this second paper we present the results of a radio follow up at a resolution of 0.01 arcsecond carried out using the European VLBI Network (EVN) at 1.66 GHz.
Throughout the paper spectral indices are given assuming S, and we assume a flat CDM cosmology with H0=71 km s-1 Mpc-1, =0.7 and =0.3.
2 SDSSJ143244.91+301435.3: a rare case of steep-spectrum RL NLS1
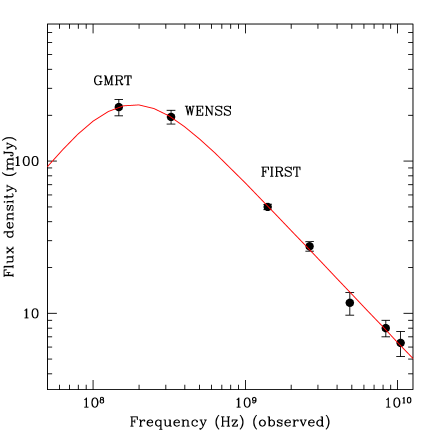
SDSSJ143244.91+301435.3 (z=0.355, implying a conversion factor of 4.9 pc/m.a.s.) is one of the few (a dozen in total discovered so far) RL NLS1 with a radio-loudness parameter, R1.4, of the order of 500 (corresponding to =120, computed at 5 GHz). The radio emission, however, is different from that usually observed in RL NLS1 with such a high value of R1.4, since it shows a steep (=0.93) optically thin radio spectrum (Fig. 1). Based on the size of the radio emission (1.4 kpc, from the analysis of FIRST data) this object is a compact radio source. The steep radio spectrum and the lack of variability and polarization (as discussed in C14), instead, disfavor the hypothesis that the observed compactness is due to the orientation of a relativistic jet towards the observer, as in blazars. The compact morphology and the steep radio spectrum are characteristics remarkably similar to those observed in CSS sources. The radio spectrum shows a flattening below 300 MHz, consistent with the presence of a turnover around 200 MHz, a distinctive feature observed in CSS sources. However the lack of sensitive data at low frequencies, at the time of the publication of C14, prevented us from firmly establishing the position of such possible turnover.
Since the publication of C14 a new sensitive all-sky survey at 150 MHz carried out with the Giant Metrewave Radio Telescope (GMRT) has been released (Intema et al. 2016). Thanks to the good sensitivity of this survey, SDSSJ143244.91+301435.3 is clearly detected and its flux density is well determined. The total and the peak flux densities (S150MHz=226.127.9 mJy, S=206.823.8 mJy/beam) are not significantly different thus confirming the compactness of the source also at this low frequency (the resolution is 2525). In C14 we used the flux density taken from the 7C survey (Hales et al. 2007) which, however, is more uncertain (330 80 mJy) than the GMRT measurement and is likely to include some contribution from nearby sources (see C14). We now use the GMRT flux density and study again the shape of the radio spectrum (Fig. 1).
We fit the observed points with a smooth broken power-law model:
| (1) |
| Log | Log | Red. Chi. sq | ||
|---|---|---|---|---|
| (mJy) | (Hz) | |||
| 2.37 | 8.23 | 1.05 | -1.28 | 1.26 |
| (2.33, 2.41) | (8.17, 8.33) | (1.00, 1.11) | (-3.03, -0.45) |
The best fit parameters are reported in table 1. The turnover at 170 MHz (observed frame) corresponds to an intrinsic turnover at 230 MHz (rest frame). The value of the turnover is within the range observed in CSS (e.g. Fanti et al. 1995; O’Dea 1998). A more accurate characterization of the turnover will be possible in the near future thanks to the availability of the data from the ongoing Multifrequency Snapshot Sky Survey (MSSS) carried out with LOFAR in the 30 to 74 MHz (LBA) and in the 120 to 160 MHz (HBA) frequency range.
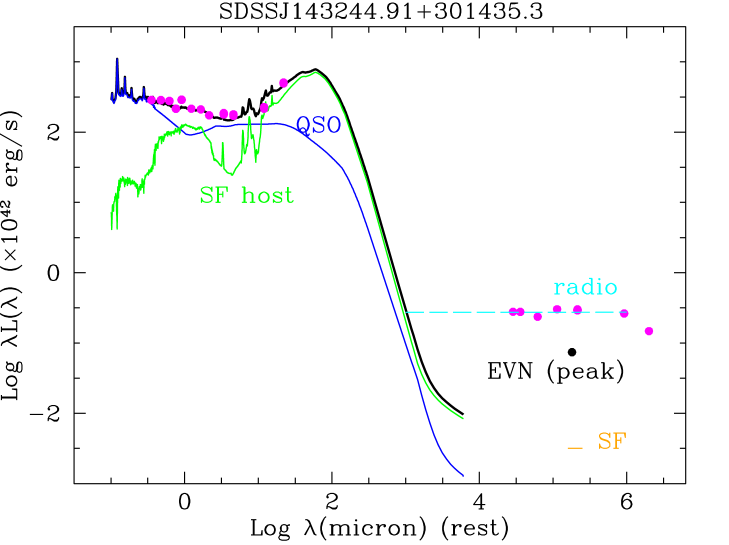
A second important characteristic of SDSSJ143244.91+301435.3 is the presence of a highly star-forming host galaxy (star-formation rate, SFR, 50 M☉ y-1), as inferred from the analysis of the optical-to-mid-IR Spectral Energy Distribution (see C14). This characteristic seems to be common to most of the RL NLS1 discovered so far, as discussed in Caccianiga et al. (2015). Since star-formation (SF) activity is expected to produce a significant radio emission, it is possible that the radio flux density observed in some RL NLS1 is not entirely due to the AGN (see discussion in Caccianiga et al. 2015).
Overall, the properties of SDSSJ143244.91+301435.3, and in general of RL NLS1, suggest a complex phenomenology that require high resolution radio data to distinguish between the different components (e.g. jet vs SF) and to establish the possible connection with other classes of radio sources, like the CSS/GPS radio galaxies. With these goals we have carried out a follow-up of SDSSJ143244.91+301435.3 using the EVN. The results are discussed in the following sections.
3 EVN observation

3.1 Observations and data reduction
SDSSJ143244.91+301435.3 was observed at 1.658 GHz with the EVN from UT=20:00 June 01, to UT=02:00 June 02, 2014 (project EC048). Ten telescopes participated in the observation, but only eight provided useful data, namely Effelsberg (Germany), Noto (Italy), Onsala (Sweden), Toruń (Poland), Shanghai (China), the Westerbork Synthesis Radio Telescope (WSRT, the Netherlands), Svetloe and Zelenchukskaya (Russia) while Badary (Russia) and Jodrell Bank (UK) could not provide any useful data due to technical problems. The JIVE correlator delivered data with 2s integrations for parallel hand data (RR and LL correlations) for 8 IFs covering 8MHz bandwidth each, for a total bandwidth of 64 MHz for each polarisation.
The phase-referenced observation of the target was interleaved with the observation of a phase calibrator (J1435+3012) which is 0.61 degrees apart from SDSSJ143244.91+301435.3, with a duty cycle in which the telescopes tracked the calibrator and target for 2 and 7.5 min respectively. Four 2-min scans on an additional calibrator (J1635+3808) were carried out for calibrating the amplitudes and the bandpass profile.
The EVN data were then processed using the NRAO AIPS package, following standard procedures of amplitude and bandpass calibration, fringe fitting of the calibration sources and solution transfer to the target, as in phase-referencing mode observation data reduction, allowing the recovery of the absolute position of the radio emitting components on the sky. Based on gain variations during the experiment we conservatively assume that the accuracy of the calibration of the absolute flux-density scale is within 10 per cent. Then accurate imaging was performed for all the sources to test the quality of the a-priori calibration, including self-calibration. No significant problem was found.
The field of the target source presents significant emission with the peak shifted by about 50 m.a.s. in RA and -140 m.a.s. in Dec, with respect to the position used for the correlation (RA= 14:32:44.917; Dec= 30:14:35.510). The final uniformly weighted, full-resolution image has a restoring beam of 14.7 x 10.6 m.a.s. in p.a. , and a r.m.s. noise level of 50 Jy/beam. Since the image accounts for about 34 mJy, a few iterations of phase-only self-calibration were performed. We also obtained a naturally weighted image (not shown) with a restoring beam of 27.1 x 18.3 m.a.s. in p.a. accounting for exactly the same total flux density.
3.2 Analysis
The full-resolution EVN map (Fig. 2) shows a rather complex structure, without a straightforward classification of the morphology. The peak in the image is 10.75 mJy/beam at RA=14h32m44.9203s and DEC=30d14′35.374″. We performed a number of Gaussian fits (task JMFIT) to the central region accounting for about 34 mJy varying the size of the fitted region and the starting model. The best results were obtained with three components (see Tab 1) labeled A, B and C in Fig. 2, where the asymmetric crosses highlight the major, minor axes and the position angle of the major axis of each component. The best fit was chosen on the basis of the residual image and its r.m.s obtained after the subtraction of the model image from the one in Fig. 2. Indeed the fitting of all the three components simultaneously did not provide a fair result. Our best result was obtained by selecting two regions to fit components A+B, first and then another region for fitting C alone. The total flux density of the three components exceeds by about 1 mJy the measurement taken by means of the task TVSTAT. A fit with two Gaussian components, roughly coincident with A and B, was in better agreement with the TVSTAT flux density, but left some residual flux density in the East part of the radio emitting region and provided a Gaussian profile more elongated than that reported in table 2.
We extrapolated the source flux density at 1.66 GHz by considering the flux density of 50 mJy measured by both the FIRST (Becker, White & Helfand 1995) and the NVSS (Condon et al. 1998) surveys at 1.46 GHz and at lower resolution, scaling it by the optically thin spectral index (see Section 2). This yields a predicted total flux density of about 44 mJy. Therefore, about 10 mJy (22 per cent of the total flux density) are not accounted for in our observation.
Component A accounts for the brightest region in Fig. 2. It turns out to be resolved, with an axial ratio of about 2.2, with the de-convolved major axis larger than the beam size and the minor axis exceeding the 70% of the beam in its direction. It is likely that this region harbours the core, which would be better visible at higher frequencies and with better resolutions. As discussed in section 2, the overall spectrum of the source is quite steep, and therefore the absence of a dominant core is not surprising. The whole region A accounts for about 45 per cent of the total flux density of the source, and the true core may account at most for a few percent of the total flux density at 1.66 GHz, in agreement with what is known in CSS-GPS radio sources, where the cores are generally weak (e.g. Dallacasa et al. 2013). Component B roughly describes the largest emitting region in Fig. 2, elongated from the NE to the SW, with an axial ratio of 3.3. Finally, component C has the lowest surface brightness detected here and a roundish structure, with an axial ratio of 1.7.
It is not clear whether the outer regions (extending on both sides of component A) can be considered as asymmetric mini lobes of a young radio loud AGN. This is often found in CSS and GPS sources (e.g. Orienti, Dallacasa & Stanghellini 2007) The NE region appears rather broad and the jet interpretation can be ruled out. The SW region is closer to the central component and we would need a better resolution to properly define its nature. It is however consistent with being the opposite counterpart of the NE emission. For a firm characterisation of the properties of the source at VLBI scales, images at another frequency are necessary. At the moment we can exclude a core-jet structure and support a morphology consistent with young radio sources.
Since we have no evidence for variability in this source (see discussion in C14) the 10 mJy missing flux density in our image are likely to be associated with an extended component with a low surface brightness, below the detection threshold of our EVN image.
A useful parameter to quantify the relative importance of the core with respect to the extended emission is the core dominance (CD) which is defined as the ratio between the core and the extended emission in a radio source. If we use the peak flux density measured from the EVN map (Spk=10.75 mJy/beam) as an upper limit of the core emission and the extrapolated FIRST/NVSS flux density as the total flux density (Stot=44 mJy), the value of CD is:
| (2) |
In case we consider the peak of component A (Spk=9.96 mJy/beam), the core dominance lowers to 0.29. The CD value indicates that SDSSJ143244.91+301435.3 is not core-dominated (CD1), in agreement with the observed steep radio radio spectrum.
| Comp. | RA | DEC. | Peak flux density | Total flux density | Maj Axis | Min Axis | P.A. | TB |
|---|---|---|---|---|---|---|---|---|
| (J2000.0) | J(2000.0) | (mJy beam-1) | (mJy) | (m.a.s.) | (m.a.s.) | (Deg) | (K) | |
| A | 14 32 44.9203 | +30 14 35.374 | 9.96 0.05 | 19.70 0.14 | 17.4 0.2 | 8.0 0.2 | 146 1 | 1.26 |
| B | 14 32 44.9202 | +30 14 35.383 | 1.76 0.05 | 11.21 0.34 | 48.2 1.3 | 14.8 0.8 | 64 1 | 1.39 |
| C | 14 32 44.9232 | +30 14 35.394 | 0.70 0.05 | 4.79 0.36 | 38.9 3.0 | 23.3 1.9 | 175 1 | 4.69 |
3.3 Jet vs. star-formation
In C14 we have found that SDSSJ143244.91+301435.3 is harboured by a highly star-forming host galaxy, with an estimated star-formation rate of 50 M☉ y-1. In principle, a fraction of the observed radio emission could be due to SF activity. In Fig. 3 we present the Spectral Energy Distribution (SED) of SDSSJ143244.91+301435.3, from UV to radio wavelengths where we also show the different templates that have been used to model the SED, including a radio-quiet QSO and a starburst host galaxy template (M82, see C14 for details). Since the M82 template does not include the radio band, we have added the expected emission from the SF component at 1.4 GHz based on the analysis described in C14. Basically, this is the emission expected from the mid-IR luminosity of the starburst host. As discussed in C14, the expected contribution from the SF to the radio emission is negligible (1 per cent). VLBI observations can be used to directly test this conclusion, since high brightness temperatures (T107 K) are not expected in case of thermal emission (e.g. Giroletti & Panessa 2009).
We compute the value of TB using the relation (Ulvestad, Antonucci & Barvainis 2005):
| (3) |
where is the flux density at 1.6 GHz expressed in mJy, is the observed frequency in GHz, is the de-convolved size of the source in m.a.s.2 and is the redshift. For z=0.355, =1.658 GHz and using the flux densities and de-convolved sizes reported in Table 1 we obtain =1.3108 K, 1.4107 K and 4.7106 K for the 3 Gaussian components. These values disfavour the hypothesis of a thermal origin of the emission (e.g. from SF) and support the idea that we are observing the non-thermal emission from jets/lobes. Further support could come from polarimetric studies to be carried out at high frequencies, to minimize the severe depolarization usually observed in young radio sources (e.g. Rossetti et al. 2008)
3.4 Linear size
The NE-SW elongation of SDSSJ143244.91+301435.3 on the EVN map is about 100 m.a.s. which translates into a (projected) linear size of about 0.5 kpc. Given the observed correlation between the turnover frequency and the source linear size in CSS and GPS sources (O’Dea 1998; Orienti & Dallacasa 2014) it is possible to infer an independent estimate of the linear size of SDSSJ143244.91+301435.3 starting from the position of the turnover. If we assume the turnover frequency of 230 MHz computed in Section 2 and if we use the relation in Orienti & Dallacasa (2014), the size of the source is predicted to be about 6 kpc, which is one order of magnitude larger than the value measured from the EVN map. The difference is significant even considering the scatter of the turnover/size relation and the uncertainty on the turnover frequency.
A possible explanation for the observed discrepancy is that the EVN observations are missing the most extended structures of the source. Indeed, as previously discussed, we know that the EVN observation is missing some flux density (10 mJy) which is likely distributed in extended structures, located between 0.5 kpc and 1.4 kpc, i.e. the maximum size measured by the low resolution map (FIRST). However, the upper limit of 1.4 kpc based on the FIRST map is still below the expectations from the turnover frequency, although the difference is less significant considering the scatter on the turnover/size relation and the uncertainty on the turnover frequency. The possibility that an even more extended structure has been missed also by the FIRST map is unlikely since the measured flux density is fully consistent with that measured at even lower resolution by the NVSS survey (see C14 for details).
Another possibility is that the small size of SDSSJ143244.91+301435.3 is due to projection effects. Since in SDSSJ143244.91+301435.3 we are able to directly observe the optical nucleus without significant obscuration (see C14), it is likely that the source is observed at an intermediate angle between the beaming cone and the plane of the sky. At these angles, projection effects could be important as in CSS with a QSO-like spectrum (e.g. Orienti 2016). We can roughly estimate a lower limit on the jet orientation (hence an upper limit on the projection effects) using the upper limit on the core-dominance parameter, measured in Section 3.4. In the context of the beaming model (Urry & Padovani 1995), this quantity is directly related to the source’s orientation by the relation:
| (4) |
where is the ratio between the luminosity emitted by the jet (in the source’s frame) and the unbeamed luminosity, is the Doppler factor defined as . Here, and are the Lorentz factor and the ratio between the bulk velocity and the light speed respectively while is the angle between the observer and the direction of the relativistic jet. The exponent p is equal to +2 for a continuous jet where is the spectral index (see Urry & Padovani 1995 for a detailed description of the beaming model).
In blazars, the values of typically range from 2 to 30 (Urry & Padovani 1995) while is expected to assume values between 0.01 and 1 (e.g. Urry & Padovani 1995). For RL NLS1 these parameters have not been studied in details yet but first results on few objects seem to indicate that the Lorentz factors of flat spectrum RL NLS1 are similar to those observed in blazars, although in the lower end of the distribution (e.g. Doi, Asada & Nagai 2011; D’Ammando et al. 2012; D’Ammando et al. 2013; Lister et al. 2016; Fuhrmann et al. 2016). The analysis of the radio luminosity function (RLF) of flat-spectrum RL NLS1 and its comparison with that of CSS sources, seems to confirm that the average Lorentz factor (10) in RL NLS1 is within the typical distribution observed in blazars, while it suggests higher values for the parameter , close to 1 (Berton et al. 2016). For =1 and =10, the expected viewing angle is 30° corresponding to a de-projection factor of 2 and a de-projected linear size of 1 kpc for the EVN structure alone. A reasonable estimate of the maximum value of the projection factor can be obtained combining a high value of Lorentz factor with a low value of . Using =30 and =0.01 the expected de-projection factor is about 7, corresponding to a maximum de-projected linear size of 3.5 kpc. This value is within the scatter of the turnover/size relation in Orienti & Dallacasa (2014). Therefore, the projection effect alone could in principle explain the discrepancy between the measured linear size and the predictions from the turnover frequency but only if rather extreme values for the beaming parameters are assumed.
A more realistic possibility is that the difference between the size expected from the turnover frequency and the measured one is a combination of both the non detection of extended structures by the EVN map and some projection effects.
Finally, we should also mention the possibility that the size vs turnover relation, which has been derived using objects more powerful than SDSSJ143244.91+301435.3, could not be valid at lower radio powers.
4 Comparison with other RL NLS1
Out of the 110 RL NLS1 discovered so far, only 25 have been studied at VLBI resolution, including both flat and steep spectrum objects (Doi, Asada & Nagai 2011; Gu et al. 2015; Orienti et al. 2015; Gu et al. 2016; Schulz et al. 2016).
In general, flat spectrum RL NLS1 show single-core or core-jet morphologies with high brightness temperatures (up to 21011 K) strongly suggesting the presence of a relativistically boosted jet (Doi, Asada & Nagai 2011; Gu et al. 2015; Orienti et al. 2015; Schulz et al. 2016). Even if high, the values of TB are on average lower than those observed in blazars, something that may indicate lower Doppler factors when compared to blazars (i.e. larger inclinations and/or lower Lorentz factors, Gu et al. 2015).
RL NLS1 with steep spectra, like SDSSJ143244.91+301435.3, also show unresolved cores but with lower brightness temperatures than flat spectrum RL NLS1 (Gu et al. 2015). Steep spectrum sources have often (but not always) extended structures and diffuse emission on pc scales (up to 100 pc, Doi, Asada & Nagai 2011; Gu et al. 2015). These properties indicate that Doppler boosting is probably not significant in most of the steep spectrum RL NLS1 (Doi, Asada & Nagai 2011). The steep spectrum combined with a compact size resembles the properties of CSS, as pointed out by Doi, Asada & Nagai (2011) and Gu et al. (2015), although the observed morphologies appear different from those usually observed in CSS that are typically characterized by two-sided structures and where the core is rarely observed (e.g. Dallacasa et al. 1995; Dallacasa et al. 2013; Orienti 2016).
The VLBI properties of SDSSJ143244.91+301435.3 are more similar to those observed in (some) steep spectrum RL NLS1 than those usually seen in flat spectrum RL NLS1. However, SDSSJ143244.91+301435.3 differs from the other steep spectrum RL NLS1 observed so far, since it lacks a strong unresolved core and it has most of the radio emission distributed in extended structures (within 500 pc). From this point of view, SDSSJ143244.91+301435.3 is morphologically more similar to CSS sources than the RL NLS1 observed so far.
The morphology observed in SDSSJ143244.91+301435.3 presents also some similarities with what is observed in the few radio-quiet NLS1 studied with VLBA by Doi et al. (2013). In the 5 RQ NLS1 detected at 1.7 GHz, a large fraction of the radio power comes from diffuse emission components distributed within the central 300 pc nuclear region, although a high brightness temperature (6107 K) core is also detected, suggesting the presence of a jet (Doi et al. 2013). In particular, MRK 1239 shows a morphology that resembles that observed in SDSSJ143244.91+301435.3 but on a smaller scale (40 pc). Another similarity is that RQ NLS1 have often a steep radio spectrum (Moran 2000) like the one observed in SDSSJ143244.91+301435.3. In spite of these similarities, the radio-loudness parameter of the RQ NLS1 is two orders of magnitude lower than in SDSSJ143244.91+301435.3 (R1, in RQ NLS1, to be compared to R5=160 of SDSSJ143244.91+301435.3). Another important difference is that the masses of the central SMBH of the 5 RQ NLS1 detected at VLBA are significantly lower (8105-1.4107 M⊙, Doi et al. 2013) than the mass measured in SDSSJ143244.91+301435.3 (3.2107 M⊙, C14).
5 Summary and Conclusions
We have presented VLBI observations carried out with EVN of SDSSJ143244.91+301435.3, a steep spectrum RL NLS1 that has been recently classified as a possible CSS source (C14). The results can be summarized as follows:
-
•
EVN observations have resolved SDSSJ143244.91+301435.3 which shows a quite complex structure without a clear morphology. The total flux density accounted for in the EVN image (34 mJy) is divided into 3 components: a central, more compact (but resolved), emission, containing more than half of the total correlated flux density, plus two extended structures. The lack of a strong unresolved component (core) is consistent with what is usually observed in steep-spectrum young radio sources.
-
•
The high brightness temperature of the radio components detected in the EVN map (T5106-1.3108 K) dis-favours the hypothesis that star-forming activity (detected in the mid-IR band) is the main origin of the observed radio emission and strongly supports a non-thermal origin.
-
•
The size of the extended structure (100-150 m.a.s., corresponding to 0.5 kpc) is smaller than the value inferred from the linear size/turnover relation valid for the CSS/GPS galaxies. This is likely due to the non-detection of a low surface brightness component in the EVN map combined to projection effects.
Overall, the EVN observations support the idea that SDSSJ143244.91+301435.3 is a CSS source with the relativistic jet observed at larger angles than the flat-spectrum RL NLS1 studied so far. The fact of observing directly the nuclear emission in the optical, without significant obscuration, suggests that SDSSJ143244.91+301435.3 is probably not oriented on the plane of the sky but at intermediate angles. VLBI observations at high frequencies would prove this hypothesis since they are expected to detect a stronger, mildly boosted, radio core.
These results confirm that SDSSJ143244.91+301435.3 likely belongs to the parent population of the RL NLS1 with a blazar spectrum and favour the idea that these sources can be directly related to young radio galaxies. A systematic follow-up at VLBI resolution, similar to the one discussed here, of all the RL NLS1 will be fundamental to test this hypothesis on a firm statistical basis.
Acknowledgments
We thank the referee for his/her useful comments that improved the quality of the paper. The European VLBI Network is a joint facility of independent European, African, Asian, and North American radio astronomy institutes. Scientific results from data presented in this publication are derived from the following EVN project code: EC048. LB acknowledges support from the Italian Space Agency (contract ASI INAF NuSTAR I/037/12/0).
References
- Abdo et al. (2009a) Abdo A. A. et al., 2009a, ApJ, 707, 727
- Abdo et al. (2009b) Abdo A. A. et al., 2009b, ApJ, 707, L142
- Antón, Browne & Marchã (2008) Antón S., Browne I. W. A., Marchã M. J., 2008, A&A, 490, 583
- Becker, White & Helfand (1995) Becker R. H., White R. L., Helfand D. J., 1995, ApJ, 450, 559
- Berton et al. (2016) Berton M. et al., 2016, A&A, 591, 98
- Berton et al. (2015) Berton M. et al., 2015, A&A, 578, 28
- Caccianiga et al. (2014) Caccianiga A. et al., 2014, MNRAS, 441, 172 (C14)
- Caccianiga et al. (2015) Caccianiga A. et al., 2015, MNRAS, 451, 1795
- Condon et al. (1998) Condon J. J., Cotton W. D., Greisen E. W., Yin Q. F., Perley R. A., Taylor G. B., Broderick J. J., 1998, AJ, 115, 1693
- Dallacasa et al. (1995) Dallacasa D., Fanti C., Fanti R., Schilizzi R. T., Spencer R. E., 1995, A&A, 295, 27
- Dallacasa et al. (2013) Dallacasa D., Orienti M., Fanti C., Fanti R., Stanghellini C., 2013, MNRAS, 433, 147
- D’Ammando et al. (2013) D’Ammando F. et al., 2013, MNRAS, 433, 952
- D’Ammando et al. (2012) D’Ammando F. et al., 2012, MNRAS, 426, 317
- Doi et al. (2013) Doi A., Asada K., Fujisawa K., Nagai H., Hagiwara Y., Wajima K., Inoue M., 2013, ApJ, 765, 69
- Doi, Asada & Nagai (2011) Doi A., Asada K., Nagai H., 2011, ApJ, 738, 126
- Doi et al. (2012) Doi A., Nagira H., Kawakatu N., Kino M., Nagai H., Asada K., 2012, ApJ, 760, 41
- Fanti et al. (1995) Fanti C., Fanti R., Dallacasa D., Schilizzi R. T., Spencer R. E., Stanghellini C., 1995, A&A, 302, 317
- Foschini (2011) Foschini L., 2011, in proceeding of ”Narrow-Line Seyfert 1 Galaxies and their place in the Universe”, April 4-6, 2011, Milano, Italy, eds. L. Foschini, M. Colpi, L. Gallo, D. Grupe, S. Komossa, K. Leighly, S. Mathur. PoS, Trieste, Italy, vol. NLS1, published online
- Foschini et al. (2015) Foschini L. et al., 2015, A&A, 575, A13
- Fuhrmann et al. (2016) Fuhrmann L. et al., 2016, Research in Astron. Astrophys, in press
- Gallo et al. (2006) Gallo L. C. et al., 2006, MNRAS, 370, 245
- Giroletti & Panessa (2009) Giroletti M., Panessa F., 2009, ApJ, 706, L260
- Gu et al. (2016) Gu M., Chen Y., Komossa S., Yuan W., Shen Z., 2016, AN, 337, 125
- Gu et al. (2015) Gu M., Chen Y., Komossa S., Yuan W., Shen Z.-Q., Wajima K., Zhou H., Zensus J. A., 2015, ApJS, 221, 3
- Hales et al. (2007) Hales S. E. G., Riley J. M., Waldram E. M., Warner P. J., Baldwin J. E., 2007, MNRAS, 382, 1639
- Intema et al. (2016) Intema H. T., Jagannathan P., Mooley K. P., Frail D. A., 2016, A&A, submitted, (arXiv:1603.04368)
- Komossa et al. (2006) Komossa S., Voges W., Xu D., Mathur S., Adorf H.-M., Lemson G., Duschl W. J., Grupe D., 2006, AJ, 132, 531
- Liao et al. (2016) Liao N.-H., Liang Y.-F., Weng S.-S., Gu M.-F., Fan Y.-Z., 2016, ApJS, in press, (arXiv:1510.05584)
- Lister et al. (2016) Lister M. L. et al., 2016, AJ, 152, 12
- Moran (2000) Moran E. C., 2000, New Astronomy Reviews, 44, 527
- O’Dea (1998) O’Dea C. P., 1998, PASP, 110, 493
- Orienti (2016) Orienti M., 2016, AN, 337, 9
- Orienti & Dallacasa (2014) Orienti M., Dallacasa D., 2014, MNRAS, 438, 463
- Orienti, Dallacasa & Stanghellini (2007) Orienti M., Dallacasa D., Stanghellini C., 2007, A&A, 461, 923
- Orienti et al. (2015) Orienti M., D’Ammando F., Larsson J., Finke J., Giroletti M., Dallacasa D., Isacsson T., Hoglund J. S., 2015, MNRAS, 453, 4037
- Oshlack, Webster & Whiting (2001) Oshlack A. Y. K. N., Webster R. L., Whiting M. T., 2001, ApJ, 558, 578
- Richards & Lister (2015) Richards J. L., Lister M. L., 2015, ApJ, 800, L8
- Rossetti et al. (2008) Rossetti A., Dallacasa D., Fanti C., Fanti R., Mack K.-H., 2008, A&A, 487, 865
- Schulz et al. (2016) Schulz R. et al., 2016, A&A, 588, 11
- Ulvestad, Antonucci & Barvainis (2005) Ulvestad J. S., Antonucci R. R. J., Barvainis R., 2005, ApJ, 621, 123
- Urry & Padovani (1995) Urry C. M., Padovani P., 1995, PASP, 107, 803
- Whalen et al. (2006) Whalen D. J., Laurent-Muehleisen S. a., Moran E. C., Becker R. H., 2006, AJ, 131, 1948
- Yao et al. (2015a) Yao S., Yuan W., Komossa S., Grupe D., Fuhrmann L., Liu B., 2015a, AJ, 150, 23
- Yao et al. (2015b) Yao S., Yuan W., Zhou H., Komossa S., Zhang J., Qiao E., Liu B., 2015b, MNRAS, 454, L16
- Yuan et al. (2008) Yuan W., Zhou H. Y., Komossa S., Dong X. B., Wang T. G., Lu H. L., Bai J. M., 2008, ApJ, 685, 801