Linking Behavior in the PER Coauthorship Network
Linking Behavior in the PER Coauthorship Network
Abstract
There is considerable long-term interest in understanding the dynamics of collaboration networks, and how these networks form and evolve over time. Most of the work done on the dynamics of social networks focuses on well-established communities. Work examining emerging social networks is rarer, simply because data is difficult to obtain in real time. In this paper, we use thirty years of data from an emerging scientific community to look at that crucial early stage in the development of a social network. We show that when the field was very young, islands of individual researchers labored in relative isolation, and the coauthorship network was disconnected. Thirty years later, rather than a cluster of individuals, we find a true collaborative community, bound together by a robust collaboration network. However, this change did not take place gradually—the network remained a loose assortment of isolated individuals until the mid-2000s, when those smaller parts suddenly knit themselves together into a single whole. In the rest of this paper, we consider the role of three factors in these observed structural changes: growth, changes in social norms, and the introduction of institutions such as field-specific conferences and journals. We have data from the very earliest years of the field, a period which includes the introduction of two different institutions: the first field-specific conference, and the first field-specific journals. We also identify two relevant behavioral shifts: a discrete increase in coauthorship coincident with the first conference, and a shift among established authors away from collaborating with outsiders, towards collaborating with each other. The interaction of these factors gives us insight into the formation of collaboration networks more broadly.
I Introduction
There is considerable interest in understanding the dynamics of coauthorship networks—in particular, how changes in the culture and institutions of a field affect the nature of its research community. This is important, because there is evidence suggesting that the structure of knowledge mirrors the social structure of the community producing that knowledge1. Moreover, coauthorship connections are one part of a collaborative system which facilitates (or impedes) the spread of information. Thus, the progress of a field of research will be shaped by the patterns of collaboration within it. Indeed, administrative and funding agencies have spent considerable money and effort attempting to change existing patterns of collaboration to improve researcher productivity and participation in science (e.g. the National Science Foundation programs to build community).
Coauthorship networks as a static entity have been studied extensively2, 3, 4, 5, 6. The dynamics of coauthorship networks have also been explored in a range of academic fields, including mathematics (1940-1999 7), sociology (1969-1999 8), biotech (1988-1999 9), economics (1970-2000 10), network science (1998-2006 11), and astrophysics (1998-1999, 2001-2006 12). Unfortunately, due to data constraints, these studies have largely focused on the dynamics of relatively established academic communities. In this paper, we use thirty years of bibliometric data from physics education research (PER) to look at how the structure of the coauthorship network evolves during the crucial early stages in the development of an academic community. Since 1981, the field of PER has grown dramatically, from a handful of researchers, to hundreds of authors publishing over 150 articles per year. During this same period, the collaborative community also changed, evolving from islands of individual researchers laboring in relative isolation, into a true collaborative community, bound together by a robust collaboration network. However, that change did not take place gradually: it happened suddenly and dramatically in the mid-2000s.
This prompts a question: what is the source of the changes we see in this emerging community? During this period, two different institutions are introduced: the first field-specific conference, and the first field-specific journals. We also identify two relevant behavioral shifts: a discrete increase in coauthorship coincident with the first conference, and a shift among established authors away from collaborating with outsiders, towards collaborating with each other. The interaction of these factors gives us insight into the formation of collaboration networks more broadly.
II Network Terminology
For those unfamiliar with network terminology, it is valuable to define a variety of terms that we will use below. A network, , consists of nodes (represented by circles) and links (represented by lines). Nodes are generally agents of some kind; in this case, they are authors in the field of PER. A link between nodes A and B indicates a relationship between the two agents; in this case, authors and are connected if they have coauthored a paper together. Each link has a weight, , representing the strength of the relationship. In this case, we will weight links by the number of papers two authors have written together. The network at large consists of a number of connected components: sets of nodes that can all be accessed by traveling across links in the network. The largest of the components is called the largest connected component (LCC) The degree of node , , is the number of direct connections she has. In the case of a collaboration network, an author’s degree is the number of coauthors she has. A node’s centrality represents how important the node is in the collaboration network. There are many types of network centrality, which are interpreted differently. Degree centrality is the simplest, representing the node’s degree in the network, normalized by the maximum possible degree: , where is the number of nodes in the network. Eigenvector centrality, on the other hand, reflects the fact that nodes connected to important nodes are likely more important themselves. It is called eigenvector centrality because if we represent the network as a matrix, , where if and are connected, and otherwise, then the eigenvector centrality of node is the th entry of the normalized eigenvector associated with the largest eigenvalue of . Eigenvector centrality may be different than degree centrality because an author connected to a few giants in the field will be more important than an author connected to a large number of unknown authors.
III Data selection
In this paper, we look at PER publications written between 1981 and 2010. This time period is particularly valuable, because it encompasses most of the early history of the field, including the introduction of several milestone institutions. It is also a period of dramatic growth and change in the community, making it an ideal window into the early life of the field. Arguably, PER has roots in the broader science education community, with intellectual parents in Dewey13 and Arons 14, 15. However, in the US, PER has only been housed in departments of physics since the mid-1970s, and the research community took on an identity of its own substantially after 1980. Thus, starting our data collection in 1981 reasonably captures the development of the field.
Our data come from three journals: The American Journal of Physics (AJP), the Physics Education Research Conference Proceedings (PERC Proceedings), and Physical Review Special Topics—Physics Education Research (PhysRev-PER). Our data collection ended before the journal changed to its present name, Physical Review—Physics Education Research. These are the three most-common peer-reviewed outlets for PER in the US. While PER authors publish in other journals, and PER community members commonly read and cite articles from other sources, each of those other sources publishes fewer PER articles per year and is read by a much broader audience than these three. It’s difficult to estimate how many other papers are written or read by PER community members because the tail on the publication venue distribution is very long. However, papers from these three journals comprise about half of all papers on PERticles, a community-supported reference aggregation group, aimed at recent papers of interest to PER readers. The full PERticles database is less relevant to our needs, because 1) it is not a complete listing of PER articles and 2) it predominately chronicles recent papers. Given that our interest is in early-stage development, we have chosen to use the full records of the top three journals instead.
For each journal, we use the bibliographic information for all relevant articles. In the PERC Proceedings and PhysRev-PER, we assume that all content is PER-related. In AJP, where much of the content is of more general physics interest, articles are hand-coded by a member of the field (Steve Kanim) to identify PER papers. This gives us a data set of 1114 PER papers: 276 in AJP, 481 in PERC Proceedings, and 226 in PhysRev-PER.
Author names were reduced to first, middle initial, last and then hand-disambiguated by a member of the field (Eleanor C Sayre). Authors who changed their names during the relevant time period were listed under their most recent name; no two authors in this time period had the same names as each other.
One advantage of using early-stage data is that this period includes several important field-specific milestones. Figure 2 shows a timeline, including the PER workshop in 1997 (a precursor to the Physics Education Research Conference (PERC) introduced in 1998), the PERC Proceedings in 2001, and PhysRev-PER in 2005. This period also includes the appearance of several PER-specific graduate programs, and the growth of National Science Foundation funding for PER.
IV Network Size
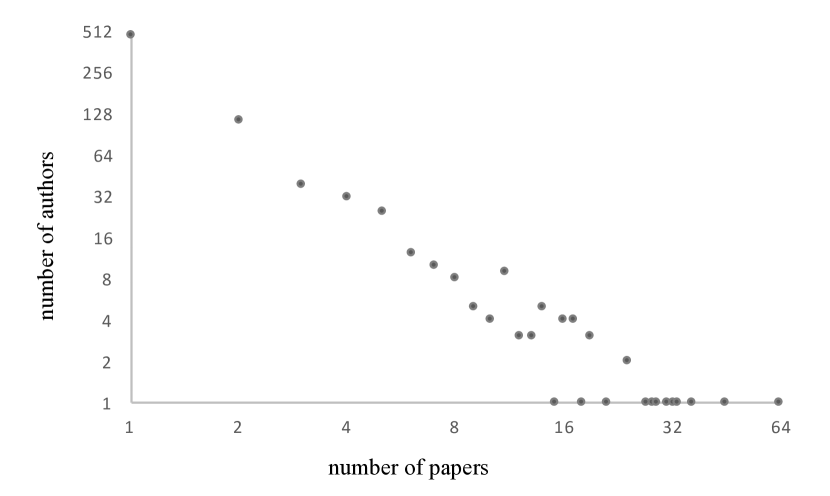
Over this time period, there are a total of 760 unique authors. Two authors have been active in our data set over the entire 30 year period. Authors publish an average one paper per year. However, not all authors produce the same number of papers. Figure 3 shows a log-log plot of the distribution of papers across authors. This distribution is quite skewed, meaning that a small number of authors publish a disproportionate number of papers—the most prolific 20% of authors in the field have written over 65% of the papers. A similar pattern can be seen in many other academic fields3, 7, 8.
IV.1 Coauthorship behavior
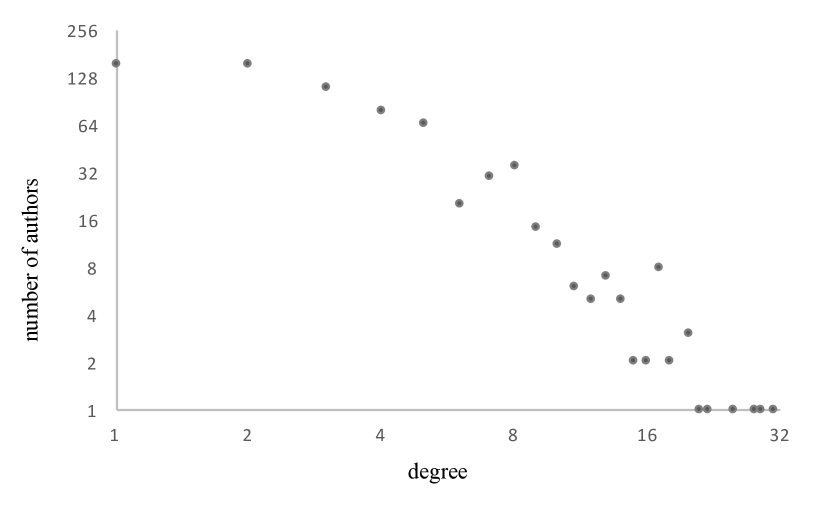
The coauthorship network for PER is much as one would expect for a field of academic research. In PER, as in many academic areas, there is wide variation in coauthorship behavior among authors. A handful of researchers have a large number of coauthors, while most researchers have very few. The average researcher has 4.1 coauthors, but three authors (0.3%) have more than 30 coauthors, 12 authors (1.2%) have more than 20 coauthors, and 60 authors (6.3%) have more than 10 coauthors. (see Figure 1). A similar pattern can be seen in many other academic fields, including physics3, 5, biology3, 5, 9, math7, neuroscience16 economics10, sociology8, and business17.

IV.2 Central members
In addition to the number of papers for each person, both degree centrality and eigenvector centrality have been proposed as measures of prominence in a community. Table 1 lists the top 5 authors in the community according to number of papers, number of coauthors, and eigenvector centrality.
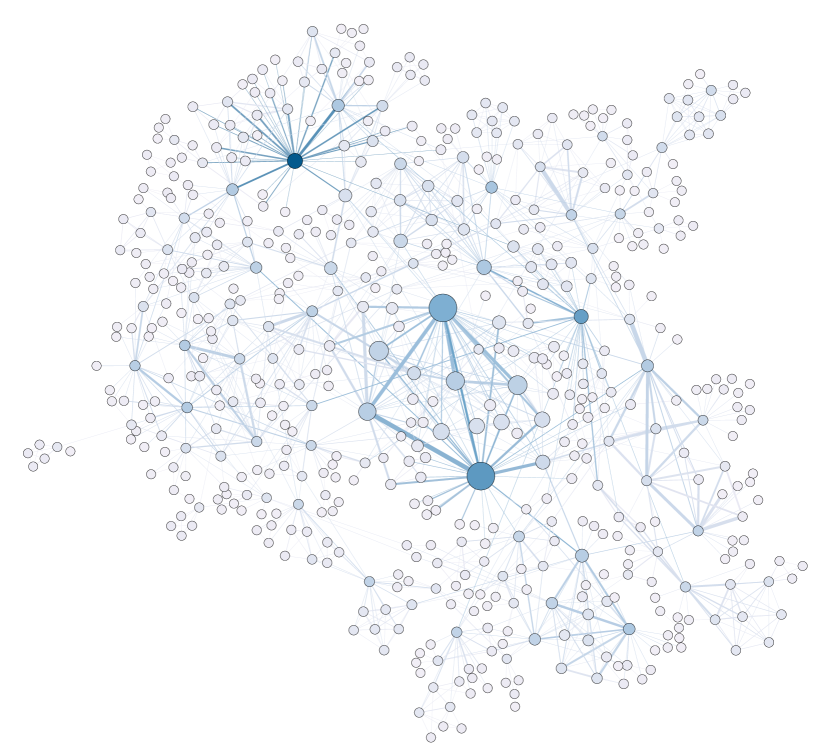
Recent work has suggested that eigenvector centrality may be a better measure of prominence in a community than degree. In particular, there is some indication that individuals with high eigenvector centrality are more influential when it comes to disseminating information 18. In the context of academic production, one might also argue that degree does not capture the relationship between advisors and their graduate students: authors who primarily coauthor with graduate students who then leave the field are less prominent than authors who mentor successful graduate students, and those who work with other giants in the field. In Figure 4, the nodes are sized by the number of coauthors and colored by eigenvector centrality. The nodes with the highest eigenvector centrality are not, generally speaking, the nodes with the highest degree.
Interestingly, the top members of the eigenvector centrality group are all senior or former members of the University of Colorado at Boulder (PER@C) group, while the top members of the number of coauthors and number of publications groups come from a much wider distribution of research groups. The high eigenvector centrality of faculty at the University of Colorado researchers is partially attributable to their graduate students and postdocs: alumni from this program are unusually successful as they proceed in their careers. This lends credence to the idea that the difference between eigenvector centrality and degree centrality reflects differences in the success of advisors in producing quality graduate students and postdocs.
| number of publications | number of coauthors | eigenvector centrality | |||
|---|---|---|---|---|---|
| Noah D. Finkelstein | 69 | Sanjay Rebello | 39 | K.K. Perkins | .47 |
| Chandralekha Singh | 65 | Noah D. Finkelstein | 32 | Noah D. Finkelstein | .44 |
| Sanjay Rebello | 54 | Lei Bao | 31 | S.J. Pollock | .43 |
| Charles Henderson | 41 | K.K. Perkins | 28 | Wendy K. Adams | .26 |
| S.J. Pollock | 40 | Robert Beichner | 22 | Carl E. Wieman | .25 |
V Community Growth
As can be seen in Figure 2, the field of PER has grown dramatically in the past 30 years, with most of that growth in our data set occurring in the last ten years. Initially, the number of papers grows slowly but in the early 2000s, it explodes. The growth in the number of authors is very similar, indicating that there is a growth in the overall size of the field, rather than simply an increase in the average number of papers written per person.
In addition to the overall growth, this period also sees a dramatic change in the pattern of collaborative interactions within the field, as tracked through the coauthorship network. Figure 4 shows a representation of the LCC of the PER coauthorship network, aggregated over the entire time period.
V.1 The emergence of a community
This aggregate picture of the community is largely in line with what we see in other scientific fields. However, one of the more interesting aspects of these data is the opportunity to look at the development of the community over time, particularly as it moves from the very earliest stages into a more mature community. In several ways, the evolution of this network is similar to that seen in longitudinal studies of mature fields. But we also observe several features that appear to be unique to early-stage collaborative communities.
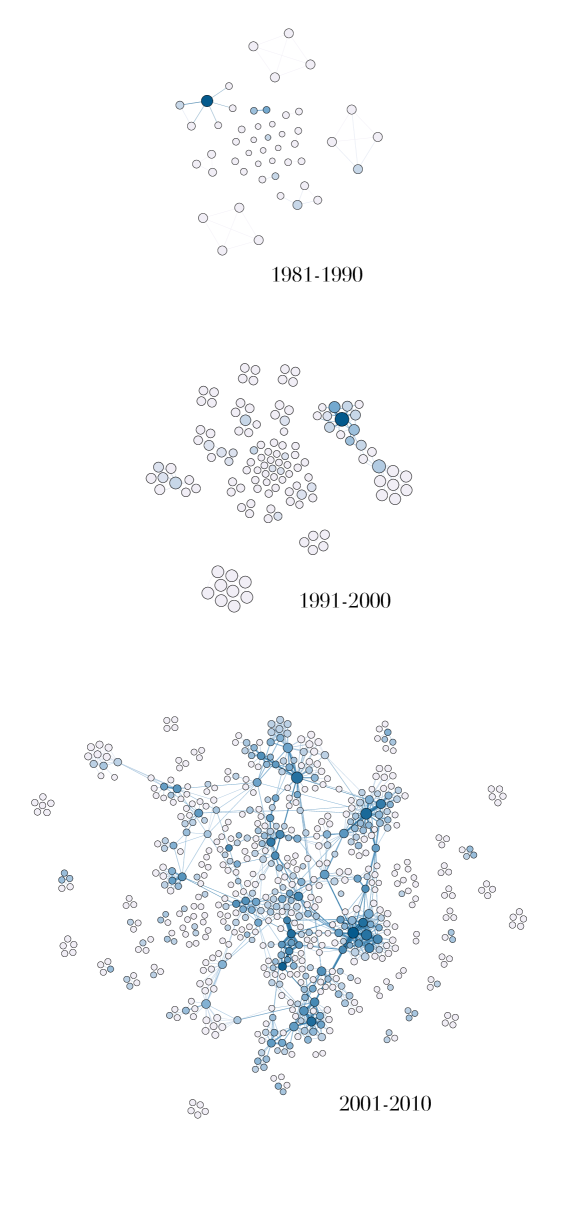
Figure 5 shows a network visualization of the PER community over three different time periods: the 1980s, 1990s, and 2000s. These networks illustrate how the shape of the PER community has changed over the last 30 years. During the 1980s, the authors in the field labored more or less independently. This was also true through the 1990s. But in the early-to-late 2000s, the network consolidates into a single community with a cohesive core.
We can see this consolidation of the community by looking at the number of people in the LCC. In most of the mature research communities that have been studied, the largest connected component contains well over half of the researchers, ranging from 57% in computer science to 93% in the biomedical fields (see Table 2 for a list of established results 111Biomedical, astrophysics, condensed matter physics, and high-energy theory: 5 Sociology: 8 Management: 17.) We can think of the nodes in the LCC as the core of the community, and when that core community contains a large fraction of the researchers in the field, the community hangs together as a single, cohesive unit.
| field | frac in LCC |
|---|---|
| biomedical (1995-1999) | 93% |
| astrophysics (1995-1999) | 89% |
| condensed matter physics (1995-1999) | 85% |
| high-energy theory (1995-1999) | 71% |
| management (1980-2003) | 45% |
| sociology (1963-1999) | 53% |
| PER (80s and 90s) | 12% |
| PER (2000s) | 68% |
In contrast, the LCC in the early-stage PER network—formed using papers from the 80s and 90s—contains only 12% of the researchers writing PER papers. This suggests that in those early years, PER was not a cohesive collaborative community, such as those seen in more established fields. However, the later-stage network does exhibit a cohesive core: the LCC in the network constructed using papers from the 2000s contains 68% of the researchers in the community.
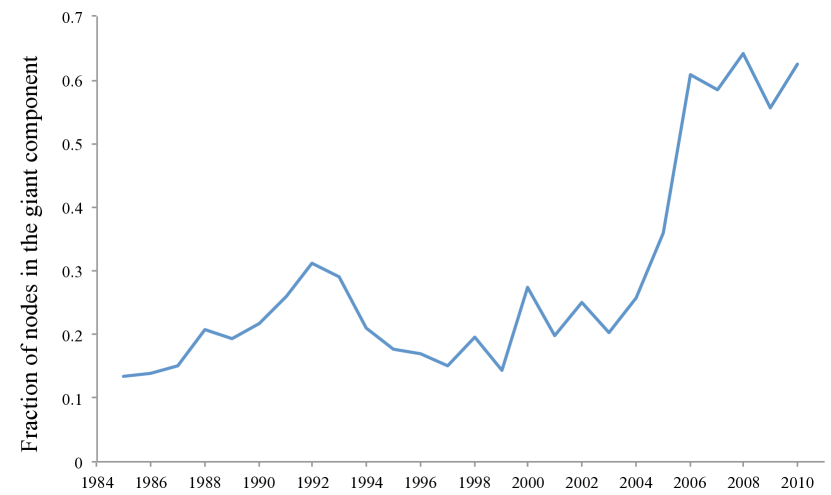
Interestingly, the transition to a cohesive community does not occur gradually. There is a clear point at which the largest connected component starts to dominate the network. Figure 6 shows the fraction of the PER community that is in the largest connected component, using networks generated from papers within a five-year moving window. For any date, a five-year moving window starts two years prior, and ends two years after. Thus, the size of the LCC in 1995 is calculated by averaging the sizes in 1993-1997. We use five-year windows because the earliest networks are generated by a very small set of papers. The results are similar for different window sizes.
In 2004-2005, we see a discrete jump in the fraction of nodes that are connected, marking the transition from isolated islands of researchers to a cohesive core. We will examine this jump further below.
V.2 More collaborative effort
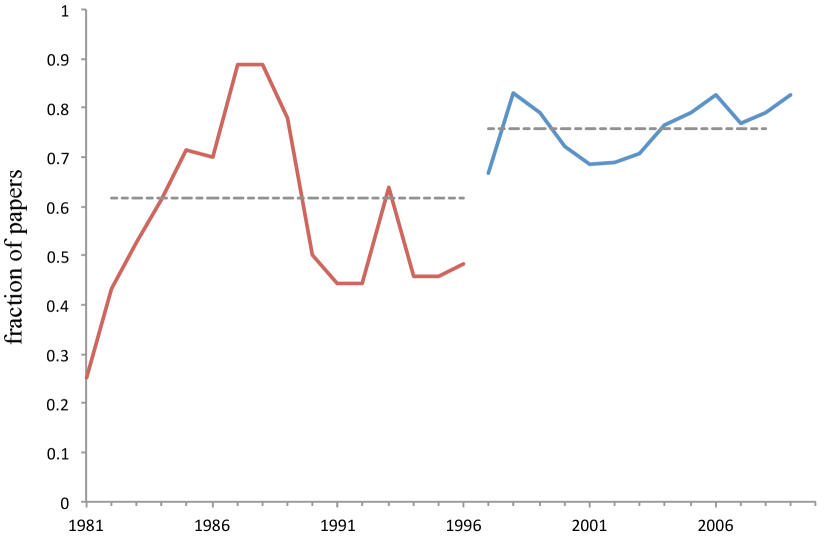
Over time, PER has become an increasingly collaborative field. In the early 1980s, around half of the papers in the field had a single author. By 2010, only a quarter were solo-authored. Many fields have seen a similar increase in collaboration over time. In the field of sociology, for example, the average fraction of coauthored papers rose from ~20% in 1963 to ~40% in 19998. Similar long-term trends have been observed in other established fields, such as information science20, mathematics7, and sociology8. However, whereas other fields have experienced a slow, steady increase in coauthorship rates, the change in PER did not come about gradually. Rather, there was a discrete change in collaborative behavior in 1997-1998. Figure 7 shows the time series of the fraction of papers coauthored, with mean values before and after 1997. Before 1997, 53% of papers were coauthored. After 1997, the propensity to collaborate jumped to nearly 80%.
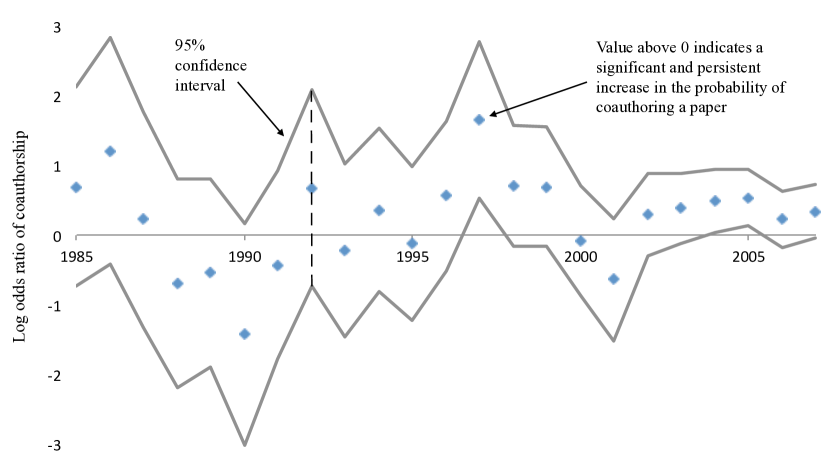
Using a log odds ratio, we can show that this discrete change in the propensity to collaborate is significant, persistent, and unique. Here, we look at the data from AJP alone, so as to keep the venue for publication consistent throughout. The change at this breakpoint is still significant when all three journals are included. We compare the odds of coauthoring a paper in the 4 years before and after each year. Suppose and are the number of coauthored and single-authored papers in the four years prior to a given year, and and are the number of coauthored and single-authored papers in the four years after that given year. The log odds ratio is then Figure 8 shows the change in the log odds ratio over time, with a 95% confidence interval. The 95% confidence interval for the point estimate of the log odds ratio is , where .
A log odds ratio above 0 means that papers are more likely to be coauthored in the four years after the break than they are in the four years before the break; in 1997 the 95% confidence interval excludes 0 and is statistically significant. Note that while the choice of a 4 year window is arbitrary, the break in 1997 remains significant for other window-sizes. Because the change has to continue through the post-break window, the positive log odds ratio necessarily indicates a persistent change in the probability of coauthoring a paper. Moreover, this period of dramatically increased collaboration is relatively unique in the post-1981 history of PER.
There is only one other significantly positive log odds ratio, in 2005. This break point occurs a few years after the introduction of the PERC Proceedings and it is coincident with the introduction of the PhysRev-PER journal. The first few years of both PERC Proceedings and PhysRev-PER were unusually collaborative, which undoubtedly generates the significant break point in 2005. However, in contrast with the break point in 1997, this appears to be a temporary effect.
The intensive margin—the number of coauthors per paper—provides some additional insight into the mechanisms behind the observed increase in collaboration. This measure of collaborative effort has also risen in a wide range of other academic fields, including physics22, mathematics2, sociology8, management science17, and economics10. Looking at the overall number of coauthors per paper, there initially appears to be a similar, though less dramatic trend in PER: the number of authors per paper rises from 2.2 in the 80s and 90s to 2.5 in the 2000s. However, when we condition on a paper being coauthored at all, the trend disappears: the average coauthored paper had 3.0 authors in the 80s and 90s and 2.9 authors in the 00s. This suggests that in the case of PER, the change in behavior was regarding whether to coauthor or not, rather than in the number of authors to bring onto a project.
This raises the question of where this sudden move towards collaboration came from. It is worth noting that 1997 is coincident with the introduction of a field-specific conference—PERC—which developed from grass-roots efforts at Kansas State University, the University of Nebraska-Lincoln, and the University of Maryland, and was later fully recognized as an extension to the summer meeting of the American Association of Physics Teachers. PERC attendance grew to approximately 300 annual registrants by the end of our data collection period. At this conference, researchers—including graduate students and incumbents—could meet and foster new collaborative relationships. Without information on conference attendance, it is impossible to tell whether the introduction of the conference facilitated this increase in collaborative effort. However, the fact that collaboration has been higher in the PERC-era suggests that the conference may have been a factor.
Another possible contributing factor is the increased use of email during this period, which lowered the costs of remote collaboration, perhaps prompting increased probability of coauthorship. The field used email and other internet communications to foster specific collaborations as well as develop online communities such as the graduate students’ mailing list (then “Graduate Students in Physics Education” (GSPER), now “PER Consortium of Graduate Students” (PERCoGS)). Technological advances in the collection and distribution of raw data (survey responses, video files) also made it easier to collect, share, and analyze data among geographically-distant collaborators. However, if these technological factors were truly dominant, we would expect to see a similar discrete jump in coauthorship in other fields over roughly the same time period—especially in other early-adopter fields such as high-energy physics. The fact that we do not suggests that increased internet use is unlikely to be the dominant source of the observed change.
V.3 Increasing prevalence of within-group links
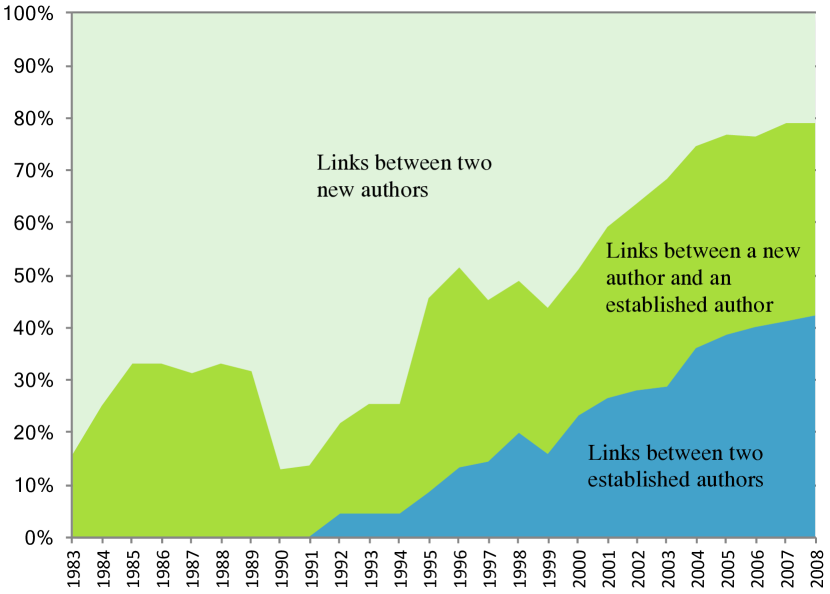
In addition to an increase in the propensity to collaborate, we also see a change in the pattern of collaboration. Over the 30 years covered by the data, PER researchers shift from working with researchers from outside the community to researchers who are already active in the field. Figure 9 shows the fraction of coauthorship ties that are between authors who have already published in a PER journal, the fraction that are between new authors, and the fraction that include both a new author and an incumbent author. Early on, existing members of the PER community tend to work with researchers new to the field. This trend persists for a surprisingly long time: 15 years into the observed data, fewer than 10% of the coauthorship links are between researchers who are already established in the field. But as the community ages, established community members begin to work with other established community members. By the late 2000s, about half of the links are between researchers who are already active in the field.
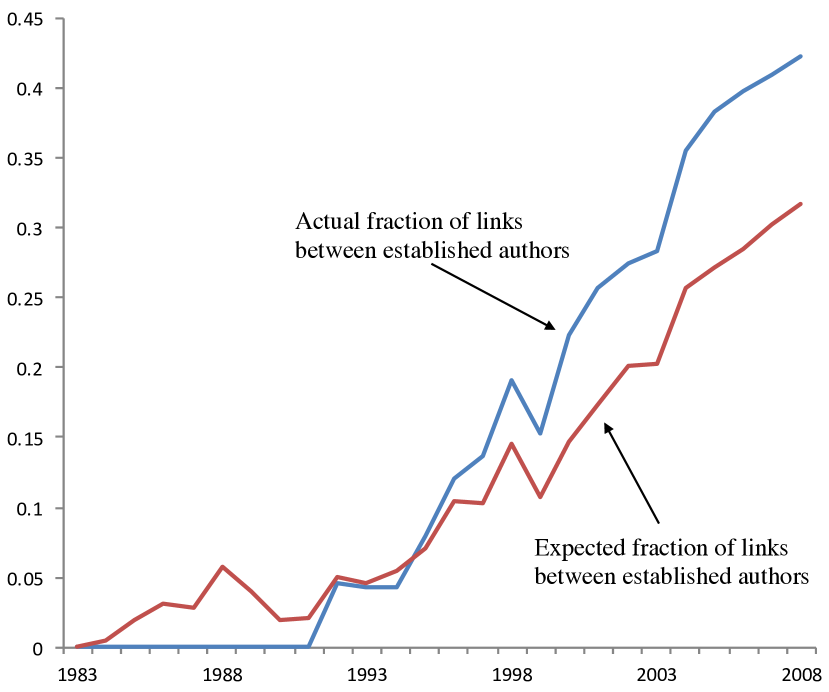
Of course, this trend need not be due to a true shift in linking behavior, because as the field matures, there are an increasing number of incumbents, which provides more ample opportunities for interaction between them. We can account for the aging of the community by comparing the fraction of links that are between incumbent authors to the fraction that would be expected if links between those authors were made at random. This is illustrated in Figure 10. In the early years of the field, researchers were actually less likely to coauthor with established PER researchers than would be expected. But in the mid-to-late 90s, we see a reversal in that trend, as established researchers become increasingly likely to coauthor. By mid-to-late 2000s, established researchers have shifted towards disproportionately collaborating with researchers who are established in the field.
While the increase in collaborative propensity is a trend found in many different fields, this shift towards within-group collaboration has not, to our knowledge, been previously observed in other academic contexts. There are many overlapping factors which could contribute to the observed changes in coauthorship behavior. It seems likely that it is a trend unique to early-stage academic communities. Before the field becomes established as a cohesive community, established researchers coauthor with a rotating cast of colleagues new to the field, most of whom never write another paper in that area. As the field develops and grows, more researchers are able to specialize in that area, allowing for an increase in coauthorship between established members of the field.
The appearance of field-specific graduate programs is also a likely factor. Graduate students provide an important link between established researchers, because they maintain connections with their old institutions while establishing connections at new institutions. This geographic movement provides an opportunity for established authors to work with each other over time, even when they are no longer at the same institutions. In the 1990s, graduate programs in PER expanded even as graduate programs in physics as a whole saw declines in admissions23. In the network, these authors appear as bridges between multiple research groups, with many links to multiple researchers at two different institutions which otherwise do not have strong direct links among them. Notable cases of inter-institutional links include David Brookes and Elizabeth Gire. Other established researchers are only strongly linked to one group. As the field grows there are also likely to be more opportunities for researchers to take sabbaticals in distant locations, increasing extra-institutional and international links within the community. Researchers may also form remote collaborations based on mutual interests, as in the cases of Melissa Dancy and Charles Henderson or Eric Brewe and Rachel Scherr, even if their home institutions always geographically distant.
VI Discussion
The changes we see in Figure 5 and Figure 6 were sudden and dramatic. The transition from individual researchers to an interconnected whole is a clear indication of the emergence of a collaborative community, and thus it is natural to ask which factors may have contributed to that change. In this section, we consider the roles of growth, increased collaboration, and increased within-group collaboration in the development of the community.
The first, and simplest explanation for the consolidation of the network is growth: as more papers are written, there are more opportunities for coauthorship. However, this explanation does not fit the data. We modeled expected network density to test this explanation.
Assuming that linking decisions are random (thus eliminating factors related to linking behavior), the expected density of the network at time t is approximately
| (1) |
where is the number of authors and is the probability that a paper is co-authored. This approximation assumes that all papers that are co-authored are written by two authors or solo-authored. This is a reasonable approximation for our data, because the median paper is written by between one and two individuals, depending on the year.
If growth in the number of papers were the sole factor in the emergence of the cohesive core, then would be constant, and density would decrease over time, which would actually inhibit the formation of a large connected component that dominates the graph. Thus, growth alone cannot explain the emergence of a cohesive core.
A second possibility is that this increased cohesion is a result of one of the observed changes in linking behavior: either the increase in the number of authors per paper, or the shift toward within-group coauthorship. The increase in coauthorship rates seen in Figures 7 and 8 means more links, which would provide more opportunities for isolated parts of the network to come together.
Another possibility is that the consolidation of the community is a result of not the overall amount of collaboration, but rather the choice of who to collaborate with: i.e. the trend towards existing members of the community authoring papers together. Isolated groups of existing authors could be bound together by “long distance” links between existing community members, which would lead to the emergence of the cohesive core.
It is also worth noting that many of the behavior and structural changes we observe are coincident with changes in the institutional structures in the community. The uptick in collaboration occurs around the same time as the “interval day” meeting in 1996, a precursor to the PERC. Moreover, this is coincident with the introduction of the graduate student mailing list (originally GSPER, now PERCoGS), which undoubtedly increased inter-departmental communication, and thus community cohesion.
This period also saw increases to PER-specific funding at the National Science Foundation, increasing both the opportunities for newcomers and the possible projects for them to work on. Concurrently, an explosion of research-based teaching methods24 and research-based assessments25 allowed many faculty access to products of PER, opening possibilities for future research and collaboration.
VII Conclusion
The case of PER provides a useful look at the early stages in the development of an academic community. The community grows, and with that growth comes an increased propensity to collaborate and an increased reliance on collaboration within the community. The introduction of field-specific conference also provided a valuable forum for researchers to develop a sense of community and shared purpose. The result is the emergence of a new, cohesive core to the coauthorship network—a true academic community.
The interactions between field growth, behavioral change, and structural change are complex, and it is impossible to completely tease out the effects of each factor. It is likely their effects interact strongly with each other, forming feedback loops to increase the strength and interconnections within the community.
Acknowledgements.
The authors thank Lyle Barbato, who provided the PERC Proceedings data, and Steve Kanim, who provided the AJP data. Several community-minded individuals contributed background information and potential real-world correlates to this paper, including Michael Wittmann, Dean Zollman, Michael Loverude, and two anonymous reviewers. Portions of this research were supported by the KSU Physics Department and by the Tepper School of Business, Carnegie Mellon University.References
- Traweek 1988 S Traweek, Beamtimes and lifetimes (Harvard University Press, Cambridge, MA, 1988).
- Grossman and Ion 1995 Jerrold W Grossman and Patrick D F Ion, “On a Portion of the Well-Known Collaboration Graph,” Congressus Numerantium 108, 129–131 (1995).
- Newman 2001a M.E.J. Newman, “Scientific collaboration networks. I. Network construction and fundamental results,” Physical Review E 64, 1–8 (2001a).
- Newman 2001b Mark EJ Newman, “Scientific collaboration networks. ii. shortest paths, weighted networks, and centrality,” Physical review E 64, 016132 (2001b).
- Newman 2001c M E J Newman, “The structure of scientific collaboration networks,” Proceedings of the National Academy of Sciences of the United States of America 98, 7 (2001c).
- Newman 2004 Mark EJ Newman, “Coauthorship networks and patterns of scientific collaboration,” Proceedings of the national academy of sciences 101, 5200–5205 (2004).
- Grossman 2002 Jerrold W Grossman, “The evolution of the mathematical research collaboration graph,” Congressus Numerantium , 201–212 (2002).
- Moody 2004 James Moody, “The Structure of a Social Science Collaboration Network: Disciplinary Cohesion from 1963 to 1999,” American Sociological Review 69, 213–238 (2004).
- Powell et al. 2005 Walter W Powell, Douglas R White, Kenneth W Koput, and Jason Owen-Smith, “Network dynamics and field evolution: The growth of interorganizational collaboration in the life sciences1,” American journal of sociology 110, 1132–1205 (2005).
- Goyal et al. 2006 Sanjeev Goyal, Marco J Van Der Leij, and Jose Luis Moraga-Gonzalez, “Economics: An Emerging Small World,” Journal of Political Economy 114, 403–412 (2006).
- Lee et al. 2008 Deokjae Lee, B Kahng, and Kwang-Il Goh, “Evolution of the coauthorship network,” Journal of the Korean Physical Society 52 (2008).
- Heidler 2011 Richard Heidler, “Cognitive and social structure of the elite collaboration network of astrophysics: a case study on shifting network structures,” Minerva 49, 461–488 (2011).
- Dewey 1910 John Dewey, “Science as subject-matter and as method,” Science , 121–127 (1910).
- Arons and Karplus 1976 Arnold B Arons and R Karplus, “Implications of Accumulating Data on Levels of Intellectual Development,” American Journal of Physics 44 (1976).
- Arons 1976 A B Arons, “Cultivating the capacity for formal reasoning,” American Journal of Physics 44, 834 (1976).
- Barabâsi et al. 2002 Albert-Laszlo Barabâsi, Hawoong Jeong, Zoltan Néda, Erzsebet Ravasz, Andras Schubert, and Tamas Vicsek, “Evolution of the social network of scientific collaborations,” Physica A: Statistical mechanics and its applications 311, 590–614 (2002).
- Acedo et al. 2006 F J Acedo, C Barroso, C Casanueva, and J L Galán, “Co-authorship in management and organizational studies: an empirical and network analysis,” Journal of Management Studies 43, 957–983 (2006).
- Banerjee et al. 2013 Abhijit Banerjee, Arun G Chandrasekhar, Esther Duflo, and Matthew O Jackson, “The diffusion of microfinance,” Science 341, 1236498 (2013).
- Note 1 Biomedical, astrophysics, condensed matter physics, and high-energy theory: 5 Sociology: 8 Management: 17.
- Cunningham and Dillon 1997 Sally Jo Cunningham and Stuart M Dillon, “Authorship patterns in information systems,” Scientometrics 39, 19–27 (1997).
- Note 2 The 95% confidence interval for the point estimate of the log odds ratio is , where .
- Barabasi et al. 2002 A-L Barabasi, H Jeong, Z Neda, E Ravasz, A Schubert, and T Vicsek, “Evolution of the social network of scientific collaborations,” Physica A: Statistical Mechanics and its Applications 311, 590–614 (2002).
- AIP Statistical Research Center 2015 AIP Statistical Research Center, “First-Year Graduate Physics Students,” (2015).
- Meltzer and Thornton 2012 David E. Meltzer and Ronald K. Thornton, “Resource Letter ALIP–1: Active-Learning Instruction in Physics,” American Journal of Physics 80, 478 (2012).
- Madsen et al. 2017 Adrian Madsen, Sam McKagan, and Eleanor C Sayre, “Resource Letter: RBAI-1: Research-based Assessment Instruments in Physics and Astronomy,” American Journal of Physics (2017), arXiv:1605.02703 .