The optical counterpart to the Be/X-ray binary SAX J2239.3+6116
Abstract
Context. Be/X-ray binaries represent the main group of high-mass X-ray binaries. The determination of the astrophysical parameters of the counterparts of these high-energy sources is important for the study of X-ray binary populations in our Galaxy. X-ray observations suggest that SAX J2239.3+6116 is a Be/X-ray binary. However, little is known about the astrophysical parameters of its massive companion.
Aims. The main goal of this work is to perform a detailed study of the optical variability of the Be/X-ray binary SAX J2239.3+6116.
Methods. We obtained multi-colour photometry and polarimetry and 4000-7000 Å spectroscopy. The 4000–5000 Å spectra allowed us to determine the spectral type and projected rotational velocity of the optical companion; the 6000-7000 Å spectra, together with the photometric magnitudes, were used to derive the colour excess , estimate the distance, and to study the variability of the H line.
Results. The optical counterpart to SAX J2239.3+6116 is a B0Ve star located at a distance of 4.9 kpc. The interstellar reddening in the direction of the source is mag. The monitoring of the H line reveals a slow long-term decline of its equivalent width since 2001. The line profile is characterized by a stable double-peak profile with no indication of large-scale distortions. We measured intrinsic optical polarization for the first time. Although somewhat higher than predicted by the models, the optical polarization is consistent with electron scattering in the circumstellar disk.
Conclusions. We attribute the long-term decrease in the intensity of the H line to the dissipation of the circumstellar disk of the Be star. The longer variability timescales observed in SAX J2239.3+6116 compared to other Be/X-ray binaries may be explained by the wide orbit of the system.
Key Words.:
stars: individual: SAX J2239.3+6116, – X-rays: binaries – stars: neutron – stars: binaries close –stars: emission line, Be| Date | JD | Telescope | EW(H) | ||
|---|---|---|---|---|---|
| (Å) | (km s-1) | ||||
| 31-05-2001 | 2452061.558 | SKT | 16210 | ||
| 03-06-2001 | 2452064.479 | SKT | 15010 | ||
| 13-09-2001 | 2452166.417 | SKT | 20210 | ||
| 08-10-2001 | 2452191.367 | SKT | 17510 | ||
| 18-07-2002 | 2452474.481 | SKT | – | – | |
| 08-10-2003 | 2452921.323 | SKT | – | – | |
| 24-06-2004 | 2453181.465 | SKT | 15910 | ||
| 24-06-2005 | 2453546.433 | SKT | 2225 | ||
| 13-07-2005 | 2453565.522 | SKT | 2414 | ||
| 17-08-2005 | 2453600.387 | SKT | 2405 | ||
| 26-10-2005 | 2453670.388 | SKT | 17110 | ||
| 06-09-2007 | 2454350.508 | SKT | 2588 | ||
| 25-06-2008 | 2454643.486 | SKT | 23810 | ||
| 03-09-2008 | 2454713.324 | SKT | 2527 | ||
| 12-08-2009 | 2455056.477 | SKT | 2414 | ||
| 03-08-2010 | 2455412.382 | SKT | 2797 | ||
| 29-08-2010 | 2455438.417 | SKT | 2559 | ||
| 30-09-2010 | 2455470.437 | SKT | 25910 | ||
| 21-08-2011 | 2455795.414 | SKT | 2436 | ||
| 24-08-2012 | 2456164.453 | SKT | 2927 | ||
| 06-09-2012 | 2456177.505 | SKT | 2899 | ||
| 14-09-2012 | 2456185.419 | SKT | 2794 | ||
| 19-10-2012 | 2456220.352 | SKT | 2867 | ||
| 30-07-2013 | 2456504.476 | SKT | 2455 | ||
| 31-08-2013 | 2456536.413 | SKT | 2494 | ||
| 19-10-2013 | 2456585.298 | SKT | 2523 | ||
| 07-08-2014 | 2456877.512 | SKT | 3455 | ||
| 15-09-2014 | 2456915.609 | NOT | 3441 | ||
| 12-10-2014 | 2456943.391 | SKT | 3105 | ||
| 23-06-2015 | 2457197.500 | SKT | 3436 | ||
| 07-07-2015 | 2457211.500 | SKT | 3497 | ||
| 04-08-2015 | 2457239.500 | WHT | 3792 | ||
| 05-10-2015 | 2457301.500 | SKT | 3478 | ||
| 06-10-2015 | 2457302.500 | SKT | 3174 | ||
| 06-11-2015 | 2457333.501 | NOT | 3122 | ||
| 26-05-2016 | 2457534.635 | NOT | 30310 |
| Photometry (mag.) | |||||
| Date | JD (2,400,000+) | ||||
| 16-07-2007 | 54298.518 | 16.250.02 | 14.750.03 | 13.850.02 | 12.860.03 |
| 30-06-2009 | 55013.513 | 16.260.02 | 14.790.01 | 13.910.01 | 12.970.02 |
| 26-08-2011 | 55800.488 | 16.300.01 | 14.830.01 | 13.950.01 | 13.020.02 |
| 09-09-2011 | 55814.349 | 16.280.03 | 14.870.03 | 14.000.02 | 13.050.03 |
| 29-08-2013 | 56534.500 | 16.290.02 | 14.840.02 | 13.900.02 | 12.910.03 |
| 20-08-2014 | 56890.479 | 16.230.02 | 14.810.02 | 13.910.02 | 12.960.03 |
| 22-07-2015 | 57226.536 | 16.300.02 | 14.840.01 | 13.970.01 | 12.970.01 |
| 18-11-2015 | 57345.326 | 16.260.02 | 14.820.01 | 13.940.02 | 13.000.02 |
| 06-06-2016 | 57546.580 | 16.260.02 | 14.820.02 | 13.940.02 | 12.990.03 |
| Polarimetry (%) | |||||
| 10-07-2015 | 57214.541 | 7.81.9 | 7.30.6 | 6.80.3 | 6.10.3 |
| 15-06-2016 | 57555.467 | 7.50.8 | 7.40.2 | 6.70.3 | 6.30.2 |
| Date | JD (2,400,000+) | PD(%) | PA (∘) | ||
|---|---|---|---|---|---|
| 06-10-2013 | 56572.458 | 7.50.4 | 63.31.6 | -0.0450.004 | 0.0600.004 |
| 08-10-2013 | 56574.345 | 6.30.4 | 63.21.7 | -0.0370.004 | 0.0510.004 |
| 20-10-2013 | 56586.360 | 6.80.3 | 63.31.1 | -0.0400.003 | 0.0540.003 |
| 28-10-2013 | 56594.444 | 6.80.2 | 61.71.0 | -0.0370.003 | 0.0570.003 |
| 10-11-2013 | 56607.349 | 6.60.3 | 63.11.4 | -0.0390.003 | 0.0530.003 |
| 23-05-2014 | 56801.571 | 6.50.4 | 61.11.6 | -0.0340.004 | 0.0550.004 |
| 14-07-2014 | 56853.600 | 6.80.4 | 61.91.5 | -0.0380.004 | 0.0570.004 |
| 02-08-2014 | 56872.535 | 6.70.4 | 64.11.8 | -0.0420.004 | 0.0530.004 |
| 14-08-2014 | 56884.584 | 6.90.4 | 62.91.9 | -0.0400.005 | 0.0560.005 |
| 01-09-2014 | 56902.487 | 6.80.4 | 64.51.9 | -0.0430.004 | 0.0530.004 |
| 10-07-2015 | 57214.541 | 6.80.3 | 63.21.3 | -0.0400.003 | 0.0540.003 |
| 05-08-2015 | 57240.569 | 6.80.4 | 64.81.5 | -0.0440.004 | 0.0530.004 |
| 19-11-2015 | 57346.284 | 6.90.3 | 63.61.3 | -0.0420.003 | 0.0550.003 |
| 14-06-2016 | 57554.580 | 6.70.2 | 64.31.0 | -0.0420.002 | 0.0520.002 |
| 15-06-2016 | 57555.451 | 6.60.3 | 62.91.1 | -0.0380.003 | 0.0530.003 |
1 Introduction
SAX J2239.3+6116 was discovered by the BeppoSAX wide-field camera as a transient X-ray source during observations of the supernova remnant Cas A. It was first detected on 4 March 1997 and then again on 8 May 1999 (in’t Zand et al. 2000). The peak flux then was erg s-1 cm-2 in the energy range 2–10 keV and erg s-1 cm-2 in the energy range 2–26 keV. The X-ray spectral continuum was satisfactorily fitted with a single absorbed power law with cm-2 and . The source was not detected on 13–15 December 1999 with an upper limit on the 2–10 keV X-ray flux of erg s-1 cm-2 (in’t Zand et al. 2000). A search for detections with other X-ray instruments resulted in a detection with BeppoSAX/MECS on 24–25 November 1998 with a flux of erg s-1 cm-2 (2–10 keV) and another detection with CGRO/BATSE in March 1997 with a flux erg s-1 cm-2 (20–100 keV). The RXTE/ASM light curve showed increases in the X-ray intensity at regular interval times of days (in’t Zand et al. 2000). If this periodicity is interpreted as the orbital period of the system, then SAX J2239.3+6116 has the longest orbital period of all the known BeXB in our Galaxy. Subsequent RXTE/PCA and BeppoSAX/MECS-LECS observations during a predicted outburst in July 2001 revealed X-ray pulsations with a pulse period of s (in’t Zand et al. 2001). The X-ray flux during the observations that detected pulsations was erg s-1 cm-2 (2–10 keV).
Optical observations were carried out on 2–3 December 1999 with the 2.1 m telescope of the Kitt Peak National Observatory. A B-type star showing H in emission with an equivalent width of –6.7 Å was discovered away from the best-fit X-ray position. This V=15.1 mag star was proposed to be the optical counterpart to SAX J2239.3+6116 (in’t Zand et al. 2000).
One more optical campaign was reported by Riquelme et al. (2012) on 2–5 July 2001 with the following photometric magnitudes: , , , , and and an H equivalent width of –11.0 Å.
In this work, we performed the first detailed study of the optical variability of SAX J2239.3+6116. We present photometric observations covering the period 2007-2016, spectra in the region of the H line from 2001-2016, and for the first time polarimetric data from 2013-2016. Although photometric and spectroscopic data prior to 2015 have been presented in the context of a global study of the long-term optical variability of BeXBs by Reig & Fabregat (2015) and Reig et al. (2016), respectively, we include them here for the sake of completeness. Our polarimetric observations are the first dedicated observations of the source using this technique.
2 Observations
2.1 Spectroscopy
Optical spectroscopic observations were obtained from the 1.3 m telescope of the Skinakas observatory (SKT) in Crete (Greece) and from the 2.5 m Nordic Optical Telescope (NOT) in El Roque de los Muchachos observatory (La Palma, Spain). SAX J2239.3+6116 was also observed in service time with the 4.2 m William Herschel Telescope (WHT).
The 1.3 m telescope of the Skinakas Observatory was equipped with a 2000800 ISA SITe CCD and a 1302 lines mm-1 grating, giving a nominal dispersion of 1 Å/pixel. The NOT was equipped with the Andalucia Faint Object Spectrograph and Camera (ALFOSC), an EEV42-40, 2Kx2K chip, and Grism#16 (1000 lines mm-1; 0.86 Å/pixel) for the blue spectrum (3460–5220 Å) on 16 July 2015 and Grism#17 (2400 lines mm-1; 0.26 Å/pixel) for the red spectra (6330-6870 Å) on 15 September 2014 and 6 November 2015. The NOT red spectrum on 26 May 2016 was made with Grism#20 (484 lines mm-1, 5650-10150 Å, 2.2 Å/pixel). The WHT was used with the ISIS spectrograph and an EEV12 CCD chip. The blue arm covers the range 3927–4573 Å with the R1200B gratings and gives a dispersion of 0.23 Å/pixel, while the red arms covers the range 6491-7109 Å and gives a dispersion of 0.26 Å/pixel.
After correcting the images for bias and flatfield, spectra were extracted from the object and the nearby sky. The sky spectrum was subtracted from that of the object and the resulting spectrum was wavelength-calibrated. Spectra of comparison lamps were taken before each exposure to account for small variations in the wavelength calibration during the night.
To ensure a homogeneous processing of the spectra, they were normalized with respect to the local continuum, which was rectified to unity by employing a spline fit. The definition of the continuum level is crucial because it represents the main source of uncertainty in the determination of the spectral parameters.
To extract the H line parameters, we fitted the profiles with two Lorentzian functions. Lorentzian profiles behaved better than Gaussian profiles owing to the extended wings and the small peak distance in spectra with large values of EW(H). Twelve different selections of the continuum were used. For each one, we obtained the line centres, full width at half maximum, and the intensity of the two peaks above the local continuum. The final value and error of these parameters were computed as the average and standard deviation of those 12 measurements. The equivalent width, peak separation, and V/R ratio of the H line are given in Table 1.
2.2 Photometry
The photometric observations were made with the 1.3 m telescope of the Skinakas Observatory. SAX J2239.3+6116 was observed through the Johnson-Cousins , , and filters. For the photometric observations, the telescope was equipped with a 20482048 ANDOR CCD with a 13.5 m pixel size. In this configuration, the plate scale is 0.28 /pixel, hence providing a field of view of arcmin2. Standard stars from the Landolt list (Landolt 2009) were used for the transformation equations. Reduction of the data was carried out in the standard way using the IRAF tools for aperture photometry. After the standardization process, we finally assigned an error to the calibrated magnitudes of the target given by the rms of the residuals between the catalogued and calculated magnitudes of the standard stars. The photometric magnitudes are given in Table 2.
2.3 Polarimetry
Polarimetric observations in the band were made with the RoboPol photopolarimeter attached to the focus of the 1.3 m telescope of the Skinakas Observatory (Table 3). In addition, we obtained multi-colour polarimetric data on the nights 10 July 2015 and 15 June 2016 (see Table 2). In the polarimetry configuration a plate scale of 0.43 /pixel is achieved with a 20482048 ANDOR CCD with a 13.5 m pixel size. RoboPol is an imaging photopolarimeter that measures simultaneously the Stokes parameters of linear polarization of all sources in the field of view (King et al. 2014). Robopol splits the incident light into two beams, each half incident on a half-wave retarder followed by a Wollaston prism. The fast axis of the half-wave retarder in front of the first prism is rotated by with respect to the other retarder. Every point in the sky is thereby projected to four points on the CCD. In each spot the photon counts, measured using aperture photometry, are used to calculate the and parameters of linear polarization. A mask is placed in the telescope focal plane to optimize the instrument sensitivity. The absence of moving parts allows RoboPol to compute all the Stokes parameters of linear polarization in one shot.


3 Results
3.1 The H line: Evolution of spectral parameters
Table 1 summarizes the results of the spectral analysis, where the equivalent width of the H line (EW(H)), peak separation (), and V/R ratio () are given. The peak separation is simply the difference between the central wavelength of the red minus the blue peak in velocity units (), where is the speed of light. The errors are estimated by propagating the uncertainty in the determination of the central wavelength of the Lorentzian profile used to fit the H profile. The ratio is defined as the ratio of the relative intensity at the blue and red emission peak maxima (after subtracting the underlying continuum). For plotting purposes we used the log of this ratio, . Thus negative values indicate a red-dominated peak (), positive values indicate a blue-dominated profile (), and values close to zero correspond to equal intensity peaks ().
The EW(H) of SAX J2239.3+6116 shows a long-term decreasing trend since 2001. The EW(H) changed from –12 Å in September 2007 to –1 Å in July 2015 (Fig. 1, top panel). The decreasing trend is not smooth but displays a saw-tooth profile, i.e. sometimes EW(H) increases to subsequently drop below the initial trend. The changes in the shape of the line are also significant. Although is the dominant profile, there is a long-term trend of the ratio turning from a slightly red-dominated profile () into a slightly blue-dominated profile () as the intensity of the line decreases (Fig. 1, bottom panel). The peak separation also changes with time. It is smaller when EW(H) is larger (Fig. 1, middle panel).
Fig. 2 figure shows H profiles at four different epochs. In the spectra with EW(H) 10 Å, the peaks are so close together that the fits with two Lorentzian profiles do not always provide sensible values. In these cases we simply obtained by visual inspection, finding the wavelength of the local maxima directly from the data.

3.2 Spectral classification
The spectral type of SAX J2239.3+6116 is not well constrained. The low resolution spectra ( Å) of the 1999 optical observations showed H and He I lines and numerous diffuse interstellar bands (DIB), suggesting a B0V–B2III star (in’t Zand et al. 2000). Our higher resolution spectra reveals many more features. Figure 3 shows the NOT ( Å) and WHT ( Å) spectra in the traditional classification region. The spectral resolution was estimated by measuring the FWHM of a calibration lamp line. For plotting purposes the spectra shown in Fig. 3 have been smoothed with a Gaussian filter () with and , respectively.
The blue spectrum of SAX J2239.3+6116 is dominated by hydrogen and neutral helium absorption lines, clearly indicating an early-type B star. The Balmer series lines from H up to H at 3835 Å are seen in absorption. Very weak He II lines (4541, 4686) are also present, which implies a type later than O9. Mg II 4481 is absent or very weak, indicating a type earlier than B1. The strong C III + O II blends at 4070 Å and 4650 Å also support a spectral type between B0 and B1. The similar intensity of Si IV 4089 with respect to the nearby He I lines at 4121 Å and 4143 Å and of Si III 4552 with respect to He II 4541 favours a B0 main-sequence spectral class. A later spectral type, for example B1, would have the ratio He I 4121/Si IV 4089 1, whereas an earlier type star, for example O9, would have Si III 4552/He II 4541 1 (Walborn & Fitzpatrick 1990). Likewise, the strength of Si IV 4089 increases quickly with luminosity and becomes larger than He I 4121 and 4143 for giants and supergiants stars. The absence of OII lines also indicates a luminosity class V star. We conclude that the most likely spectral type of SAX J2239.3+6116 is B0Ve.
3.3 Reddening and distance
To estimate the distance, the amount of interstellar extinction to the source has to be determined. It is well known that the circumstellar disk in Be stars introduces extra reddening that should be taken into account to determine the colour excess from the interstellar medium. Riquelme et al. (2012) provided a method to correct for the excess emission from the disk. In fact, SAX J2239.3+6116 was one of the sources studied by these authors. At the time of their study, SAX J2239.3+6116 exhibited strong H emission with EW(H)=–11 Å. They obtained . However, as shown in Sect. 3.1, the strength of the H line SAX J2239.3+6116 has been decreasing since 2001 (Fig. 1). The source appears to be approaching a disk-loss state. The smallest value of EW(H) is Å, which corresponds to a disk contribution of mag (Riquelme et al. 2012), which lies within our photometric errors.
We estimated the reddening to the star in two different ways. The refinement of the spectral type allows us to use this fundamental spectral information in combination with the photometric observations. The observed colour of SAX J2239.3+6116 is (Table 2), while the expected one for a B0V star (Johnson 1966; Gutierrez-Moreno 1979; Wegner 1994). Thus we derive a colour excess of .
The second method uses the strength of DIBs in the spectrum (Herbig 1975; Herbig & Leka 1991; Galazutdinov et al. 2000; Puspitarini et al. 2013; Kos & Zwitter 2013). In this method, a least-squares fit is performed between the equivalent width of DIBs measured in the spectra of a large number of stars and the colour excess of those stars, . We used the coefficients given by Herbig (1975) because the sample of stars in this work covers a wider range in . Table 4 gives the details of the calculation. The reddening derived for each line was obtained by considering the average over all the spectra for which the line could be measured, and is the number of measurements. The weighted mean of the four colour excesses is and it is consistent with the photometric derived value.
Taken and assuming the standard extinction law and an average absolute magnitude for a B0V star of (Vacca et al. 1996; Wegner 2006), the distance to SAX J2239.3+6116 is estimated to be 4.90.8 kpc. Our value agrees with previously reported distances: Riquelme et al. (2012) found 5.40.5 kpc and in’t Zand et al. (2000) found 4.4 kpc.
| DIB | EW(mÅ) | N | |||
|---|---|---|---|---|---|
| 6203 Å | 280 | 6 | 41095 | 1.440.35 | 28 |
| 6269 Å | 156 | 70 | 410100 | 2.180.65 | 23 |
| 6276-79 Å | 189 | 56 | 32575 | 1.420.39 | 26 |
| 6613 Å | 231 | 43 | 42565 | 1.650.28 | 33 |
| Mean | 1.670.35 | ||||
| Weighted mean | 1.580.18 |
3.4 Rotational velocity
We estimated the projected rotational velocity, , where is the orbit inclination angle with respect to the line of sight, by measuring the width of neutral Helium lines using the calibration by Steele et al. (1999) and by Fourier transform of line profiles (Simón-Díaz & Herrero 2007).
For the first method, we used the WHT spectra taken on the night of 4 August 2015 as it provides the highest spectral resolution. Two spectra were obtained on that night. We fitted a Gaussian profile and derive the FWHM of four HeI lines (4026 Å, 4143 Å, 4387 Å,and 4471 Å) on each one of the two spectra as well as on the average. We repeated the procedure three times, corresponding to different selections of the continuum. In total we performed 36 measurements. The final rotational velocity is the mean of all these measurements. The simple average and standard deviation gave km s-1, whereas the weighted average km s-1.
The rotational velocity can also be estimated by calculating the Fourier transform of line profiles. The first zero in the frequency domain is related to the rotational velocity of the star through the equation ), where is the central wavelength of the line and the frequency at which the first zero is found (Simón-Díaz & Herrero 2007). This method works very well when the line profile is dominated by rotation, but presents some limitations when other broadening mechanism (macro- and micro-turbulence, Stark broadening) are at play. It also requires high dispersion and high S/N spectra. Figure 4 shows the Fourier transform of the WHT spectrum for two line profiles. The average rotational velocity from hydrogen lines ( and ) and helium lines (3926 Å, 4026 Å, 4387 Å, and 4471 Å) is km s-1 and km s-1, respectively. The reason for the higher values of the rotational velocity calculated from the He I lines is that these lines are additionally broadened by the Stark effect.
Table 5 gives the rotational velocity of some Be/X-ray binaries obtained from the reference in column 8. Column 6 gives the inclination angle of the orbit with respect to the line of sight, which allows us to estimate the true rotation velocity of the Be star. The term shell refers to double-peak lines whose central depression is lower than the stellar continuum (see e.g. Hummel & Vrancken 2000). This type of profile occurs in systems with high inclination angles.
The rotational velocity of SAX J2239.3+6116 is among the lowest measured in BeXB. This low value, together with the fact that no shell profiles are observed in the H line, suggest a relatively low inclination angle. On the other hand, a double-peak profile is always seen, even when the equivalent width is large. Thus, the inclination angle cannot be too low because we would expect single-peak profiles, such as V 0332+53 (Negueruela et al. 1999; Reig et al. 2016). A rough estimate of the inclination angle can be obtained assuming that the Be star rotates close to critical velocity. Be stars are fast rotators. They have, on average, larger observed rotational velocities than B stars as a group (Slettebak 1982). Even though at present there is no consensus on how close to their critical velocity Be stars rotate, observations suggest that a large percentage of Be stars rotate at 70–80% of the critical value (Slettebak 1982; Porter 1996; Yudin 2001). The critical velocity depends on the spectral type. For Be/X-ray binaries whose spectral type distribution spans a very narrow range (O9-B2), the critical or break-up velocity is 500-600 km s-1 (Townsend et al. 2004; Cranmer 2005). Hence, if km s-1, then .

| X-ray | Optical | Spectral | Disk-loss | Porb | Inclination | Reference | |
| source | counterpart | type | episodes | (days) | angle (∘) | (km s-1) | |
| SAX J2239.3+6116 | – | B0V | no | 262.6 | 25–35 | 19520 | This work |
| 4U 0115+634 | V635 Cas | B0.2V | yes | 24.3 | 43 | 30050 | 1 |
| RX J0146.9+6121 | LS I +61 235 | B1V | no | – | – | 20030 | 2 |
| V 0332+53 | BQ Cam | O8-9V | no | 34.2 | 10 | 150 | 3 |
| X Per | HD 24534 | O9.5III | yes | 250 | 23-30 | 21510 | 4,5 |
| RX J0440.9+4431 | LS V +44 17 | B1III-V | yes | 150 | – | 23515 | 6,7 |
| 1A 0535+262 | HD 245770 | O9.7III | yes | 111 | 28-35 | 22510 | 8,9 |
| IGR J06074+2205 | – | B0.5IV | yes | – | – | 26020 | 10 |
| RX J0812.4-3114 | LS 992 | B0.5III-V | yes | 81.3 | – | 24020 | 11 |
| 1A 1118-615 | Hen 3-640 | O9.5IV | no | 24 | 15 | 300 | 12,13 |
| 4U 1145-619 | V801 Cen | B0.2III | no | 187 | 45 | 25030 | 14,15 |
| 4U 1258-61 | V850 Cen | B2V | yes | 132 | shell† | 600 | 16 |
| SAX J2103.5+4545 | – | B0V | yes | 12.7 | – | 24020 | 17 |
| IGR J21343+4738 | – | B1IV | yes | – | shell† | 36515 | 18 |
| : Shell stars are believed to be equator-on systems, i.e. | |||||||
| [1] Negueruela & Okazaki (2001), [2] Reig et al. (1997), [3] Negueruela et al. (1999), [4] Lyubimkov et al. (1997) | |||||||
| [5] Delgado-Martí et al. (2001), [6] Reig et al. (2005), [7] Ferrigno et al. (2013), [8] Haigh et al. (2004) | |||||||
| [9] Grundstrom et al. (2007), [10] Reig et al. (2010), [11] Reig et al. (2001), [12] Janot-Pacheco et al. (1981) | |||||||
| [13] Staubert et al. (2011), [14] Janot Pacheco et al. (1982), [15] Webster (1974), [16] Parkes et al. (1980) | |||||||
| [17] Reig et al. (2004), [18] Reig & Zezas (2014) | |||||||

| Date | JD (2,400,000+) | RA | DEC | () | PD(%) | PA (∘) | ||
|---|---|---|---|---|---|---|---|---|
| 23-05-14 | 56801.575 | 22h39m21.1s | +61d16m40.3s | 0.22 | 3.60.4 | 60.63.4 | -0.01840.0040 | 0.03050.0038 |
| 23-05-14 | 56801.580 | 22h39m14.9s | +61d17m09.0s | 1.0 | 4.20.6 | 60.33.8 | -0.02150.0056 | 0.03650.0055 |
| 19-11-15 | 57346.298 | 22h39m30.4s | +61d15m46.6s | 1.3 | 3.80.5 | 60.43.6 | -0.01970.0049 | 0.03290.0049 |
| 19-11-15 | 57346.289 | 22h39m12.6s | +61d17m12.9s | 1.2 | 1.70.3 | 67.94.9 | -0.01240.0029 | 0.01210.0030 |
3.5 Polarization degree
The continuum polarization in Be stars is attributed to Thomson scattering of unpolarized starlight in the disk (Poeckert et al. 1979). The measured polarization degree in SAX J2239.3+6116 is well above the average observed in classical Be stars. The maximum polarization level in an axisymmetric circumstellar disk predicted by single-scattering plus attenuation models is about 2% (Waters & Marlborough 1992). When multi-scattering is taken into account, this level can increase to 3–4% (Wood et al. 1996; Halonen et al. 2013). In SAX J2239.3+6116, the polarization degree is of the order of 7% (Table 3). However, this value includes the contribution of the interstellar medium (ISM).
To investigate the question of whether the measured polarization can be accounted for entirely by the ISM or else some amount comes from the source, we proceeded in various ways: i) perform multi-colour polarimetry, ii) use average relationships between extinction and polarization degree in the Galaxy, iii) measure the polarization of field and nearby stars around the X-ray source, and iv) perform a variability analysis:
i) The wavelength dependence of interstellar polarization is observed to obey an empirical relation (Serkowski et al. 1975),
| (1) |
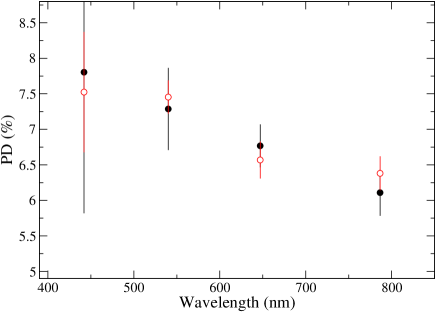
where determines the width or sharpness of the curve, is the wavelength at which the polarization is maximum and is directly related to the size of the dust grains (Coyne et al. 1974; Serkowski et al. 1975) and the total to selective extinction (Whittet & van Breda 1978). The mean value of corresponds to m (Whittet & van Breda 1978). Although Fig. 6 does not show a peak in polarization at or around that wavelength, as expected if the variation of the polarization degree with wavelength came exclusively from the ISM, the large error bars and the small number of points makes this result inconclusive. On the other hand, the polarization degree of unreddened Be stars peaks in the blue ( m) and decreases with wavelength in the range 0.45-0.80 m (Poeckert et al. 1979; McDavid 2001; Halonen et al. 2013; Haubois et al. 2014). Fig. 6 agrees with the expected behaviour of Be stars.
ii) The relationship between polarization and extinction has been studied by a number of authors (Hiltner 1956; Serkowski et al. 1975; Jones 1989; Fosalba et al. 2002). These studies show that the polarization fraction increases as the extinction increases, albeit with a large scatter. Using the relationship (Fosalba et al. 2002), we estimate that the maximum contribution of the ISM to the measured optical polarization towards SAX J2239.3+6116 would be %, which is lower than the observed polarization.
iii) An upper limit on the polarization degree from the ISM can be estimated by measuring the polarization degree of field stars. If, on average, the polarization degree of field stars is lower than that of the source, then we can conclude that the ISM cannot account for all the measured polarization, hence some of it must be intrinsic. We measured the and Stokes parameters in the R band of 20 stars in the Robopol field of view not blocked by the mask in the target images and derive the mean polarization degree () and angle () and the corresponding standard deviations ( and ). We selected those stars with more than five measurements; the four light spots free of nearby sources to avoid overlapping; signal-to-noise ratio, , larger than 3; a dispersion in the polarization angle, , lower than 10∘; and a dispersion in polarization degree, , lower than 1% to avoid variable sources. In addition, to increase the accuracy of the polarization parameters, we selected four field stars of comparable brightness in the vicinity of the target and observed them following the same procedure as the target, that is, by placing them at the centre of the mask of the polarimeter. Table 6 gives the details of these observations. Figure 7 shows the plane of the field stars (circles) and the target (squares). Filled circles correspond to the field stars that were observed at the centre of the mask. We can estimate the intrinsic polarization of SAX J2239.3+6116 by vectorially subtracting the weighted mean of the and Stokes parameters of the field stars from those of the source . The polarization degree of the Be star companion in SAX J2239.3+6116 is %.
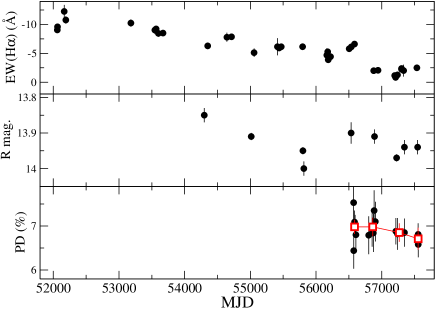
iv) The polarization caused by the ISM is supposed to be constant. Therefore, if variability is observed, then it can be attributed to the source. Fig. 5 shows the variation of the H equivalent width, R magnitude, and polarization degree. All three quantities decrease with time. A linear regression to all polarimetric data points taking the errors into account does not reveal significant variation (, ) and the slope is almost consistent with zero (), i.e. no variation. If the regression is performed on the weighted average, then the decrease is significant at 95% level (, , ). Here is the probability that the correlation occurs by chance and is the correlation coefficient.
In summary, although the results presented above are affected by large uncertainty when they are considered individually, overall they provide evidence that the light of the optical counterpart to SAX J2239.3+6116 is polarized to a few percent.

4 Discussion
The information on SAX J2239.3+6116 is scarce. Dedicated observations have been reported on only three works: X-ray observations that led to the discovery of SAX J2239.3+6116 as a transient X-ray source and follow-up optical observations (in’t Zand et al. 2000), discovery of X-ray pulsations and confirmation of the orbital period from X-ray outbursts (in’t Zand et al. 2001), and one more optical observation (photometry and spectroscopy) in the context of a global study of circumstellar emission in BeXBs (Riquelme et al. 2012). In this work we present the first detailed study of the optical variability of SAX J2239.3+6116.
The derived spectral type of B0V is in good agreement with the spectral type distribution of confirmed galactic BeXBs, shown in Fig. 8. The data to create this figure were taken from Reig (2011). When the spectral type is only approximately known, we give the same weight to each spectral subtype covered by the range. That is, if a star is classified as B0-1V, then the bar corresponding to the spectral types B0, B0.5, and B1 each take one-third in the histogram of Fig. 8. All spectrally identified optical companions of confirmed BeXBs in the Milky Way have spectral type earlier than B3 with a peak at B0 (see also Negueruela 1998).
The long-term decline of the H equivalent width (Fig. 1) implies a progressive weakening of the disk over a period of at least 15 years. The source appears to be slowly approaching a disk-loss phase. A linear fit to the entire set of data in the top panel of Fig. 1 yields that EW(H) decays at a relatively slow rate of 0.0015 Å/d. Extrapolating this trend, we find that it would reach EW(H)=0 Å on MJD 58400 (October 2018) and EW(H)=+2.5 Å (the expected equivalent width of a photospheric line of a B0V star) on MJD 60066 (May 2023). The latter situation would correspond with the complete loss of the disk. This rate is typically 3–4 times slower than other BeXBs (Reig et al. 2016) and can be understood by the large orbital separation between the two components of the binary. Reig et al. (2016) found a correlation between the disk growth rate and the orbital period. Systems with small orbits tend to display faster growth rates and more optical variability. The interaction between the disk and the neutron star appears as the primary cause of this correlation. SAX J2239.3+6116 has the longest orbital period of all known BeXBs with d (in’t Zand et al. 2001). In this system, the neutron star is so distant that the Be star disk would be weakly affected by its gravitational pull. In this sense, the disk in SAX J2239.3+6116 would behave like those in classical isolated Be stars, which exhibit longer dissipation-reformation cycles.
Although EW(H) has been increasing since 2015 (see Table 1), which could be a sign that the disk has begun a full recovery, we note the irregular evolution of the equivalent width. As can be seen in Fig. 1 and Table 1, small increases in EW(H), for example in 2001, 2008, and 2013, were followed by deeper drops. Future observations will reveal whether SAX J2239.3+6116 will go through a full disk-loss episode, or indeed the disk reached a minimum in 2015 and will start a new reformation phase. The recovery of the disk without a complete loss has been seen in other BeXBs, such as GRO J2058+42 and RX J0146.9+6121 (see e.g. Fig. 1 in Reig et al. 2016).
The symmetric profiles suggest the absence of a perturbed disk. This can be explained assuming a relatively small disk. Reig et al. (2010) have suggested that a small disk cannot support a density perturbation because the disk became too tenuous. As a rough estimate, they found that during the final stages of the disk evolution, V/R asymmetries can be seen up to a disk radius of , whereas during the subsequent disk formation after a disk-loss episode, a density perturbation does not develop until the disk radius is of the order of 4 . The disk radius can be estimated from the separation of the emission line peaks and the rotational velocity (Huang 1972),
| (2) |
Using the values derived in the previous sections, the disk radius in SAX J2239.3+6116 varies in the range 1–6 . The larger disks correspond to observations prior 2005. From 2005-2009 the disk radius is , while since 2010, .
We also carried out a polarimetric study of SAX J2239.3+6116. We found that the optical light emitted from the source is polarized and that the ISM cannot account for the total measured polarization (Fig. 7). We estimated the intrinsic polarization degree to be % in the R band. Although in the limit of what models predict (Wood et al. 1996), this value is consistent with electron scattering from the circumstellar disk. If the origin of polarization is the circumstellar disk, then we would expect long-term polarimetric variability, similar to the photometric and spectroscopic variability. A correlation between polarization, H emission, and brightness has been reported for the Be/X-ray binary X Per and interpreted in terms of disk development (Kunjaya & Hirata 1995; Roche et al. 1997). In contrast, Larionov (1987) suggested that the source of variable polarized radiation measured in the BeXB 1A 0535+262 is an accretion disk around the neutron star. In SAX J2239.3+6116, the changes in polarimetry are less pronounced than in spectroscopy and photometry, which show a large amplitude decrease trend over time (Fig. 5). There are several reasons for this. First, the time span covered by the polarimetric observations is shorter and corresponds to recent years, where the disk has presumably shrunk. Second, we argued above that SAX J2239.3+6116 is viewed at a small inclination angle. The polarization degree is strongly dependent on the inclination angle. In pole-on systems, we do not expect to observe polarization because of the uniform distribution of polarizing planes (Wood et al. 1996). As the inclination angle increases, so does the polarization degree, reaching a maximum at around 70–80∘ (Wood et al. 1996; Halonen et al. 2013). Low-inclination systems () typically exhibit smaller amplitude changes in polarization degree than higher inclination systems (Halonen & Jones 2013; Haubois et al. 2014).
5 Conclusion
We have performed optical photometric, spectroscopic, and polarimetric observations of the optical counterpart to SAX J2239.3+6116. We derived a spectral type B0Ve from the ratios of various metallic lines and we estimated the rotation velocity of the underlying B star in 200 km s-1 from the width of hydrogen and He I lines. We estimated the distance to be 4.9 kpc from the photometric magnitudes and colours and the strength of various diffuse interstellar bands. We report, for the first time, intrinsic optical linear polarization from the circumstellar disk of the Be star companion at a level of . The long-term optical variability of this system is characterized by the slow dissipation of the circumstellar disk around the Be star companion. The observational consequence of this decline is the decrease of the optical brightness, the strength of the H line, and the polarization degree. We argue that the long variability timescales observed in this system are due to the relatively weak gravitational pull exerted by the neutron as a consequence of its wide orbit.
Acknowledgements.
Skinakas Observatory is a collaborative project of the University of Crete and the Foundation for Research and Technology-Hellas. The RoboPol project is a collaboration between the University of Crete/FORTH in Greece, Caltech in the USA, MPIfR in Germany, IUCAA in India, and Torun Centre for Astronomy in Poland. The WHT and its service programme (service proposal references SW2014b12) are operated on the island of La Palma by the Isaac Newton Group in the Spanish Observatorio del Roque de los Muchachos of the Instituto de Astrofísica de Canarias. This work has made use of NASA’s Astrophysics Data System Bibliographic Services and of the SIMBAD database, operated at the CDS, Strasbourg, France.References
- Coyne et al. (1974) Coyne, G. V., Gehrels, T., & Serkowski, K. 1974, AJ, 79, 581
- Cranmer (2005) Cranmer, S. R. 2005, ApJ, 634, 585
- Delgado-Martí et al. (2001) Delgado-Martí, H., Levine, A. M., Pfahl, E., & Rappaport, S. A. 2001, ApJ, 546, 455
- Ferrigno et al. (2013) Ferrigno, C., Farinelli, R., Bozzo, E., et al. 2013, A&A, 553, A103
- Fosalba et al. (2002) Fosalba, P., Lazarian, A., Prunet, S., & Tauber, J. A. 2002, ApJ, 564, 762
- Galazutdinov et al. (2000) Galazutdinov, G. A., Musaev, F. A., Krełowski, J., & Walker, G. A. H. 2000, PASP, 112, 648
- Grundstrom et al. (2007) Grundstrom, E. D., Boyajian, T. S., Finch, C., et al. 2007, ApJ, 660, 1398
- Gutierrez-Moreno (1979) Gutierrez-Moreno, A. 1979, PASP, 91, 299
- Haigh et al. (2004) Haigh, N. J., Coe, M. J., & Fabregat, J. 2004, MNRAS, 350, 1457
- Halonen & Jones (2013) Halonen, R. J. & Jones, C. E. 2013, ApJ, 765, 17
- Halonen et al. (2013) Halonen, R. J., Mackay, F. E., & Jones, C. E. 2013, ApJS, 204, 11
- Haubois et al. (2014) Haubois, X., Mota, B. C., Carciofi, A. C., et al. 2014, ApJ, 785, 12
- Herbig (1975) Herbig, G. H. 1975, ApJ, 196, 129
- Herbig & Leka (1991) Herbig, G. H. & Leka, K. D. 1991, ApJ, 382, 193
- Hiltner (1956) Hiltner, W. A. 1956, ApJS, 2, 389
- Huang (1972) Huang, S.-S. 1972, ApJ, 171, 549
- Hummel & Vrancken (2000) Hummel, W. & Vrancken, M. 2000, A&A, 359, 1075
- in’t Zand et al. (2000) in’t Zand, J. J. M., Halpern, J., Eracleous, M., et al. 2000, A&A, 361, 85
- in’t Zand et al. (2001) in’t Zand, J. J. M., Swank, J., Corbet, R. H. D., & Markwardt, C. B. 2001, A&A, 380, L26
- Janot Pacheco et al. (1982) Janot Pacheco, E., Chevalier, C., & Ilovaisky, S. A. 1982, in IAU Symposium, Vol. 98, Be Stars, ed. M. Jaschek & H.-G. Groth, 151–154
- Janot-Pacheco et al. (1981) Janot-Pacheco, E., Ilovaisky, S. A., & Chevalier, C. 1981, A&A, 99, 274
- Johnson (1966) Johnson, H. L. 1966, ARA&A, 4, 193
- Jones (1989) Jones, T. J. 1989, ApJ, 346, 728
- King et al. (2014) King, O. G., Blinov, D., Ramaprakash, A. N., et al. 2014, MNRAS, 442, 1706
- Kos & Zwitter (2013) Kos, J. & Zwitter, T. 2013, ApJ, 774, 72
- Kunjaya & Hirata (1995) Kunjaya, C. & Hirata, R. 1995, PASJ, 47, 589
- Landolt (2009) Landolt, A. U. 2009, AJ, 137, 4186
- Larionov (1987) Larionov, V. M. 1987, Astrophysics, 27, 345
- Lyubimkov et al. (1997) Lyubimkov, L. S., Rostopchin, S. I., Roche, P., & Tarasov, A. E. 1997, MNRAS, 286, 549
- McDavid (2001) McDavid, D. 2001, ApJ, 553, 1027
- Negueruela (1998) Negueruela, I. 1998, A&A, 338, 505
- Negueruela & Okazaki (2001) Negueruela, I. & Okazaki, A. T. 2001, A&A, 369, 108
- Negueruela et al. (1999) Negueruela, I., Roche, P., Fabregat, J., & Coe, M. J. 1999, MNRAS, 307, 695
- Parkes et al. (1980) Parkes, G. E., Murdin, P. G., & Mason, K. O. 1980, MNRAS, 190, 537
- Poeckert et al. (1979) Poeckert, R., Bastien, P., & Landstreet, J. D. 1979, AJ, 84, 812
- Porter (1996) Porter, J. M. 1996, MNRAS, 280, L31
- Puspitarini et al. (2013) Puspitarini, L., Lallement, R., & Chen, H.-C. 2013, A&A, 555, A25
- Reig (2011) Reig, P. 2011, Ap&SS, 332, 1
- Reig & Fabregat (2015) Reig, P. & Fabregat, J. 2015, A&A, 574, A33
- Reig et al. (1997) Reig, P., Fabregat, J., Coe, M. J., et al. 1997, A&A, 322, 183
- Reig et al. (2001) Reig, P., Negueruela, I., Buckley, D. A. H., et al. 2001, A&A, 367, 266
- Reig et al. (2004) Reig, P., Negueruela, I., Fabregat, J., et al. 2004, A&A, 421, 673
- Reig et al. (2005) Reig, P., Negueruela, I., Fabregat, J., Chato, R., & Coe, M. J. 2005, A&A, 440, 1079
- Reig et al. (2016) Reig, P., Nersesian, A., Zezas, A., Gkouvelis, L., & Coe, M. J. 2016, A&A, 590, A122
- Reig & Zezas (2014) Reig, P. & Zezas, A. 2014, A&A, 561, A137
- Reig et al. (2010) Reig, P., Zezas, A., & Gkouvelis, L. 2010, A&A, 522, A107
- Riquelme et al. (2012) Riquelme, M. S., Torrejón, J. M., & Negueruela, I. 2012, A&A, 539, A114
- Roche et al. (1997) Roche, P., Larionov, V., Tarasov, A. E., et al. 1997, A&A, 322, 139
- Serkowski et al. (1975) Serkowski, K., Mathewson, D. S., & Ford, V. L. 1975, ApJ, 196, 261
- Simón-Díaz & Herrero (2007) Simón-Díaz, S. & Herrero, A. 2007, A&A, 468, 1063
- Slettebak (1982) Slettebak, A. 1982, ApJS, 50, 55
- Staubert et al. (2011) Staubert, R., Pottschmidt, K., Doroshenko, V., et al. 2011, A&A, 527, A7
- Steele et al. (1999) Steele, I. A., Negueruela, I., & Clark, J. S. 1999, A&AS, 137, 147
- Townsend et al. (2004) Townsend, R. H. D., Owocki, S. P., & Howarth, I. D. 2004, MNRAS, 350, 189
- Vacca et al. (1996) Vacca, W. D., Garmany, C. D., & Shull, J. M. 1996, ApJ, 460, 914
- Walborn & Fitzpatrick (1990) Walborn, N. R. & Fitzpatrick, E. L. 1990, PASP, 102, 379
- Waters & Marlborough (1992) Waters, L. B. F. M. & Marlborough, J. M. 1992, A&A, 256, 195
- Webster (1974) Webster, B. L. 1974, MNRAS, 169, 53P
- Wegner (1994) Wegner, W. 1994, MNRAS, 270, 229
- Wegner (2006) Wegner, W. 2006, MNRAS, 371, 185
- Whittet & van Breda (1978) Whittet, D. C. B. & van Breda, I. G. 1978, A&A, 66, 57
- Wood et al. (1996) Wood, K., Bjorkman, J. E., Whitney, B. A., & Code, A. D. 1996, ApJ, 461, 828
- Yudin (2001) Yudin, R. V. 2001, A&A, 368, 912