A minimal model for spontaneous cell polarization and edge activity in oscillating, rotating and migrating cells
Abstract
How the cells break symmetry and organize their edge activity to move directionally is a fundamental question in cell biology. Physical models of cell motility commonly rely on gradients of regulatory factors and/or feedback from the motion itself to describe polarization of edge activity. Theses approaches, however, fail to explain cell behavior prior to the onset of polarization. Our analysis using the model system of polarizing and moving fish epidermal keratocytes suggests a novel and simple principle of self-organization of cell activity in which local cell-edge dynamics depends on the distance from the cell center, but not on the orientation with respect to the front-back axis. We validate this principle with a stochastic model that faithfully reproduces a range of cell-migration behaviors. Our findings indicate that spontaneous polarization, persistent motion, and cell shape are emergent properties of the local cell-edge dynamics controlled by the distance from the cell center.
The ability to break symmetry and move directionally is an essential property of most eukaryotic cells Ridley2003 ; Danuser2013 ; Mogilner2009 . This happens in response to external stimuli, but also spontaneously Wedlich2003 ; Devreotes2003 ; Verkho1999 . Persistent motion requires segregation of cell-edge activities, so that protrusion happens predominantly at the front, and retraction at the back of the cell. In contrast, in cells exploring their environment, edge activity is on average spatially isotropic, but fluctuates in time between protrusion and retraction Tkachenko2011 ; Burnette2011 ; Ryan2012 ; Giannone2007 ; Ji2008 . Thus both exploratory activity and the directional motion depend on the transitions between protrusion and retraction but how the cell chooses between these two regimes to establish spatial and temporal patterns of edge activity remains unclear. It is believed that in migrating cells a directional mechanism at the scale of the whole cell, e.g. a global gradient of cytoskeletal and/or signaling components, orchestrates cell-edge dynamics according to the overall motion direction Ridley2003 ; Lakayo2007 ; Devreotes2003 ; Lin2012 ; Keren2008 This concept is limited in that external directional stimuli Devreotes2003 ; Lin2012 in combination with internal diffusible signals interacting through feedback loops Onsum2009 ; Holmes2012 ; Maree2006 ; Mori2008 ; Satulovsky2008 ; Doubrovinski2011 , feedback from the motion itself Verkho1999 ; Nishimura2009 ; Ziebert2012 ; Du2012 ; Maiuri2015 , or very large and highly correlated perturbation to induce the polarized states Barnhart2015 have to be invoked in order to establish the polarity axis.
Fish epidermal keratocytes, thanks to their robust polarity, simple shape, and persistent motion, are a classic model system to study polarization and directional migration Mogilner2009 ; Lee1993 . Analysis of the edge dynamics of these cells led to the concept of Graded Radial Extension (GRE), which links local edge dynamics to the resulting overall cell motion: protrusion and retraction are directed normally to the cell edge with rates that are graded depending on the orientation with respect to the motion direction Lee1993 . This model inspired several studies searching for the underlying mechanism in the form of a gradient of cytoskeletal and/or signaling components from the front to the back of the cell. Gradients of myosin II, actin, and small GTPases of the Rho family Lakayo2007 ; Barnhart2011 ; Maree2006 ; Verkho1999 ; Ziebert2012 ; Grimm2003 ; Keren2008 ; Wilson2010 have been implicated, but it remains unclear how these gradients arise in the first place and whether they are cause or consequence of polarization and directed motion Wolgemuth2011 . The concept of a directional gradient guiding the cell polarity axis cannot describe cell-edge activity in presence of multiple leading edges Lou2015 or prior to the point when the direction of motion becomes defined. In this study, we start from quantification of experimentally observable cell edge dynamics to identify features that are common to the migration and the polarization process. We find that cell edge universally displays a distance-dependent switch from protrusion to retraction, and we develop a computational model to demonstrate that this property is sufficient for spontaneous polarization and directional motion.
I Edge dynamics in migrating cells
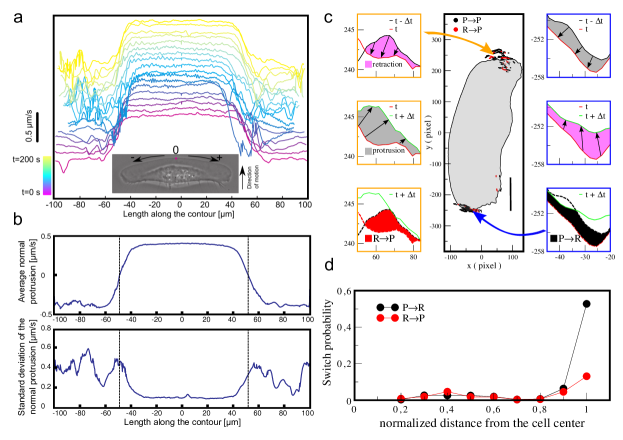
Using a recently developed cell-edge segmentation and tracking method Markus2012 , we have quantified protrusion velocities in keratocytes with high spatial and temporal resolution. During migration, the protrusion velocity in the regularly shaped (coherent) cells Lakayo2007 ; Keren2008 was nearly constant and stable in time along the central part of the leading edge, but declined and fluctuated toward the sides, becoming eventually negative (retraction) (Fig. 1a and b). While previous studies considered the edge velocity to be constant in time and rather emphasized its gradation in space, we explore the outcome of temporal velocity fluctuations. We designed a method to identify the positions along the cell contour where the edge velocity switched in time from protrusion to retraction (PR) and from retraction to protrusion (RP) (Fig. 1c and Methods). Our mapping revealed that most of the switches localized to narrow zones at the lateral extremities of the cells. Plotting the switch probability as a function of the distance from the geometrical center of the cell (see Methods) indicated that approximately of switches occurred between and of the maximal cell extension (Fig. 1d). The majority of switches were from protrusion to retraction, but, interestingly, we observed that the cell extremities also displayed RP switches ( the total number of switches), suggesting metastable edge dynamics at these sites. Some switches marginally appeared () at intermediate distances (Fig. 1d). They occurred at the back of the cell and were attributed to the dynamics of retraction fibers Schaub2007 .
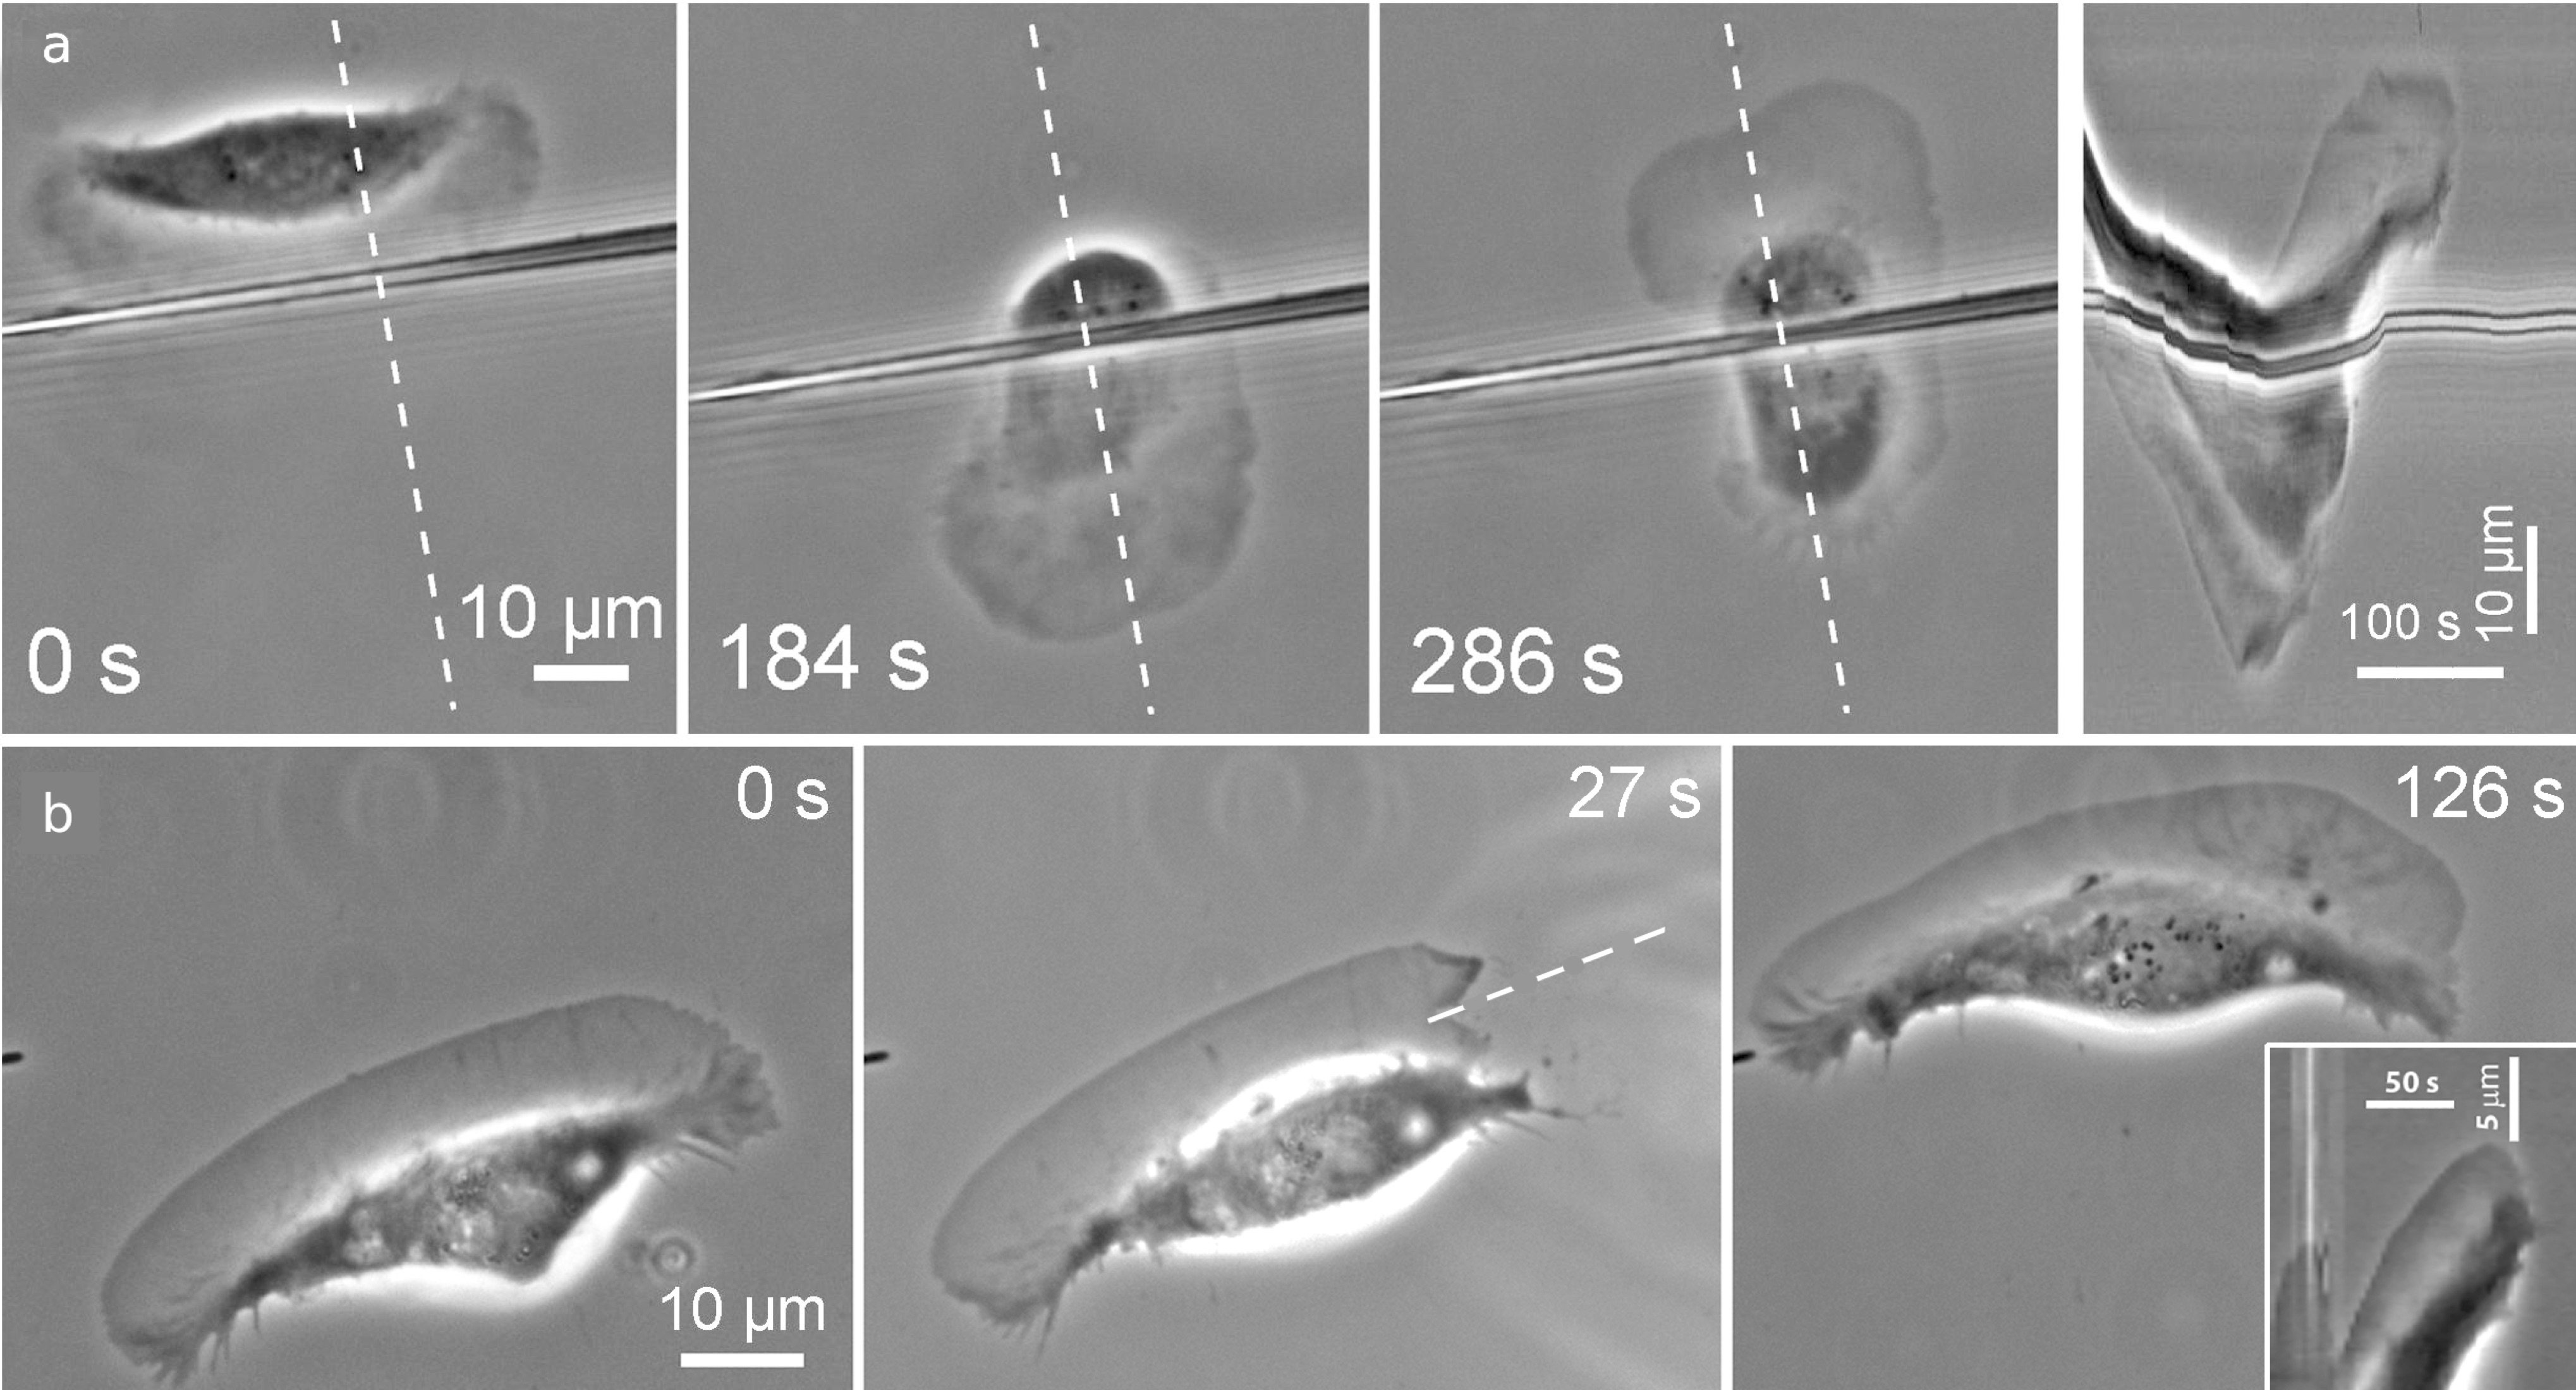
We point out that the regions of most probable switching correspond at the same time to the maximal cell extension and to the parts of the cell edge displacing orthogonally to the direction of motion. To discriminate which of the two descriptors, orthogonal orientation with respect to the direction of motion or distance from the cell center, defines the distribution of switches, we manipulated the cells to change the distance between the edge and the cell center at different orientations. To increase the distance along the direction of motion, we placed a micropipette in front of the cell, allowing the leading edge to squeeze between the pipette and the substrate, but blocking the taller nucleus. The leading edge maintained its directional motion at constant velocity (right panel in Fig. 2a) until the cell extended to a distance similar to its original maximal lateral extension. At this point, the edge halted, fluctuated, and switched to retraction, resulting in a reversal of cell motion (Fig. 2a and Supplementary Video LABEL:vidpipette, similar responses observed in 12 out of 12 cells). We also tested the effect of a reduction of the distance between the edge and the cell center by cutting off a part of one lateral wing of a cell. The cut side exhibited persistent protrusion transverse to the direction of motion (inset in Fig. 2b) until the cell recovered its original width. The protrusion zone may even propagate from the site of the cut to the back of the cell, resulting in a turning of the cell in the direction of the cut (Fig. 2b and Supplementary Video LABEL:vidcut, identical response observed in 29 out of 32 cells). Since pipette blocking induced switches at the front and cutting suppressed them at the side, both types of manipulations provide evidence that switches are regulated by distance from the cell center rather than by angle with respect to the cell motion direction. If angular hypothesis was true, the cell would continue protruding at the front in the pipette experiment and maintained switches at the cut side in the cutting experiment.
II Edge dynamics in polarizing cells
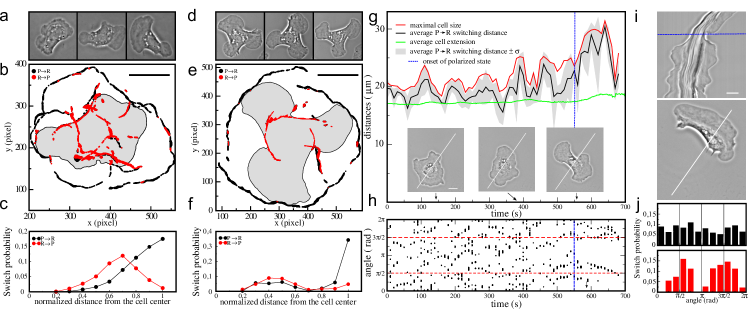
Next, we investigated the dynamics of edge activity during the process of spontaneous cell polarization. In the course of polarization, most of the cells exhibited multiple irregular fluctuations and waves around the edge with small regions of protrusion and retraction coalescing into larger zones Markus2012 (Fig. 3a, Supplementary Videos LABEL:vidalicia and LABEL:vidrotpol). Polarized cell with a single protruding and a single retracting region emerged as the result of these protrusion-retraction fluctuations that occurred during the polarization process. Interestingly some cells were trapped during polarization in exotic 2-fold or 3-fold symmetric configurations with several leading edges rotating for several minutes (Fig. 3d and Supplementary Video LABEL:vidrotpol). Both fluctuating and rotating cells eventually polarized forming a single protruding and a single retracting region. Mapping of switches in fluctuating cells showed that switch sites were distributed evenly along the cell edge (Fig. 3b) and both types of transition had similar probability to occur ( of the total number were PR switches). The distribution of switching distances displayed a peak of PR switches near the maximal cell extension and a peak of RP switches at intermediate distances (Fig. 3c). In the cells that displayed multiple rotating edges, switches localized mostly at the tips and bases of the rotating segments (Fig. 3e), and the two types of switches were unbalanced ( of PR switches). As in fluctuating and migrating cells, PR switches occurred near the maximal cell extension, while RP switches were more likely at short distances from the cell center (Fig. 3f).
Analysis of dynamics of PR switches in time during the transition between isotropic and polarized states demonstrated that they remained near the maximal cell extension during the entire process of polarization, including the onset of persistent migration (Fig. 3g). Measuring the angle between the orientation of PR switches with respect to the cell center and the direction of the instantaneous velocity showed that switches occurred at any angle up to the onset of polarized state and then the angles became narrowed to the two zones orthogonal to the velocity (Fig. 3h and j). These results indicate that despite changes in cell morphology the switches from protrusion to retraction always occur near maximal cell extension suggesting that this is an important feature underlying cell-edge dynamics during the polarization process.
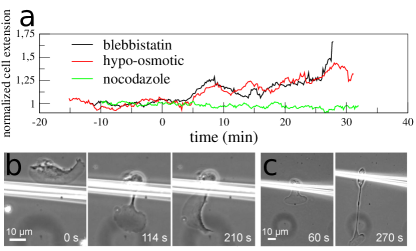
In order to gain insight into the mechanisms controlling this switching distance we tested if the cell width during migration and the response in body-blocking experiments depended on the cell volume, contractility, and the integrity of the microtubule system. Increasing the cell volume by hypo-osmotic treatment and inhibiting myosin-II-dependent contractility by blebbistatin both led to an increase in cell width (with eventual cell fragmentation in the case of myosin inhibition) (Fig. 4a). Cell-body-blocking experiments with inflated cells showed a partial suppression of the distance sensing: in of the cases (3 out of 6 cells) cells kept extending their leading edge until it eventually detached from the cell body (Fig. 4c and Supplementary Video LABEL:vidpipette). The blebbistatin-treated cells extended their front lamellipodia away from the cell body, while remaining connected to the latter by a narrow stalk (in contrast to a wide bridge in the control case). However, in of the cases (9 out of 12 cells) the lamellipodia did not extend continuously, instead turning to a motion direction parallel to the pipette (Fig. 4b and Supplementary Video LABEL:vidpipette). These results indicate that distance sensing is not a trivial consequence of finite membrane area or of cytoskeletal protein content, but depends on the cell volume and/or three-dimensional shape Chiara2013 along with myosin-dependent contractility. In contrast, disassembly of microtubules with nocodazole affected neither the cell width (Fig. 4a), nor the cell response in the body-blocking experiments (Supplementary Video LABEL:pipettenoco). This suggests that, unlike in other systems where micro-tubules were implicated in cell-size control Martin2009 ; Picone2010 , they do not play such a role in keratocytes.
III Computational model
We developed a stochastic model incorporating the features of cell-edge dynamics uncovered in our experiments. The model is deliberately reductionist and minimal, in order to test whether switches induced by a threshold distance are indeed sufficient to explain the transition to a polarized state, directional motion and cell shape. We describe the cell edge by a set of points (i.e., computational particles) in two possible states: protrusion (P) or retraction (R). PR switches occur at a threshold distance from the cell center, while RP switches occur at a smaller threshold distance . The state of a point also changes if most of its neighbors within a defined interaction range are in the opposite state, providing coupling that enables local ordering of the edge activity. Specifically, each point , at a distance from the cell center has a probability (resp. ) to switch from protrusion to retraction (resp. from retraction to protrusion), given by:
where is an overall rate of transition () that takes into account the self-persistence of the point state. It effectively allows increasing the displacement of a point between transitions while preventing numerical instabilities. is a Gaussian random number with mean and variance (corresponding to a noisy threshold distance), is the number of neighbors (within the range of interaction N) of that are in the opposite state, thus accounts for coupling. The position of each point is then updated as:
with protruding nodes moving outward normally to the edge at constant velocity (Fig. 1a) and retracting nodes moving toward the cell center with a distance dependent velocity (Methods and Supplementary Fig. LABEL:figS2). At each time step, the position of the cell center is calculated from the coordinates of edge points as described in Methods.
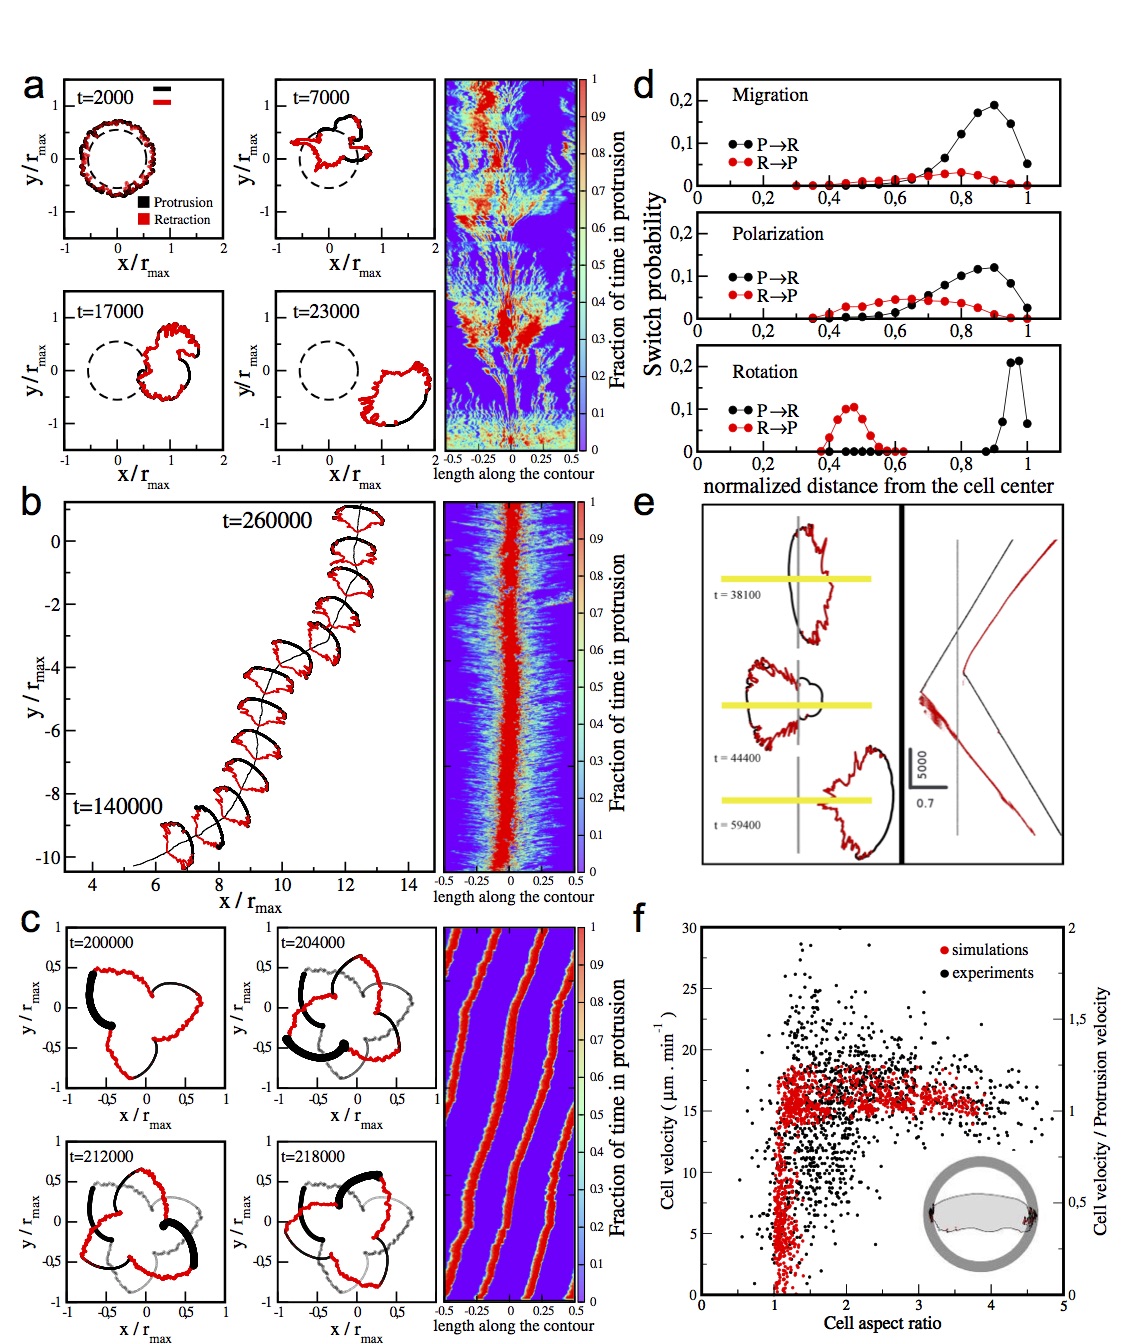
For a wide range of parameters (Supplementary Figs. LABEL:figS3, LABEL:figS4, LABEL:figS5), this combination of isotropic rules of local edge dynamics led to self-organization with spontaneous transition from disordered initial states to a polarized motile state with emergent shapes reproducing experimental observations (Fig. 5). The simulations were started from a circular outline with random distribution of protruding and retracting points; first, the edge displayed strong shape fluctuations comparable to those observed in experiments with small protruding and retracting regions traveling and fusing into larger zones (Fig. 5a, Supplementary Video LABEL:simulpolarization). Then, the persistently migrating state was reached with stable typical keratocyte shapes elongated perpendicular to the direction of motion (Fig. 5b, Supplementary Video LABEL:simulpolarization). The analysis of the resulting cell outlines with the same switch mapping protocol that was used for real cells yielded distributions of switches similar to the experimental ones both for polarizing and migrating cells (Fig. 5d). The model was also able to sustain the rotating state of a specific initial 3-fold configuration with three leading and trailing edges (Fig. 5c and Supplementary Video LABEL:simulrot). We also simulated cell-blocking experiments with a virtual pipette in the form of a line that could not be passed by the cell center. In this numerical experiment, the outline backed up in a way similar to real cells: by extending at a constant speed, halting, fluctuating in place, and eventually retracting and reversing its direction (Fig. 5e, and Supplementary Video LABEL:simulpipette). Finally, removing the lateral part of the cell outline and replacing it with a straight line segment resulted in persistent protrusion and turning of the cell toward the removed part of the edge (Supplementary Video LABEL:simulcut), in agreement with the cutting experiments.
The simulation model also allowed us to test different mechanisms of shape feedback. If the distance limit was replaced by linking the switching probability to either cell area or to the overall ratio of protruding vs. retracting points, the system developed neither stable shape nor directional motion (Supplementary Video LABEL:simulpolmig). Any feedback coupling local edge dynamics to a mean cell property that affects all points would prevent local order from propagating. In contrast, the distance limit, while still encoding global information through the position of the cell center, affects only specific points. A distance threshold coupled to the motion of the cell creates localized zones of frustration at the cell edge, where PR switch is favored, maintaining phase segregation of cell-edge activity and hence stabilizing the system. Experimentally, only the lateral extremities of migrating cells reach the critical distance and switch from protrusion to retraction, thus stabilizing the width of the cell, while the points at the front and back move in concert and maintain their state as long as they do not pass the critical distance threshold. This switch distribution pattern is only possible if the cell has an elongated shape, explaining why such anisotropic shapes, minimizing the edge fluctuations, emerge from the isotropic distance-threshold mechanism. This is consistent with keratocytes being one of the most efficient types of migrating cells. If, for any reason, the aspect ratio of the cell decreases and approaches unity, our model predicts that the distance threshold would induce switches to retraction at the front and fluctuations of the velocity of the leading edge, resulting in a decrease of the net velocity of motion. Indeed, it has been experimentally observed that keratocyte velocity depends on the cell aspect ratio with cells of smaller aspect ratio having variable and lower velocities Keren2008 . We have confirmed this effect experimentally and also reproduced it in the simulations (Fig. 5f).
Protrusion/retraction transition is a ubiquitous cellular phenomenon that has been linked with various molecular processes Tkachenko2011 ; Burnette2011 ; Ryan2012 ; Giannone2007 and with mechanical force generation Ji2008 . However, previous studies did not provide a unified model to relate local cell-edge fluctuations to either cell symmetry breaking during polarization or overall cell shape and motion. In this paper, we used high-resolution edge segmentation and cell-shape modification experiments, to show that the dynamics of switches from protrusion to retraction is controlled by the distance from the cell center. We developed a top-down stochastic model to demonstrate that this isotropic property of distance-dependence leads to spontaneous symmetry breaking. Our model thus relates overall cell behavior to local protrusion-retraction dynamics. The model simulations have shown that the hypothesized mechanism is indeed sufficient to reproduce the experimentally observed cell behavior, also under perturbations. Such distance sensing leads to a genuine self-organization with emerging shape and motion being the macroscopic manifestations of rotational symmetry breaking in the localization of switches. Our findings suggest that cell volume and contractility, but not the microtubule system, may play a role in the mechanism of distance sensing. One possibility related to contractile properties is that traction stresses generated by acto-myosin network scale with the size of the network and induce detachment from the substrate and collapse at a critical distance. Another possibility is that the distance and volume can influence force balance at the cell edge through three-dimensional geometry: extension of the cell is expected to flatten its apical surface and therefore increase the components of membrane Chiara2013 and cortical tension Fouchard2014 in the substrate plane, while increasing the cell volume would have the opposite effect on the orientation of forces and thus suppress distance sensitivity. These force-related mechanisms do not exclude a contribution of intra-cellular gradients of structural or regulatory components, which may depend on cell volume and contractility. A unique feature of our model, however, is that gradients do not necessarily have to be oriented in the direction of motion. Instead, we propose a center-to-periphery radial gradient of the probability of protrusion-retraction switches. This probability may depend on regulatory factors, e.g. small GTPases, that could develop a radial gradient by a reaction-diffusion mechanism Holmes2012 ; Mori2008 , marking the cell margins in a way that is similar to how the Min-protein system in bacteria marks the middle of the cell Schweizer2012 . After motion onset, front-to-back gradients may develop as well, but their role would be to reinforce motion rather than to initiate it. Another important feature of our model is that cell-edge activity is not imposed deterministically. Instead, the position in the putative radial gradient only encodes disjoint zones of increased switching probability. The behavior between these zones may rely on cytoskeletal reactions favoring persistence, e.g., autocatalytic actin network branching Pollard2007 and contraction that may be self-sustained due to its ability to concentrate myosin motors Verkho1999 ; Barnhart2015 ; Schaub2007 . Future studies will uncover the interplay of cell contractility, cell volume, and other factors involved in radial organization in order to reveal the physical and molecular underpinnings of distance sensing and to determine how this mechanism is involved in different cell shapes and behaviors.
References
- (1) Ridley, A.J. et al. Cell migration: integrating signals from front to back. Science. 302, 1704–1709 (2003).
- (2) Danuser, G., Allard, J. Mogilner, A. Mathematical modeling of eukaryotic cell migration: insights beyond experiments. Annu Rev Cell Dev Biol. 29, 501-28 (2013).
- (3) Mogilner, A. Keren, K. The shape of motile cells. Curr Biol. 19, R762-71 (2009).
- (4) Wedlich-Soldner, R. Li, R. Spontaneous cell polarization: undermining determinism. Nat Cell Biol. 5, 267-270 (2003).
- (5) Devreotes, P. Janetopoulos, C. Eukaryotic chemotaxis: distinctions between directional sensing and polarization. J Biol Chem. 278, 20445-8 (2003).
- (6) Verkhovsky, A.B., Svitkina, T.M. Borisy, G.G. Self-polarization and directional motility of cytoplasm. Curr. Biol. 9, 11–20 (1999).
- (7) Tkachenko, E. et al. Protein kinase A governs a RhoA-RhoGDI protrusion-retraction pacemaker in migrating cells. Nat Cell Biol. 13, 660-667 (2011).
- (8) Burnette, D.T. et al. A role for actin arcs in the leading-edge advance of migrating cells. Nat Cell Biol. 13, 371-381 (2011).
- (9) Ryan, G.L., Petroccia, H.M., Watanabe, N. Vavylonis, D. Excitable actin dynamics in lamellipodial protrusion and retraction. Biophys J. 102, 1493-502 (2012).
- (10) Giannone, G. et al. Lamellipodial actin mechanically links myosin activity with adhesion-site formation. Cell. 128, 561-575 (2007).
- (11) Ji, L., Lim, J. Danuser, G. Fluctuations of intracellular forces during cell protrusion. Nat Cell Biol. 10, 1393-1400 (2008).
- (12) Lakayo, C.I. et al. Emergence of large-scale cell morphology and movement from local actin filament growth dynamics. PLoS Biol. 5, e233 (2007).
- (13) Lin, B. et al. Synthetic spatially graded Rac activation drives cell polarization and movement. Proc Natl Acad Sci U S A. 109, E3668-77 (2012).
- (14) Keren, K. et al. Mechanism of shape determination in motile cells. Nature. 453, 475-480 (2008).
- (15) Onsum, M.D. Rao, C.V. Calling heads from tails: the role of mathematical modeling in understanding cell polarization. Curr Opin Cell Biol. 21, 74-81 (2009).
- (16) Holmes, W.R. Edelstein-Keshet, L. A comparison of computational models for eukaryotic cell shape and motility. PLoS Comput Biol. 8, e1002793 (2012).
- (17) Marée, A.F., Jilkine, A., Dawes, A., Grieneisen, V.A. Edelstein-Keshet L. Polarization and movement of keratocytes: a multiscale modelling approach. Bull Math Biol. 68, 1169-211 (2006).
- (18) Mori, Y., Jilkine, A. Edelstein-Keshet, L. Wave-pinning and cell polarity from a bistable reaction-diffusion system. Biophys J. 94, 3684-97 (2008).
- (19) Satulovsky, J., Lui, R. Wang, Y.L. Exploring the control circuit of cell migration by mathematical modeling. Biophys J 94, 3671-3683 (2008).
- (20) Doubrovinski, K. Kruse, K. Cell motility resulting from spontaneous polymerization waves. Phys Rev Lett. 107, 258103 (2011).
- (21) Nishimura, S.I., Ueda, M. Sasai, M. Cortical factor feedback model for cellular locomotion and cytofission. PLoS Comput Biol. 5, e1000310 (2009).
- (22) Ziebert, F., Swaminathan, S. Aranson, I.S. Model for self-polarization and motility of keratocyte fragments. J R Soc Interface. 9, 1084-92 (2012).
- (23) Du, X., Doubrovinski, K. Osterfield, M. Self-organized cell motility from motor-filament interactions. Biophys J. 102, 1738-45 (2012).
- (24) Maiuri, P. et al. Actin flows mediate a universal coupling between cell speed and cell persistence. Cell 161, 374-386 (2015).
- (25) Barnhart, E., Kun-Chun, L., Allen, G.M., Theriot, J.A. Mogilner, A. Proc Natl Acad Sci U S A. 112, E5045-50 (2015).
- (26) Lee, J., Ishihara, A., Theriot, J.A. Jacobson, K. Principles of locomotion for simple-shaped cells. Nature. 362, 167-171 (1993).
- (27) Barnhart, E.L., Lee, K.C., Keren, K., Mogilner, A. Theriot, J.A. An adhesion-dependent switch between mechanisms that determine motile cell shape. PLoS Biol. 9, e1001059 (2011).
- (28) Wilson, C.A. et al. Myosin II contributes to cell-scale actin network treadmilling through network disassembly. Nature. 465, 373-377 (2010).
- (29) Wolgemuth, C.W., Stajic, J. Mogilner, A. Redundant mechanisms for stable cell locomotion revealed by minimal models. Biophys J. 101, 545–53 (2011).
- (30) Lou, S.S., Diz-Munoz, A., Weiner, O.D., Fletcher, D.A. Theriot, J.A. Myosin light chain kinase regulates cell polarization independently of membrane tension or Rho kinase. J. Cell Biol. 209 275-288 (2015).
- (31) Ambühl, M.E., Brepsant, C., Meister, J.-J., Verkhovsky, A.B. Sbalzarini, I.F. High-resolution cell outline segmentation and tracking from phase-contrast microscopy images. J Microsc. 245, 161-170.
- (32) Grimm, H.P., Verkhovsky, A.B., Mogilner, A. Meister J.-J. Analysis of actin dynamics at the leading edge of crawling cells: implications for the shape of keratocyte lamellipodia. Eur Biophys J. 32, 563-577 (2003).
- (33) Schaub, S., Bohnet, S., Laurent, V.M., Meister, J.-J. Verkhovsky, A.B. Comparative maps of motion and assembly of filamentous actin and myosin II in migrating cells. Mol Biol Cell 18, 3723-3732 (2007).
- (34) Gabella, C. et al. Contact angle at the leading edge controls cell protrusion rate. Curr Biol. 24, 1126-1132 (2013).
- (35) Martin, S.G. Microtubule-dependent cell morphogenesis in the fission yeast. Trends in Cell Biol. 19, 447-454 (2009).
- (36) Picone, R. et al. A polarised population of dynamic microtubules mediates homeostatic length control in animal cells. PLos Biol. 8, e1000542 (2010).
- (37) Fouchard, J. et al. Three-dimensional cell body shape dictates the onset of traction force generation and growth of focal adhesions. Proc Natl Acad Sci USA. 111,13075–13080 (2014)
- (38) Schweizer, J. et al. Geometry sensing by self-organized protein patterns. Proc Natl Acad Sci USA. 109, 15283-8 (2012).
- (39) Pollard, T.D. Regulation of actin filament assembly by Arp2/3 complex and formins. Annu Rev Biophys Biomol Struct. 36, 451-77 (2007).
IV Acknowledgements
We would like to thank F. Nédélec and M. Balland for useful discussions, S. Bohnet for the first observation of cell rotation, and H. Troyon for experimental assistance. This work is supported by Swiss National Science Foundation Grant 31003A-135661. M.E.A. was funded by a PhD fellowship from the Swiss National Competence Center for Biomedical Imaging, to A.V. and I.F.S.
V Author contributions
F.R. and A.B.V. designed the study, M.E.A., C.G., A.B. and A.B.V. performed the experiments, F.R. and M.E.A. analysed the data, F.R. developed the numerical model, F.R., I.F.S. and A.B.V. wrote the paper. All authors have discussed the results and the interpretation. F.R. and M.E.A. have contributed equally to the study.