Quantitative separation of the anisotropic magnetothermopower and planar Nernst effect by the rotation of an in-plane thermal gradient
Abstract
A thermal gradient as the driving force for spin currents plays a key role in spin caloritronics. In this field the spin Seebeck effect (SSE) is of major interest and was investigated in terms of in-plane thermal gradients inducing perpendicular spin currents (transverse SSE) and out-of-plane thermal gradients generating parallel spin currents (longitudinal SSE). Up to now all spincaloric experiments employ a spatially fixed thermal gradient. Thus anisotropic measurements with respect to well defined crystallographic directions were not possible. Here we introduce a new experiment that allows not only the in-plane rotation of the external magnetic field, but also the rotation of an in-plane thermal gradient controlled by optical temperature detection. As a consequence, the anisotropic magnetothermopower and the planar Nernst effect in a permalloy thin film can be measured simultaneously and reveal a phase shift, that allows the quantitative separation of the thermopower, the anisotropic magnetothermopower and the planar Nernst effect.
Adding the spin degree of freedom to conventional charge-based electronics opens the field of spintronics Wolf:2001 ; Hoffmann:2015 with promising advantages such as decreased electric power consumption and increased integration densities. While spinelectronics use only voltages as driving force for currents, thermal gradients and the interaction between spins and heat currents have already been shown to provide new effects. Spin caloritronics investigate these interactions and promotes the search for applications such as heat sensors or waste heat recyclers Bauer:2012 ; Boona:2014 , that can improve thermoelectric devices.
One of the most important and well established phenomena in spin caloritronics is the longitudinal spin Seebeck effect (LSSE) Uchida:2010a ; Uchida:2014 ; Uchida:2010b ; Weiler:2012 ; Meier:2013a ; Qu:2013 ; Kikkawa:2013 , which uses typically out-of-plane thermal gradients in magnetic thin films for the generation of a spin current parallel to the thermal gradient. This pure spin current is then injected into an adjacent non-magnetic conductor with high spin-orbit coupling, e.g. Pt, which transforms the spin current into an electric voltage via the inverse spin Hall effect (ISHE). In very recent investigations, the LSSE was even detected without any Pt and ISHE by the use of the anomalous Hall effect in Au Hou:2016 and by time-resolved magnetooptic Kerr effect in Au and Cu Kimmling:2016 .
Besides the application of an out-of-plane thermal gradient, effects driven by in-plane thermal gradients were also investigated. The transverse spin Seebeck effect (TSSE), the spin current generation perpendicular to an in-plane thermal gradient, was reported for metals Uchida:2008 , semiconductors Jaworski:2010 and insulators Uchida:2010c . However, it has been noted that TSSE experiments in metals and semiconductors can be influenced by parasitic effects like the planar Nernst effect (PNE) Ky:1966b or the anomalous Nernst effect (ANE) Nernst:1886 . The first occurs in samples with magnetic anisotropy Avery:2012 , while the latter can be attributed to unintended out-of-plane temperature gradients Huang:2011 due to heat flux into the surrounding region Schmid:2013 or through the electric contacts Meier:2013b . Recently, the influence of inhomogeneous magnetic fields was added to the list of uncertainties for TSSE experiments Shestakov:2015 . Despite first reports, the TSSE could not be reproduced neither for metals Avery:2012 ; Huang:2011 ; Schmid:2013 ; Meier:2013b ; Shestakov:2015 ; Bui:2014 , for semiconductors Soldatov:2014 nor insulators Meier:2015 .
Closely related to the recently reported spin Hall magnetoresistance (SMR) Nakayama:2013 ; Chen:2013 ; Vlietstra:2013 ; Althammer:2013 are magnetothermopower effects that were detected in bilayers of nonmagnetic conductors/ferromagnetic insulators Meier:2015 ; Meyer:2016 . In the first case an in-plane electric current is driven through a conductor with high spin-orbit coupling (e.g. Pt) deposited on a magnetic insulator. The interplay of the spin Hall effect (SHE) and the ISHE induces an anisotropic electric resistance in the conductor depending on the relative orientation between the spin polarization of the normal metal and the magnetization of the magnetic insulator. Whereas the SMR uses an electric potential to inject the charge current, the so-called spin Nernst magnetothermopower is driven by an in-plane thermal gradient and can be described by the recently discovered spin Nernst effect Meyer:2016 in combination with the ISHE. Hints of these effects were already observed as side-effects in experiments using heatable electric contact tips Meier:2015 . This is another example for the use of in-plane thermal gradients in spin caloritronics. However, the in-plane thermal gradients used so far are spatially fixed.
Different techniques to apply thermal gradients include Joule heating in an external heater Uchida:2008 ; Meier:2013a , laser heating Walter:2011 ; Weiler:2012 , Peltier heating Uchida:2010a ; Schmid:2013 ; Shestakov:2015 , current-induced heating in the sample Schreier:2013 , heating with electric contact needles Meier:2013b ; Meier:2015 and on-chip heater devicesWu:2015 . In this work we present a setup, which uses Peltier heating as a method for heating and cooling purposes to cover a larger working temperature range. As a key feature, this setup allows the in-plane rotation of a thermal gradient and, thus, also the angle-dependent investigation of the anisotropic magnetothermopower (AMTP) and planar Nernst effect (PNE). The use of an infrared camera optically resolves the rotation of .
In order to demonstrate the functionality of the setup, we will concentrate on the electric characterization of magnetothermopower effects, which can be measured under different angles of . In analogy to the description of the anisotropic magnetoresistance, one can derive similar equations for magnetothermopower effects (supplementary informations (SI) chapter I). The setup of our experiment and the definition of the directions of , and the external magnetic field with respect to the coordinates are sketched in Fig. 1 (a). When a temperature gradient is applied, its y-component will generate a longitudinal AMTP and thus an electric field in the y-direction. This longitudinal AMTP can be described by
| (1) |
with , and , beeing the Seebeck coefficients of the thermopower parallel and perpendicular to , respectively. originates from the ordinary, magnetic field independent thermovoltage whereas describes the magnetic field dependent part of the AMTP. and are the angles of the external magnetic field and , respectively, with respect to the x-axis as defined in Fig. 1(a). The transverse magnetothermopower also contributes to but is driven by and will be denoted as the PNE, which is determined by
| (2) |
Summing up the AMTP and PNE contributions in the y-direction, we end up with
| (3) |
Thus, the angle of the thermal gradient acts as a phase shift for the magnetization dependent part of the thermopower.
In Sec. I, the functionality of the setup is briefly explained and the measurement modes are introduced. In Sec. II, the setup is used to characterize the AMTP and the PNE in thin Ni80Fe20 (Py) films in dependence of the rotation angle of . Increasing leads to a phase shift in and Eqs. (1), (2) are used to split the superimposed voltage signals into the contributions of the AMTP and PNE. This enables a determination of the Seebeck coefficients parallel and perpendicular to the magnetization of the sample.
I Experimental setup
The setup realizes an in-plane rotation of by four independently heated sample holders (Fig. 1(a)). The sample is clamped in the center of the sample holders and the application of different x and y temperature differences leads to a superpositioned net thermal gradient along . Four electromagnets arranged as shown in Fig. 1 (a) additionally provide a rotatable in-plane magnetic field along . All electric measurements were conducted along the y axis of a sputter deposited Py thin film (5x5 mm2, 18 nm thick) on MgO(001). To reduce parasitic effects due to symmetrically out-of-plane , the heat is transferred into the sample using an upper and a lower half of the sample holder (Fig. 1(b)). This was already used in previous setups Meier:2013b ; Meier:2015 and could successfully reduce unintended out-of-plane thermal gradients. PT1000 elements are glued at the backsides of each sample holder to detect the temperatures of the sample holders.
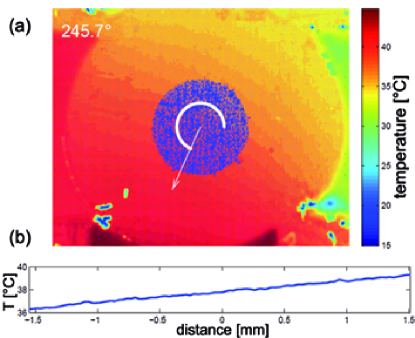
The successful rotation of is proven by an infrared camera, which clearly resolves the rotation of for different substrates and enables a quantitative analysis of the temperature profiles (see SI chapter II, with Ref. [Thomson:1857, ; thompson:1975, ; lang:1992, ]). Figure 2 (a) shows a thermographic picture of a Cu substrate with applied along . After defining a Region of Interest (ROI, blue circle) the average angle of within the ROI can be calculated, symbolized by the white arc. Here, a deviation of the applied angle and the calculated angle of is detected. Taking a relative rotation between the setup and the camera by 2∘ into account, a mismatch of 4∘ is denoted as the uncertainty of .

In the following, is averaged over five single measurements while the sample was kept at a base temperature of 308 K. When is measured as a function of the external magnetic field , which is varied from -150 Oe up to +150 Oe (black branch of results) and back down to -150 Oe (red branch of results), the measurement mode will be denoted as sweep measurement. When is measured in magnetic saturation as a function of , the field rotation measurement mode was used. Here, the magnetization was kept saturated along the direction of () by using an external magnetic field of , which then was rotated counterclockwise in the x-y plane (Fig. 1(a)).
II Results
II.1 dependence of the PNE
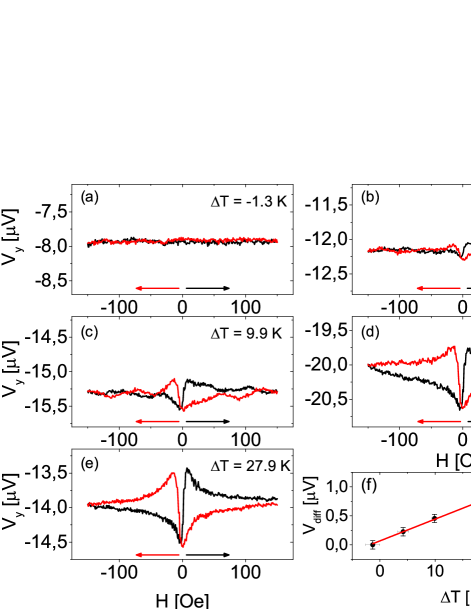
Figure 3 shows sweep measurements of with aligned along . Here, was increased from K to along . Keeping along the x direction and measuring the voltage only in the y direction excludes any AMTP contributions so that in Fig. 3 only shows the PNE. In Fig. 3(a) a very low is applied along the x axis, which is too low to induce a detectable voltage along the y axis. Therefore, only the noise level (nV) can be recorded. Depending on , shows increasing peaks in the low magnetic field regime, and saturates for (Fig. 3(a)-(e)).
A similar experiment was conducted by Meier et al.Meier:2013b , which is in good agreement with the data shown in Fig. 3. Slight deviations of the signal shape can be attributed to different magnetic anisotropies for different samples and small parasitic magnetic fields of the electromagnet due to the interaction of both magnetic axes (see SI chapter III). Starting with the increase of the magnetic field from -150 Oe to +150 Oe, for low negative field values the voltage of the PNE measurement (e.g. Fig. 3(e), black branch) first drops to a minimum voltage, lower than the saturation voltage, before it rises to a maximum value above the saturation voltage. Only then it decreases and saturates again. While decreasing the magnetic field after its maximum (red branch), again first the development of a minimum and then of a maximum is observed, before the voltage approaches the initial saturation value.
For verifying the temperature dependence of the PNE, the peak-to-peak height in the low magnetic field regime is chosen as an indication of the PNE strength. The peak-to-peak height is quantified by , calculating the voltage difference between the maximum and minimum voltage for each branch and averaging them. Fig. 3(f) shows vs. . This correlation can be fitted linearly and therefore confirms the proportionality to , as can be seen in Eq. (2).
II.2 angular dependence of the PNE
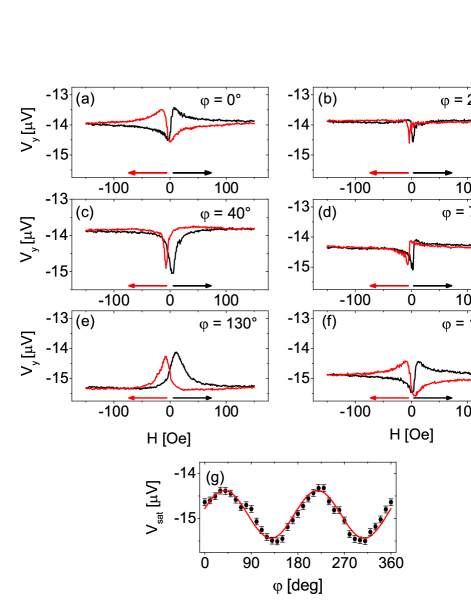
Next, the sample was kept at a constant temperature difference of , so the cold side was kept at K and the hot side at K. Sweep measurements were recorded for and six exemplary chosen curves in the range of are shown in Fig. 4 (a)-(f). As before, saturates for high magnetic fields but shows differently shaped extrema, depending on . Fig. 4 (a) shows the same data set as Fig. 3 (e) with the appearance of a minimum and a maximum. Increasing to 20∘ (Fig. 4 (b)) changes the signal at the low magnetic regime into a minimum for both branches with low intensity but similar shape. For (Fig. 4 (c)) the intensity of these minima increases until for (Fig. 4 (d)) the curves have changed their shape into a minimum and maximum again. But in contrast to Fig. 4(a) both branches have the same progression, thus, the magnetization reversal process is independent of the sweep direction of the magnetic field. For (Fig. 4 (e)) large, clearly separated maxima can be observed, which, in case of (Fig. 4 (f)), form a similar curve as for . For angles larger than the curves from the range are repeated.
The small signals of both branches for indicate magnetic easy axes in these directions Meier:2013b . The appearance of two magnetic easy axes tilted by 50∘ can be explained by the non-parallel superposition of a uniaxial and a cubic magnetic anisotropy (see SI chapter III including Refs. [Chen:1992, ; Park:1995, ; Daboo:1995, ; Kaibi:2015, ; Li:2015, ; Florczak:1991, ; Zhan:2007, ; Zhan:2009b, ; Zhan:2009, ; Kuschel:2011, ; Kuschel:2012, ]). Furthermore, the experimental data can be fully understood and explained by simulations based on the Stoner-Wohlwarth model taking the geometry of the electromagnets into account (Fig. 5, see SI chapter III including Refs. [AMTEP2, ; AMTEP3, ; gurevich, ; UMA-CMA2, ; demag, ; CMAK, ; UMAK, ; mumax3, ]). The signals for = 20∘, 70∘ are the same in the simulations (Fig. 5 (b),(d)), whereas in the experiment they are not. Furthermore, the experiment observes a larger shift between the up and down trace, but beside of the mentioned issues, the simulations fit the experimental data qualitatively well.

Meier et al. Meier:2013b split the curves into a symmetric and antisymmetric part. A systematically observed antisymmetric part would indicate an ANE induced by an unintended out-of-plane . Using this method for the data from Fig. 4 does not show any systematic dependence of the antisymmetric contribution on the direction of the external magnetic field as it would be the case for the ANE. Therefore, we can exclude any unintended out-of-plane for the new setup, as we could for our other thermal setups Meier:2013b ; Meier:2015 . The small non-systematic antisymmetric contributions can rather be explained by a non-perfect antisymmetric magnetization reversal process for some magnetic field directions due to an interplay of the magnetic anisotropy and field contributions mentioned in the SI chapter III.
Not only the shape of the curves but also the saturation voltage depends on . All saturation voltages for Oe of each were averaged, plotted vs. and after subtraction of a linear temperature drift, shows a clear sin2 dependence (Fig. 4(g)). oscillates around an offset voltage of V, which originates from the ordinary thermovoltage, which is described in Eq. (1) by . Small deviations of to the fit can be found around , but an analysis of reveals no systematical higher order measurement artefacts. Since the oscillation of Fig. 4(g) confirms the dependence as predicted for the PNE by Eq. (2), further measurements in the rotation measurement mode for different are conducted to track down the PNE.
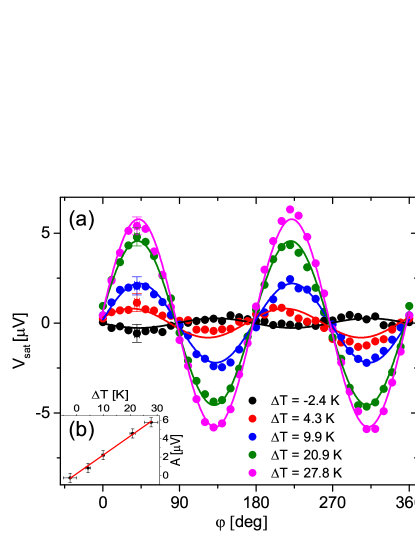
Five measurements were conducted for each , averaged and plotted in Fig. 6 (a). All curves show the expected oscillation so that based on Eq. (2) the data were fitted by , very well confirming the agreement between the data and the theory of the PNE. Furthermore, plotting the amplitude of the fits vs. again shows the expected proportionality between the PNE and (Fig. 6 (b)).
II.3 Phase shift of angular dependence of the AMTP and PNE
Next, the angle of the thermal gradient, , was continuously increased by 15∘ and sweep measurements were conducted for . Each curve again shows a saturation voltage for high magnetic fields and two extrema close to each other at around 0 Oe (Fig. 7(a)-(f)). In case of (a) the voltage measurement is carried out perpendicular to the thermal gradient, thus, the signal originates from the PNE ()). In case of (c) the voltage measurement is conducted parallel to the thermal gradient because it was rotated to . Here, the voltage signal is attributed purely to the AMTP, since this effect needs a longitudinal ).
The results for consist of a superposition of the PNE and the AMTP since for these , consists of a x and y component. This qualitative change in the signal can also be seen in the voltage features for low magnetic fields. Fig. 7(a) shows the same signal progression as described in section B, with the formation of a minimum before crossing 0 Oe. Increasing now suppresses this minimum before the zero crossing point until for only two sharp maxima are shaped. Due to the rotation of the relative orientation of with respect to changes for different , thus, leading to changing contributions of the PNE and AMTP to the measured voltage signal. Again, the trace of the voltage signal can be fairly simulated as can be seen in Fig. 8.
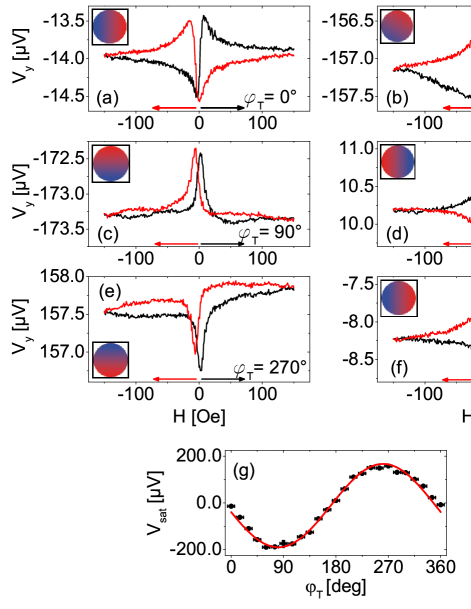
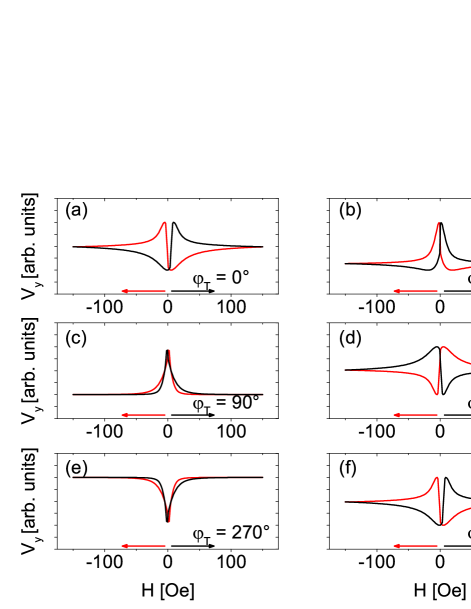
Figure 7(g) shows the saturation voltages of Fig. 7(a)-(f) vs. . In contrast to Fig. 4(g), where the oscillation of is only due to the PNE, Fig. 7(g) identifies the contribution of the ordinary, magnetic field independent Seebeck effect , expressed by in Eq. (1). Since is measured, the rotation of leads to a shaped projection of on the y axis, resulting in a sine shaped signal. The nonmagnetic Seebeck signal is three orders of magnitude higher than the one of the PNE, while the magnetic field dependent part of the AMTP is expected to be of the same order of magnitude than the PNE.
For the direct comparison of the different AMTP and PNE contributions, rotation measurements for were conducted. Fig. 9(a) shows rotation measurements for three different , with offset voltages substracted. As described above, the oscillating signal of at originates purely from the PNE and the oscillation of purely from the AMTP. Since for all in between we obtain a superimposed signal of both, the rotation measurements for all were fitted with
| (4) | ||||
| with | ||||
| (5) | ||||
| (6) | ||||
| (7) | ||||
based on Eqs. (1), (2). Here, the fit parameters and indicate the amplitudes of the PNE and AMTP, respectively. is the distance of the electric contacts and is the offset in , which mirrors the ordinary Seebeck effect expressed as . When is plotted vs. , Fig. 9(a) shows the superposition of both effects, which leads to a phase shift of the measured signal for , described by Eq. (3). The dependence (for ), expected for the PNE (Eq. (2)) is shifted to a dependence (for ), predicted for the AMTP (Eq. (1)).

In addition to the detected phase shift in the resulting signal, the change of the PNE (AMTP) ratio for each can be revealed by plotting the fit amplitude () vs. (Fig. 9(b)). The result clearly shows a cosine (PNE) and a sine (AMTP) dependence of the amplitudes on as determined by Eqs. (5), (6). The resulting cosine and sine fit functions result in a PNE amplitude of and an AMTP amplitude of (. Within the measurement uncertainty the absolute value of the magnitudes of both effects are the same as it was expected from Eqs. (5), (6). Additional to the amplitudes, plotting vs. gives a sine function as Eq. (7) predicts.
With these findings we can determine the thermovoltages and . Averaging the absolute values of the amplitudes of and results in
| (8) |
and the amplitude of gives
| (9) |
With the same and , Eqn. (8) and (9) are used to calculate the relative change of the anisotropic Seebeck coefficient
| (10) | ||||
| (11) |
This calculation shows that the magnetothermopower perpendicular to the magnetization is stronger than parallel to the magnetization. The rotation of was used to sucessfully seperate PNE from AMTP measurements, which is observed by the subsequent shift of a sin- to a cos-dependence of the magnetic field rotation measurement.
III Conclusion
In conclusion, a novel setup was realized, which allows a well-defined rotation of an in-plane thermal gradient by superposition of two perpendicular thermal gradients of variable strength. Thus, the simultaneous measurement of the AMTP and PNE is made possible. The functionality of the setup was demonstrated and analyzed by an infrared camera and could further be verified by the subsequent electric analysis of magnetothermopower effects in a permalloy thin film on MgO(001). First, the proportionality dependency of the PNE to the temperature difference was shown. Second, a sweep of the external magnetic field was conducted for different angles and spatial fixed , showing a repetition of the voltage signal for angles larger than 180∘. Plotting the saturation voltages vs. the magnetic field angle shows a dependency, verifying the theoretical predictions. By only rotating a high magnetic field, these oscillations can be measured directly. Measuring them for rotated leads to a phase shift until for the oscillation of the magnetic field angular dependence is shifted to a oscillation. This shift is due to a superposition of the PNE and AMTP and is the proof for a successful and controlled rotation of . It further enables the splitting of the measured signal into dependent contributions of the PNE, AMTP and ordinary Seebeck effect. This allows us to estimate the thermovoltages parallel and perpendicular to the magnetization using Eqs. (8), (9) to
and
resulting in a relative magnitude of the anisotropic magnetothermopower of .
After proving the rotation of with respect to the crystal structure, this setup is a promising tool to establish this method in future spin caloric experiments such as detailed anisotropy investigations of the spin Nernst magnetothermopower.
Acknowledgements.
The authors gratefully acknowledge financial support by the Deutsche Forschungsgemeinschaft (DFG) within the priority program Spin Caloric Transport (SPP 1538).Author contributions
O. R., M. B., and T. K. designed the experimental setup with the input of D. M., L. H., J.-O. D., J.-M. S., A. H., and G.R.; O. R. prepared and characterized the sample with the help of J. K. and performed the measurements; A. S. performed the theoretical simulations with the input of O. R. and T. K. in collaboration with C. B.; O. R. and T. K. analyzed the data and wrote the manuscript with the input of all authors.
Additional information
Competing financial interests: The author declare no competing financial interests.
Correspondence: All correspondence shall be directed to oreimer@physik.uni-bielefeld.de.
References
- (1) S. A. Wolf, D. D. Awschalom, R. A. Buhrman, J. M. Daughton, S. von Molná, M. L. Roukes, A. J. Chtchelkanova, D. M. Treger, Spintronics: a spin-based electronics vision for the future, Science 294, 1488 (2001).
- (2) A Hoffmann, S. D. Bader, Opportunities at the Frontiers of Spintronics, Phys. Rev. Applied 4, 047001 (2015).
- (3) G. E. W. Bauer, E. Saitoh, B. J. van Wees, Spin caloritronics, Nat. Mater. 11, 391 (2012).
- (4) S. R. Boona, R. C. Myers, J. P. Heremans, Spin caloritronics, Energy Environ. Sci. 7, 885 (2014).
- (5) K. Uchida, H. Adachi, T. Ota, H. Nakayama, S. Maekawa, E. Saitoh, Observation of longitudinal spin-Seebeck effect in magnetic insulators, Appl. Phys. Lett. 97, 172505 (2010).
- (6) K. Uchida, M. Ishida, T. Kikkawa, A. Kirihara, T. Murakami, E. Saitoh, Longitudinal spin Seebeck effect: from fundamentals to applications, J. Phys.: Condens. Matter 26, 343202 (2014).
- (7) K. Uchida, T. Nonaka, T. Ota, E. Saitoh, Longitudinal spin-Seebeck effect in sintered polycrystalline (Mn,Zn)Fe2O4, Appl. Phys. Lett. 97, 262504 (2010).
- (8) M. Weiler, M. Althammer, F. D. Czeschka, H. Huebl, M. S. Wagner, M. Opel, I.-M. Imort, G. Reiss, A. Thomas, R. Gross, S. T. B. Goennenwein, Local Charge and Spin Currents in Magnetothermal Landscapes, Phys. Rev. Lett. 108, 106602 (2012).
- (9) D. Meier, T. Kuschel, L. Shen, A. Gupta, T. Kikkawa, K. Uchida, E. Saitoh, J.-M. Schmalhorst, G. Reiss, Thermally driven spin and charge currents in thin NiFe2O4 /Pt films, Phys. Rev. B 87, 054421 (2013).
- (10) D. Qu, S. Y Huang, J. Hu, R. Wu, C.-L. Chien, Intrinsic Spin Seebeck Effect in Au/YIG, Phys. Rev. Lett. 110, 067206 (2013).
- (11) T. Kikkawa, K. Uchida, Y. Shiomi, Z. Qiu, D. Hou, D. Tian, H. Nakayama, X. F. Jin, E. Saitoh, Longitudinal Spin Seebeck Effect Free from the Proximity Nernst Effect, Phys. Rev. Lett. 110, 067207 (2013).
- (12) D. Hou, Z. Qiu, R. Iguchi, K. Sato, E.K. Vehstedt, K. Uchida, G.E.W. Bauer, E. Saitoh, Observation of temperature-gradient-induced magnetization, Nat. Commun. 7, 12265 (2016)
- (13) J. Kimmling, G.-M. Choi, J. T. Brangham, T. Matalla-Wagner, T. Huebner, T. Kuschel, F. Yang, D. G. Cahill, Picosecond spin Seebeck effect, arXiv: 1608.00702 (2016)
- (14) K. Uchida, S. Takahashi, K. Harii, J. Ieda, W. Koshibae, K. Ando, S. Maekawa, E. Saitoh, Observation of the spin Seebeck effect, Nature 455, 778 (2008).
- (15) C. M. Jaworski, J. Yang, S. Mack, D. D. Awschalom, J. P. Heremans, R. C. Myers, Observation of the spin-Seebeck effect in a ferromagnetic semiconductor, Nat. Mater. 9, 898 (2010).
- (16) K. Uchida, J. Xiao, H. Adachi, J. Ohe, S. Takahashi, J. Ieda, T. Ota, Y. Kajiwara, H. Umezawa, H. Kawai, G. E. W. Bauer, S. Maekawa, E. Saitoh, Spin Seebeck insulator, Nat. Mater. 9, 894 (2010).
- (17) V. D. Ky, The Planar Nernst Effect in Permalloy Films, Phys. Status Solidi B 17, K207 (1966).
- (18) A. von Ettingshausen, W. Nernst, Ueber das Auftreten electromotorischer Kraefte in Metallplatten, welche von einem Wärmestrome durchflossen werden und sich im magnetischen Felde befinden, Ann. Phys. Chem. 265, 343 (1886).
- (19) A. D. Avery, M. R. Pufall, B. L. Zink, Observation of the Planar Nernst Effect in Permalloy and Nickel Thin Films with In-Plane Thermal Gradients, Phys. Rev. Lett. 109, 196602, (2012).
- (20) S. Y. Huang, W. G. Wang, S. F. Lee, J. Kwo, C.-L. Chien, Intrinsic Spin-Dependent Thermal Transport, Phys. Rev. Lett. 107, 216604 (2011).
- (21) M. Schmid, S. Srichandan, D. Meier, T. Kuschel, J.-M. Schmalhorst, M. Vogel, G. Reiss, C. Strunk, C. H. Back, Transverse Spin Seebeck Effect versus Anomalous and Planar Nernst Effects in Permalloy Thin Films, Phys. Rev. Lett. 111, 187201 (2013).
- (22) D. Meier, D. Reinhardt, M. Schmid, C. H. Back, J.-M. Schmalhorst, T. Kuschel, G. Reiss, Influence of heat flow directions on Nernst effects in Py/Pt bilayers, Phys. Rev. B 88, 184425 (2013).
- (23) A. S. Shestakov, M. Schmid, D. Meier, T. Kuschel, C. H. Back, Dependence of transverse magnetothermoelectric effects on inhomogeneous magnetic fields, Phys. Rev. B 92, 224425 (2015).
- (24) C. T. Bui, F. Rivadulla, Anomalous and planar Nernst effects in thin films of the half-metallic ferromagnet La2/3Sr1/3MnO3, Phys. Rev. B 90, 100403 (2014).
- (25) I. V. Soldatov, N. Panarina, C. Hess, L. Schultz, R. Schäfer, Thermoelectric effects and magnetic anisotropy of Ga1-xMnxAs thin films, Phys. Rev. B 90, 104423 (2014).
- (26) D. Meier, D. Reinhardt, M. van Straaten, C. Klewe, M. Althammer, M. Schreier, S. T. B. Goennenwein, A. Gupta, M. Schmid, C. H. Back, J.-M. Schmalhorst, T. Kuschel, G. Reiss, Longitudinal spin Seebeck effect contribution in transverse spin Seebeck effect experiments in Pt/YIG and Pt/NFO, Nat. Commun. 6, 8211 (2015).
- (27) H. Nakayama, M. Althammer, Y.-T. Chen, K. Uchida, Y. Kajiwara, D. Kikuchi, T. Ohtani, S. Gepraägs, M. Opel, S. Takahashi, R. Gross, G. E. W. Bauer, S. T. B. Goennenwein, E. Saitoh, Spin Hall Magnetoresistance Induced by a Nonequilibrium Proximity Effect, Phys. Rev. Lett. 110, 206601 (2013).
- (28) Y.-T. Chen, S. Takahashi, H. Nakayama, M. Althammer, S. T. B. Goennenwein, E. Saitoh, G. E. W. Bauer, Theory of spin Hall magnetoresistance, Phys. Rev. B 87, 144411 (2013).
- (29) N. Vlietstra, J. Shan, V. Castel, B. J. van Wees, J. Ben Youssef, Spin-Hall magnetoresistance in platinum on yttrium iron garnet: Dependence on platinum thickness and in-plane/out-of-plane magnetization, Phys. Rev. B 87, 184421 (2013).
- (30) M. Althammer, S. Meyer, H. Nakayama, M. Schreier, S. Altmannshofer, M. Weiler, H. Huebl, S. Geprägs, M. Opel, R. Gross, D. Meier, C. Klewe, T. Kuschel, J.-M. Schmalhorst, G. Reiss, L. Shen, A. Gupta, Y.-T. Chen, G. E. W. Bauer, E. Saitoh, S. T. B. Goennenwein, Quantitative study of the spin Hall magnetoresistance in ferromagnetic insulator/normal metal hybrids, Phys. Rev. B 87, 224401 (2013).
- (31) S. Meyer, Y.-T. Chen, S. Wimmer, M. Althammer, S. Geprägs, H. Huebl, D. Ködderitzsch, H. Ebert, G. E. W. Bauer, R. Gross, S. T. B. Goennenwein, Observation of the spin Nernst effect, arXiv: 1607.02277 (2016).
- (32) M. Walter, J. Walowski, V. Zbarsky, M. Münzenberg, M. Schäfers, D. Ebke, G. Reiss, A. Thomas, P. Peretzki, M. Seibt, J. S. Moodera, M. Czerner, M. Bachmann, and C. Heiliger, Seebeck effect in magnetic tunnel junctions, Nat. Mater. 10, 742 (2011)
- (33) M. Schreier, N. Roschewsky, E. Dobler, S. Meyer, H. Huebl, R. Gross, S. T. B. Goennenwein, Current heating induced spin Seebeck effect, Appl. Phys. Lett. 103, 242404 (2013).
- (34) S. M. Wu, F. Y. Fradin, J. Hoffman, A. Hoffmann, A. Bhattacharya, Spin Seebeck devices using local on-chip heating, J. Appl. Phys. 117, 17C509 (2015).
- (35) W. Thomson, On the electro-dynamic qualities of metals: effects of magnetization on the electric conductivity of nickel and of iron, Proc. Royal Soc. London 8, 546 (1857)
- (36) D. A. Thompson, L . T. Romankiw, A. F. Mayadas, Thin Film Magnetoresistors in Memory, Storage, and Related Application, IEEE Trans. Mag. 11, 1039 (1975)
- (37) W. Lang, K. Kühl, H. Sandmaier, Absorbing layers for thermal infrared detectors, Sensors and Actuators A 34, 243 (1992)
- (38) J. Chen, J. L. Erskine, Surface-step-induced magnetic anisotropy in thin epitaxial Fe films on W(001), Phys. Rev. Lett. 68, (1992)
- (39) Y. Park, E. E. Fullerton, S. D. Bader, Growth‐induced uniaxial in‐plane magnetic anisotropy for ultrathin Fe deposited on MgO(001) by oblique‐incidence molecular beam epitaxy, Appl. Phys. Lett. 66, 2140 (1995), Appl. Phys. Lett. 66, 2140 (1995)
- (40) C. Daboo, R. J. Hicken, E. Gu, M. Gester, S. J. Gray, D. E. P. Eley, E. Ahmad, J. A. C. Bland, R. Ploessl, J. N. Chapman, Anisotropy and orientational dependence of magnetization reversal processes in epitaxial ferromagnetic thin films, Phys. Rev. B 51, 15964 (1995)
- (41) Q. Zhan, S. Vandezande, C. van Haesendonck, Manipulation of in-plane uniaxial anisotropy in Fe∕MgO(001)Fe∕MgO(001) films by ion sputtering, Appl Phys. Lett. 91, 122510 (2007)
- (42) Q. Zhan, S. Vandezande, K. Temst, C. van Haesendonck, Magnetic anisotropies of epitaxial Fe/MgO(001) films with varying thickness and grown under different conditions, New J. Phys. 11, 063003 (2009)
- (43) A. Kaibi, A. Guittoum, R. M. Öksüzoglu, A. M. Yagci, M. Boudissa, M. Kechouane, Structure, microstructure and magnetic properties of Ni75Fe25 films elaborated by evaporation from nanostructured powder, Appl. Surf. Sci. 350 (2015)
- (44) X. Li, X. Sun, J. Wang, Q. Liu, Magnetic properties of permalloy films with different thicknesses deposited onto obliquely sputtered Cu underlayers, J. Magn. Magn. Mater. 377 (2015)
- (45) Q. Zhan, S. Vandezande, K. Temst, C. van Haesendonck, Magnetic anisotropy and reversal in epitaxial Fe/MgO(001) films, Phys. Rev. B 80, 094416 (2009)
- (46) J. M. Florczak, E. D. Dahlberg, Magnetization reversal in (100) Fe thin films, Phys. Rev. B 44, 9338 (1991)
- (47) T. Kuschel, T. Becker, D. Bruns, M. Suendorf, F. Bertram, P. Fumagalli, J. Wollschläger, Uniaxial magnetic anisotropy for thin Co films on glass studied by magnetooptic Kerr effect, J. Appl. Phys. 109, 093907 (2011)
- (48) T. Kuschel, J. Harmle, J. Pištora, K. Saito, S. Bosu, Y. Sakuraba, K. Takanashi, J. Wollschläger, Magnetic characterization of thin Co50Fe50 films by magnetooptic Kerr effect, J. Phys. D: Appl. Phys. 45, 495002 (2012)
- (49) Yong Pu, E. Johnston-Halperin, D.D. Awschalom and Jing Shi, Anisotropic Thermopower and Planar Nernst Effect in Ga1-xMnxAs Ferromagnetic Semiconductors, Phys. Rev. Lett. 97, 036601 (2006).
- (50) V.D. Ky, Planar Hall and Nernst Effect in Ferromagnetic Metals, Phys. Status Solidi 22, 729 (1967).
- (51) A.G. Gurevich and G.A. Melkov, Magnetization oscillations and waves, CRC Press, Inc. (1996).
- (52) T. Kuschel, J. Hamrle, J. Pištora, K. Saito, S. Bosu, Y. Sakuraba, K. Takanashi and J. Wollschläger, Magnetization reversal analysis of a thin B2-type ordered Co50Fe50 film by magnetooptic Kerr effect, J. Phys. D: Appl. Phys. 45, 205001 (2012).
- (53) Amikam Aharoni, Demagnetizing factors for rectangular ferromagnetic prisms, J. Appl. Phys. 83, 3432 (1998)
- (54) L.F. Yin, D.H. Wei, N. Lei, L.H. Zhou, C.S. Tian, G.S. Dong, X.F. Jin, L.P. Guo, Q.J. Jia, and R.Q. Wu, Magnetocrystalline Anisotropy in Permalloy Revisited, Phys. Rev. Lett. 97, 067203 (2006)
- (55) Z. Frait, V. Kamberský, M. Ondris, Z. Málek, On the effective magnetization and uniaxial anisotropy of permalloy films, Czech. J. Phys. B 13, 279 (1963)
- (56) A. Vansteenkiste, J. Leliaert, M. Dvornik, M. Helsen, F. Garcia-Sanchez, B. Van Waeyenberge, The design and verification of MuMax3, AIP Advances 4, 107133 (2014)
- (57) K. Postava, D. Hrabovsky, J. Pistora, A. R. Fert, S. Visnovsky and T. Yamaguchi, Anisotropy of quadratic magneto-optic effects in reflection, J. Appl. Phys. 91, 7293 (2002)