Properties of long-term optical variability of active galactic nuclei with double-peaked broad low-ionization emission lines
Abstract
In this manuscript, we study properties of long-term optical variability of a large sample of 106 SDSS spectroscopically confirmed AGN with double-peaked broad low-ionization emission lines (double-peaked emitters). The long-term optical light curves over 8 years are collected from the Catalina Sky Surveys Data Release 2. And, the Damped Random Walk (DRW) process is applied to describe the long-term variability of the double-peaked emitters. Meanwhile, the same DRW process is applied to long-term optical light curves of more than 7000 spectroscopically confirmed normal quasars in the SDSS Stripe82 Database. Then, we can find that the DRW process determined rest-frame intrinsic variability timescales are about 5.8 and about 4.8 for the double-peaked emitters and for the normal quasars, respectively. The statistically longer intrinsic variability timescales can be confirmed in the double-peaked emitters, after considerations of necessary effects, such as the effects from different distributions of redshift, BH mass and accretion rate between the double-peaked emitters and the normal quasars. Moreover, a radial dependence of accretion rate with larger values of could be an acceptable interpretation of the longer intrinsic variability timescales in the double-peaked emitters. Therefore, there are different intrinsic properties of emission regions between the double-peaked emitters and the normal quasars. The double-peaked emitters can be well treated as an unique subclass of AGN.
keywords:
galaxies:active - galaxies:nuclei - quasars:emission lines - galaxies:seyfert1 Introduction
Variability is one of fundamental characteristics of active galactic nuclei (AGN) (Ulrich, Maraschi & Urry, 1997). To study AGN variability can provide further clues to properties of emission regions of AGN (Rees, 1984; Torricelli-Ciamponi et al., 2000; Hawkins, 2002; Hopkins et al., 2006; Mushotzky et al., 2011). And commonly, there are three characteristic timescales of around days to hundreds of days through accretion physics (Peterson, 2001; Kelly, Bechtold & Siemiginowska, 2009), the light crossing timescale (), the gas orbital timescale () and the accretion disk thermal timescale (),
| (1) |
, where represents black hole (BH) mass, represents distance of emission regions to central engine in unit of ( is the Schwarzschild radius), and means the standard disk viscosity parameter. Therefore, the expected AGN variability timescales strongly connected with accretion physics should sensitively depend on the fundamental parameter of AGN, the BH mass, and on the distance of emission regions to the central black hole. Hence, to study AGN variability could provide further properties of emission regions of AGN.
More recently, the Damped Random Walk (DRW) process (Brockwell & Davis, 2002) (or AutoRegressive process), with two basic parameters of the intrinsic variability timescale and the intrinsic variability amplitude , has been proved to be a preferred modeling process to describe AGN intrinsic variability. Kelly, Bechtold & Siemiginowska (2009) firstly proposed the DRW process to describe the AGN intrinsic variability, and found that the AGN intrinsic variability timescales are consistent with disk orbital or thermal timescales. Kozlowski et al. (2010) provided an improved robust mathematic method to estimate the DRW process parameters, and found that AGN variability could be well modeled by the DRW process. Then, Zu, Kochanek & Peterson (2011) provided a public code of JAVELIN (http://www.astronomy.ohio-state.edu/~yingzu/codes.html#javelin) (Just Another Vehicle for Estimating Lags In Nuclei) based on the method in Kozlowski et al. (2010) to describe the AGN variability by the DRW process. Meanwhile, there are many other reported studies on the AGN variability through the DRW process. MacLeod et al. (2010) modeled the variability of about 9000 spectroscopically confirmed quasars covered in the SDSS (Sloan Digital Sky Survey) Stripe82 region, and found correlations between the AGN parameters and the DRW process determined parameters. Bailer-Jones (2012) proposed an another fully probabilistic method for modeling AGN variability by the DRW process. Andrae, Kim & Bailer-Jones (2013) have shown that the DRW process is preferred to model AGN variability, rather than several other stochastic and deterministic models, by fitted results of long-term variability of 6304 quasars. Zu et al. (2013) have checked that the DRW process provided an adequate description of AGN optical variability across all timescales. Therefore, the DRW process determined parameters from the long-term AGN variability can be well used to check or predict further different properties of different kinds of AGN with probable different intrinsic properties of emission regions.
Among broad line AGN, there is one special kind of AGN, the AGN with double-peaked broad low-ionization emission lines (hereafter, double-peaked emitters). Since the first reported double-peaked emitter of 3C390.3 in 1980s (Stauffer, Schild & Keel, 1983), more and more double-peaked emitters have been reported in Eracleous & Halpern (1994); Strateva et al. (2003); Shen et al. (2011), etc.. And the proposed theoretical model with broad emission lines coming from central accretion disk has been preferred to explain the unique double-peaked broad emission lines (Chen & Halpern, 1989; Eracleous et al., 1995; Flohic & Eracleous, 2008). Long-term variability of a few double-peaked emitters, especially profile variability of the double-peaked broad emission lines, have been reported in Eracleous et al. (1997); Shapovalova et al. (2001); Storchi-Bergmann et al. (2003); Lewis, Eracleous & Storchi-Bergmann (2010); Zhang (2013), etc., and applied to test the accretion disk origin of the double-peaked broad emission lines.
However, there are so far no clear statistic results on the long-term variability properties of double-peaked emitters by the DRW process. As the results in MacLeod et al. (2010); Schmidt et al. (2010); Meusinger, Hinze & de Hoon (2011); Schmidt et al. (2012); Zhang (2014), etc., the public SDSS Stripe82 Database (hereafter, SDSS S82) (Bramich et al., 2008) is the widely used database to study the long-term SDSS AGN variability. However, there are only several double-peaked emitters in the SDSS S82, and it is hard to do statistical research on the long-term variability of a large sample of double-peaked emitters through the SDSS S82. More fortunately, the well-known Catalina Sky Survey (CSS) (Drake et al., 2009) has provided public long-term (over 8 years) light curves of more than 500 million objects from an area of 33000 square degrees. And we can find that hundreds of double-peaked emitters are covered in the CSS. Thus, it is the time to statistically study the long-term variability of a large sample of double-peaked emitters, to check whether are there different properties of emission regions in the double-peaked emitters.
The manuscript is organized as follows. In Section 2, we presented our main results and necessary discussions on long-term variability properties determined by the DRW process for a large sample of double-peaked emitters and a large sample of normal quasars. Then, in Section 3, we gave our final conclusions.
2 Main Results and Discussions
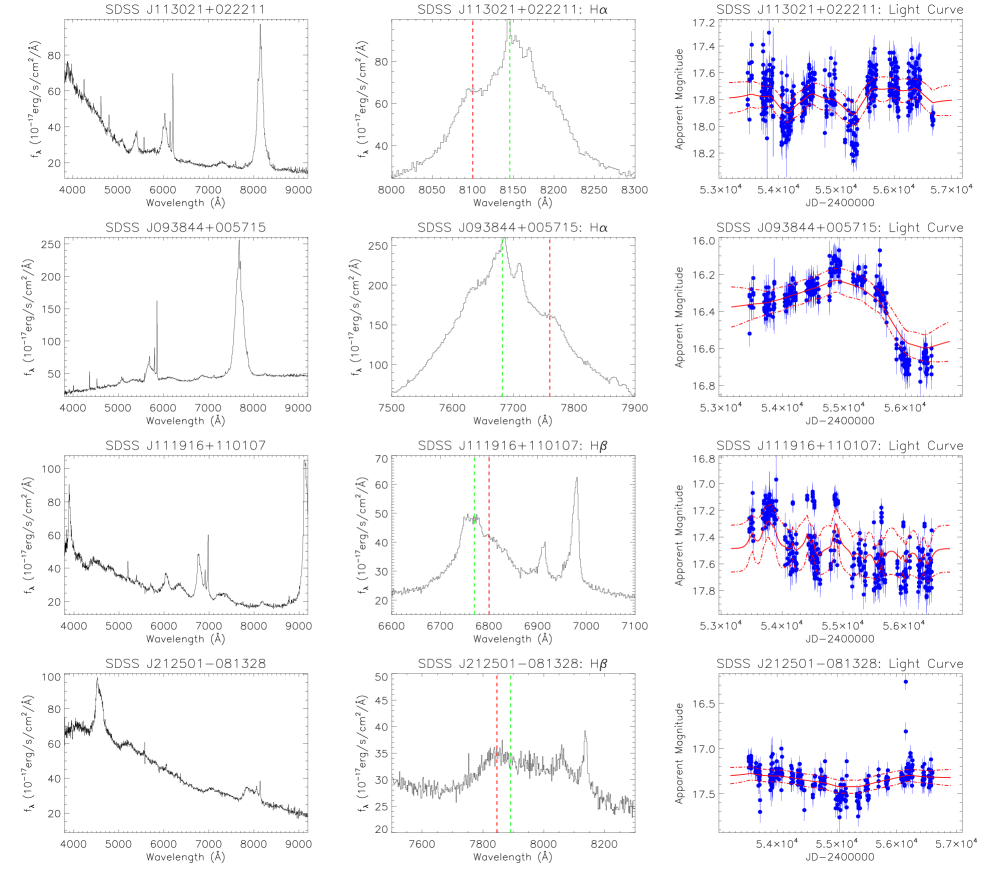
The first large sample of more than 100 double-peaked emitters in SDSS was reported in Strateva et al. (2003). And more recently, the systematically determined large sample of more than 200 double-peaked emitters in SDSS quasars was reported in Shen et al. (2011). In this manuscript, the spectroscopically confirmed double-peaked emitters in Shen et al. (2011) and in Strateva et al. (2003) are collected and created as our main parent sample. Here, the double-peaked emitters are selected from the catalogue of Shen et al. (2011) by the following criterion on the key parameter of : (see http://quasar.astro.illinois.edu/BH_mass/dr7.htm#special_flag).The double-peaked emitters were classified as such by Shen et al. (2011) based on the profile of the Balmer lines. And, in Shen et al. (2011), the selected objects based on the criterion above are called disk emitters with their double-peaked broad emission lines probably expected from central accretion disks. However, we should note that binary black hole model (Gaskell, 1996; Zhang, Dultzin & Wang, 2007) or bipolar outflow model (Zheng, Veilleux & Grandi, 1991) could also lead to double-peaked broad emission lines. Hence, the term ’double-peaked emitters’ rather than the term ’disk emitters’ is used in the manuscript to represent the AGN with double-peaked broad emission lines. Here, we do not show the spectra of all the objects in the parent sample, but SDSS spectra of four double-peaked emitters as examples are shown in the left and the middle panels of Fig. 1.
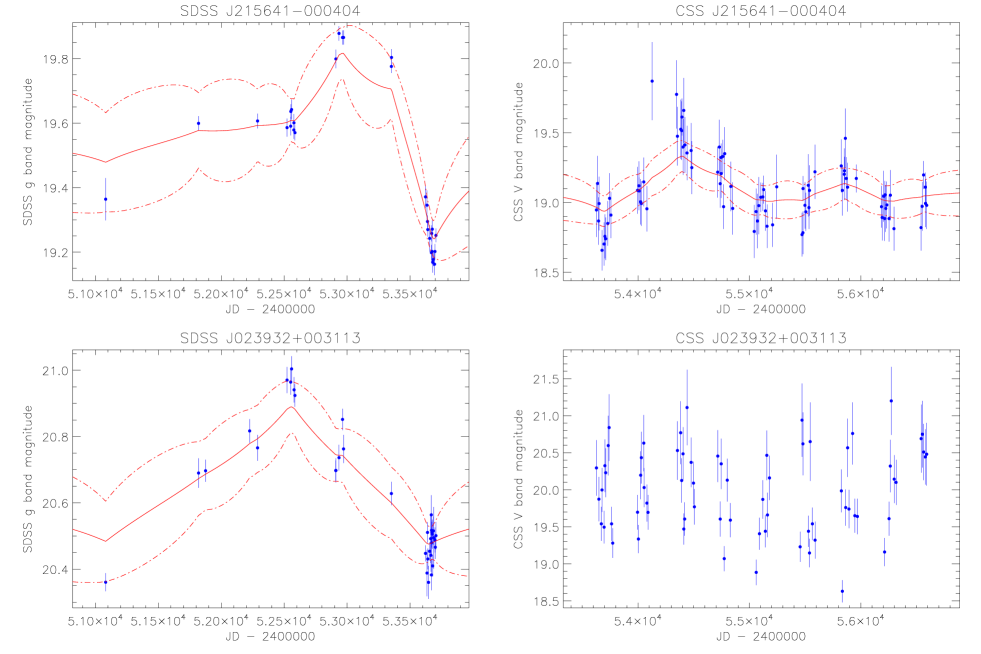
Then, light curves of all the spectroscopically confirmed double-peaked emitters in SDSS (220 objects from Shen et al. (2011) and 116 objects from Strateva et al. (2003)) are searched in the Catalina Sky Surveys Data Release 2 (CSS DR2), with position radius within 1″. There are 256 double-peaked emitters with available light curves provided by the CSS DR2. More detailed descriptions on the instruments and the techniques of CSS can be found in Drake et al. (2009) and in Larson et al. (2003), and in the webpage of http://nesssi.cacr.caltech.edu/DataRelease/. Before listing the double-peaked emitters, further properties of long-term variability should be firstly checked by the DRW process, because light curves of part of objects can not be well described by the DRW process due to large uncertainties (smaller signal-to-noise ratio) of the CSS DR2 provided light curves (see an example shown in the bottom right panel of following Fig. 8).
The public code of JAVELIN provided by Zu, Kochanek & Peterson (2011) and Zu et al. (2013) is applied to describe the CSS DR2 provided long-term variability of the double-peaked emitters based on the DRW process. When the JAVELIN code is applied, through the MCMC (Markov Chain Monte Carlo) analysis with the uniform logarithmic priors of the DRW process parameters of and covering every possible corner of the parameter space ( and ), the posterior distributions of the DRW process parameters can be well determined and provide the final accepted parameters and the corresponding statistical confidence limits. Here, when the JAVELIN is applied, the light curves from the CSS DR2 are firstly re-sampled with one mean value for multiple observations per day. Then, based on the DRW process determined parameters of and at least 5 times larger than the corresponding uncertainties, 106 spectroscopically confirmed double-peaked emitters are finally collected and created as our main sample.
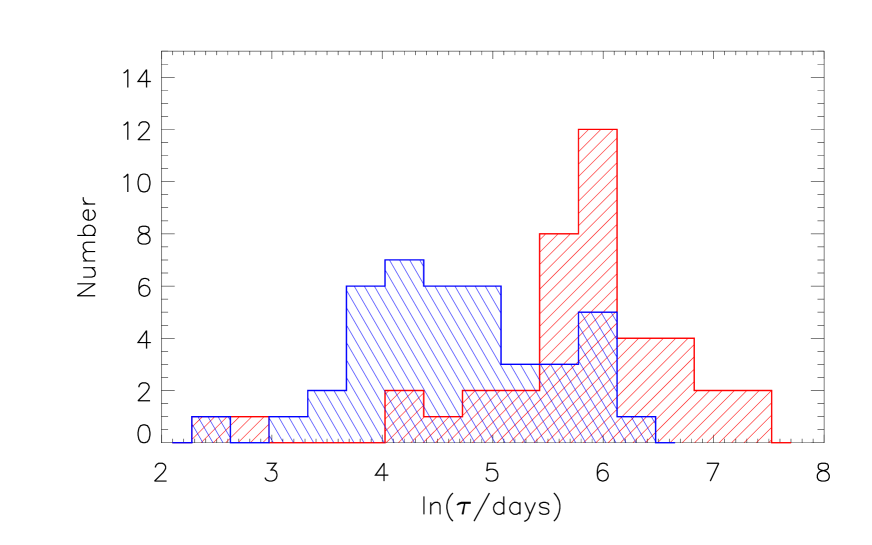
Here, we do not show the SDSS DR2 provided light curves of all the 106 double-peaked emitters, but right panels of Fig. 1 shows four examples on the light curves and the corresponding best fitted results by the DRW process. Table 1 lists the basic parameters of the 106 double-peaked emitters with redshift less than 0.62. Here, the listed values of and are the rest-frame values after considerations of the cosmological time dilation as discussed in Kelly, Bechtold & Siemiginowska (2009). The mean values of are about 5.77 and 6.02 for the double-peaked emitters, in the rest-frame and in the observed-frame, respectively. Before proceeding further, we can find that MacLeod et al. (2010) have reported the mean value of the observed-frame () for about 9000 quasars in the SDSS S82. Therefore, more longer could be roughly found in the double-peaked emitters than in the normal quasars.
Then, besides the DRW process determined properties of the long-term variability of the 106 double-peaked emitters, it is necessary to determine long-term variability properties for a large sample of normal broad line AGN, in order to find more clearer variability difference between the double-peaked emitters and the normal broad line AGN (or normal quasars). Here, all the spectroscopically confirmed 21888 quasars in the SDSS S82 are considered (see also our previous results on quasars in SDSS S82 in Zhang (2014)). The long-term light curves of the quasars are collected from the SDSS S82. The same procedure is applied to fit the SDSS g-band light curves of the quasars. Here, the main reason to consider the SDSS g-band light curves of the normal quasars is mainly due to the following reason. The CSS DR2 provided magnitudes are similar as the standard V band magnitudes, meanwhile, the SDSS g-band magnitudes are sensitively proportional to standard V band magnitudes (Jester et al., 2005). Then, 7804 normal quasars are collected with reliable values of and (at least 5 times larger than the corresponding uncertainties).
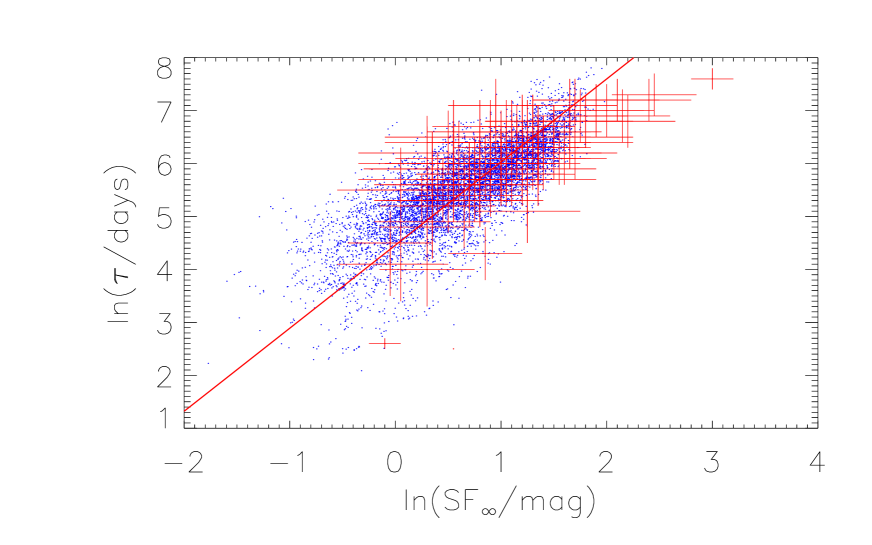
Before proceeding further, in order to ensure confidence in our measured parameters of and , Fig. 2 shows the correlation between the observed-frame and the observed-frame 111In MacLeod et al. (2010), the parameter was applied. which could be described by a power law function with slope of as discussed in MacLeod et al. (2010) for the quasars in the SDSS S82 (see Figure 3 in MacLeod et al. (2010)). It is clear that through our measured parameters of and for the normal quasars, there is a strong linear correlation between the observed-frame and the observed-frame with the Spearman Rank correlation coefficient of 0.63, which can be well described by
| (2) |
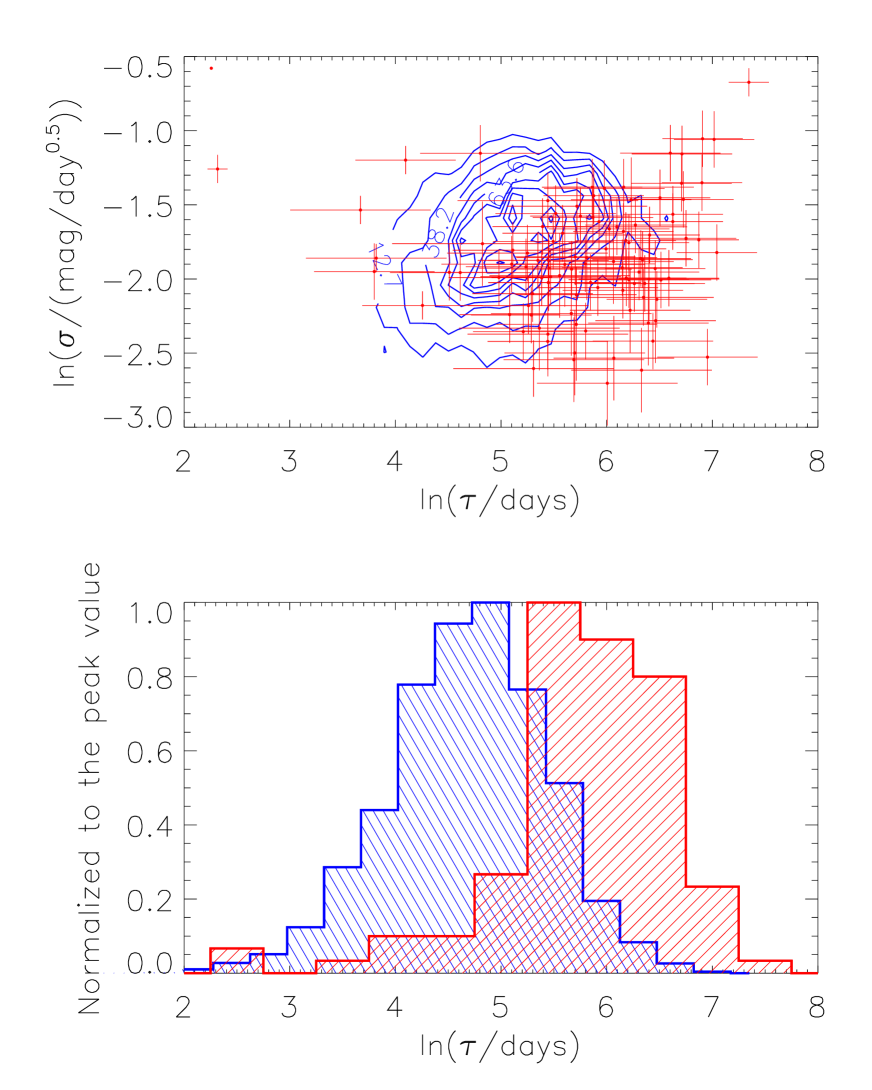
, based on considerations of the uncertainties in both coordinates. The determined power law function has the slope of similar as the one in MacLeod et al. (2010). Therefore, our determined parameters of and should be reliable. Then, after considerations of the cosmological time dilation, the rest-frame and the rest-frame are compared between the 106 double-peaked emitters and the 7804 normal quasars and shown in Fig. 3. The much different distributions of the rest-frame can be found and shown in the bottom panel of Fig. 3, with the mean value of the rest-frame about 4.71 for the normal quasars. And moreover, through the Student’s T-statistic technique, the calculated T-statistic value and its significance are 15 and for the distributions of , respectively, which indicate significantly different mean values of between the double-peaked emitters and the normal quasars with confidence level higher than 99.9%.
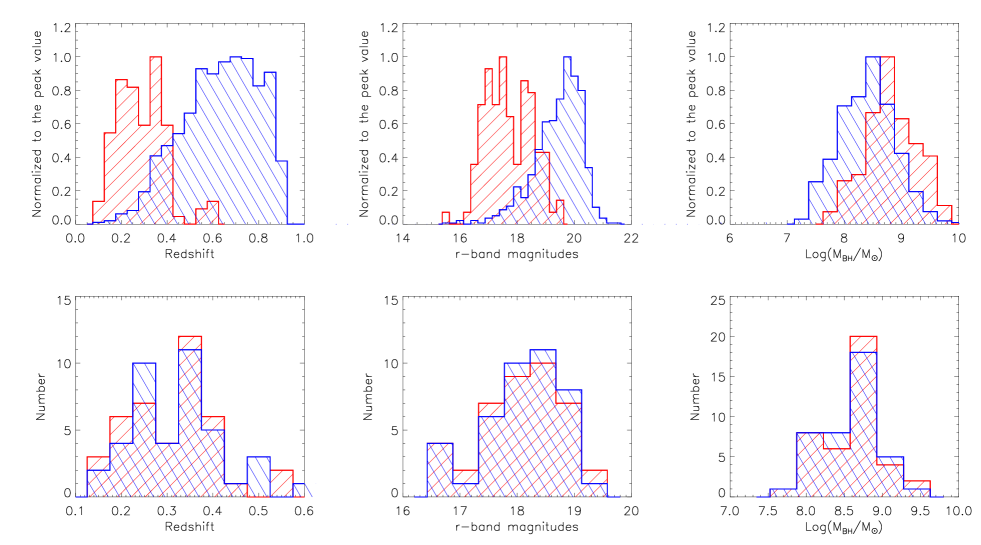
In order to confirm the longer in the double-peaked emitters, the following effects are mainly considered. First and foremost, we mainly consider the effects from different distributions of redshift, magnitude and BH mass between the double-peaked emitters and the normal quasars. As what we have shown in the introduction, the variability timescales should sensitively depend on BH masses. Therefore, if the selected double-peaked emitters had more massive black holes, the longer variability time scales could be expected. Moreover, some dependence of BH masses can be roughly found on the magnitudes and redshifts. Top panels of Fig. 4 show the much different distributions of redshift, magnitude and BH mass between the double-peaked emitters and the normal quasars. Here, the virial BH masses of the double-peaked emitters and the normal quasars are collected from the Shen et al. (2011) based on the equation in Vestergaard & Peterson (2006) (with the applied R-L relation similar to the more recent results in Bentz et al. (2013)). And, in order to ignore effects of being applied different broad line widths to estimate BH masses, the virial BH masses estimated through broad H are only considered. There are 961 normal quasars and 79 double-peaked emitters with reliable virial BH masses collected from Shen et al. (2011). For the other 27 double-peaked emitters not included in the Shen et al. (2011), the virial BH masses are estimated through the parameters of broad H by the same equation in Vestergaard & Peterson (2006) through the SDSS spectra, similar as what have been done in Shen et al. (2011).
In order to ignore the effects of the different distributions of redshift, magnitude and BH mass on the results in Fig. 3 (longer in the double-peaked emitters) as much as possible, the most convenient way is to create two subsamples for the double-peaked emitters and for the normal quasars, with the objects in the two subsamples having the same distributions of redshift, magnitude and BH mass. Based on the parameters of redshift, SDSS r-band magnitude and BH mass of the double-peaked emitters and the normal quasars, two subsamples including 41 double-peaked emitters and 41 normal quasars are created with the same distributions of the redshift, the SDSS r-band (with more higher signal-to-noises) apparent PSF magnitude and the virial BH mass, as the results shown in the bottom panels of Fig. 4. The two-sided Kolmogorov-Smirnov statistic technique is applied to check whether are there the same parameter distributions between the two samples. And we can find that the two distributions in each bottom panel of Fig. 4 have the same distributions with confidence level higher than 90%. Basic parameters including redshift, magnitude and BH mass are listed in Table 2 for the 41 double-peaked emitters and the 41 normal quasars in the subsamples. Then, properties of the DRW process determined are compared between the 41 double-peaked emitters and the 41 normal quasars. As shown in Fig. 5, the mean values of the rest-frame are about 5.72 and 4.63 days for the 41 double-peaked emitters and for the 41 normal quasars, respectively.
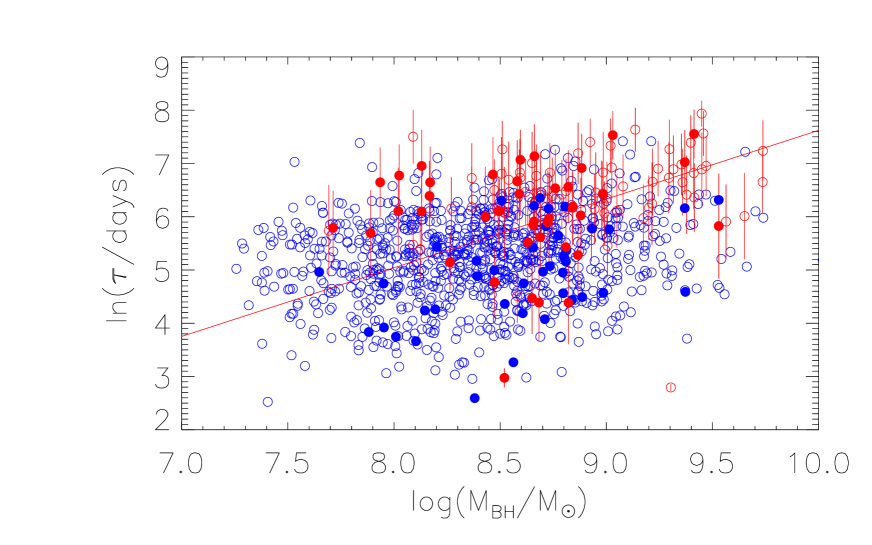
Moreover, as the results reported in Kelly, Bechtold & Siemiginowska (2009), Fig. 6 shows the dependence of on BH mass for the double-peaked emitters and for the normal quasars in the parent samples and in the subsamples. And we can find that the reported formula in Kelly, Bechtold & Siemiginowska (2009) can be well applied to describe the dependence shown in Fig. 6 based on our measured parameters. The results not only indicate that our measured parameters are reliable, but also illustrate that the 41 normal quasars and the 41 double-peaked emitters in the subsamples have similar BH mass ranges as the objects in the parent samples, leading to the not much different distributions of shown in the bottom panel of Fig. 3 and in Fig. 5. Then, the Student’s T-statistic technique is applied again to the distributions of the rest-frame of the 41 double-peaked emitters and the 41 normal quasars. The calculated T-statistic value and its significance are 5.6 and , respectively, which indicate significantly different mean values of between the 41 double-peaked emitters and the 41 normal quasars with confidence level higher than 99.9%. Thus, after well considerations of different redshift distributions, different magnitude distributions and different BH mass distributions, the more longer can be re-confirmed in the double-peaked emitters.
Besides, we should note that the SDSS g-filter for the normal quasars in SDSS S82 and the filter in the CSS for the double-peaked emitters covered different wavelength ranges, which would lead to some probable effects on the results shown in Fig. 3 and in Fig. 5. And moreover, the CSS DR2 provided light curves and the SDSS S82 provided light curves have much different sampling rates and much different signal-to-noise ratios. Then, the probable effects are considered by two different methods as follows. The first method is to check magnitude correlation between the CSS DR2 provided magnitudes and the SDSS S82 provided magnitudes, to consider probable effects of different filters. The second method is to directly check the DRW process determined parameter correlations based on the CSS DR2 provided light curves and based on the SDSS S82 provided light curves for a sample of quasars, to consider probable effects of different sampling rates and different signal-to-noise ratios of light curves from the CSS DR2 and from the SDSS S82.
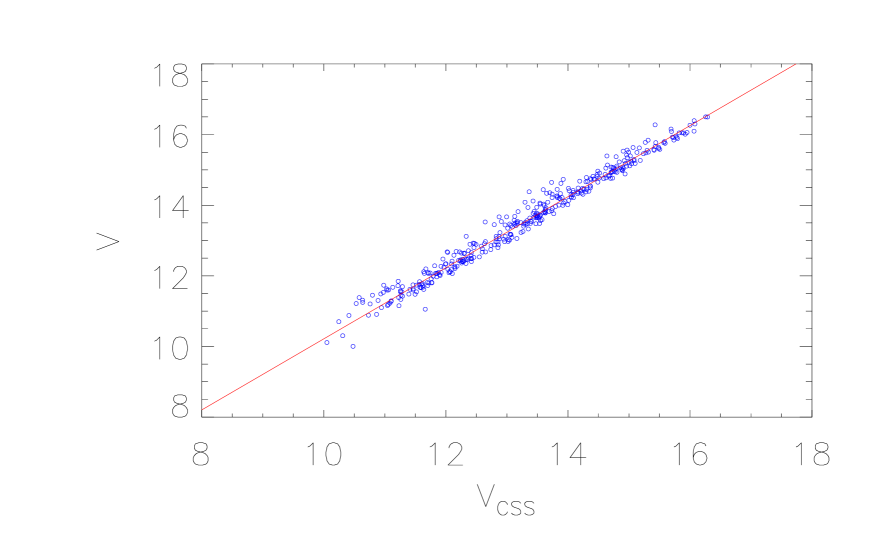
For the first method, properties of standard stars are considered as follows. Based on the standard stars from the catalogue of Landolt (2009) covered in the CSS, the correlation between the standard V band magnitudes and the CSS DR2 provided magnitudes can be checked. Here, we do not list the magnitudes of and of the more than 400 standard stars, but Fig 7 shows the correlation. The strong linear correlation with the Spearman rank correlation coefficient of 0.98 can be confirmed and described by
| (3) |
. Moreover, Jester et al. (2005) have shown that the standard V band magnitudes of SDSS quasars can be transferred from the SDSS g- and r-band magnitudes ( and ),
| (4) |
. Therefore, the SDSS g-band variability and CSS DR2 provided variability should have similar properties as the standard V band variability, to some extent.
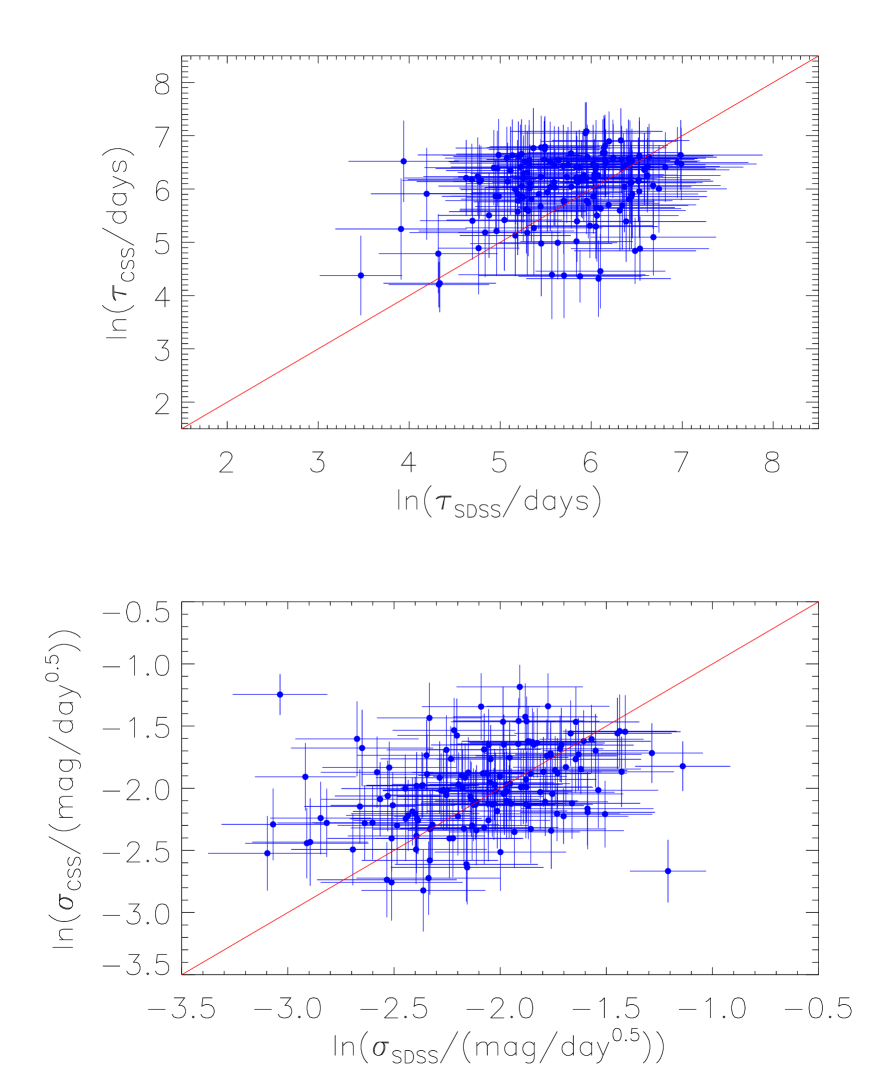
For the second method, among the 7804 normal quasars in the SDSS S82, there are 3207 normal quasars are also covered by the CSS. Then, the JAVELIN code is applied to determine the DRW process parameters of the CSS DR2 provided light curves of the 3207 normal quasars. Based on the DRW process determined parameters of and at least 5 times larger than the corresponding uncertainties, there are 154 normal quasars with well determined DRW process parameters from both the SDSS S82 provided light curves and from the CSS DR2 provided light curves. In top panels of Fig. 8, we show an example with light curves provided by both SDSS S82 and the CSS DR2, and their corresponding best fitted results by the JAVELIN code. Here, due to large magnitude uncertainties (small signal-to-noise ratios), the DRW process parameters can not be well determined from the CSS DR2 provided light curves for a large part of the 3207 objects. In bottom panels of Fig. 8, we show an example with the CSS DR2 provided light curve which can not be described by the DRW process. Then, Fig. 9 shows the correlations of the DRW process parameters determined from the SDSS S82 provided light curves ( and ) and from the CSS DR2 provided light curves ( and ) of the 154 quasars. The Spearman rank correlation coefficients are about 0.3 with for the correlations of versus and versus . The large scatters of the correlations shown in Fig. 9 are probably due to the different qualities of the light curves provided by the SDSS S82 and by the CSS DR2. However, we can find that the ratio of to has the mean value about 1.03, which can not be applied to explain the results shown in Fig. 3 and in Fig. 5 that the mean ratio of the double-peaked emitters to the normal quasars is about 3. Therefore, even with considerations of the different qualities of the light curves applied to the normal quasars and to the double-peaked emitters, the longer in the double-peaked emitters can be re-confirmed.
Last but not the least, there is a point we should note that accretion rate plays an important role in AGN variability. If the double-peaked emitters had statistically higher accretion rates than the normal quasars, the longer variability timescales could be expected in the double-peaked emitters. Therefore, it is necessary to check properties of the accretion rates. Here, the dimensionless accretion rate () is applied to trace the physical accretion rates (),
| (5) |
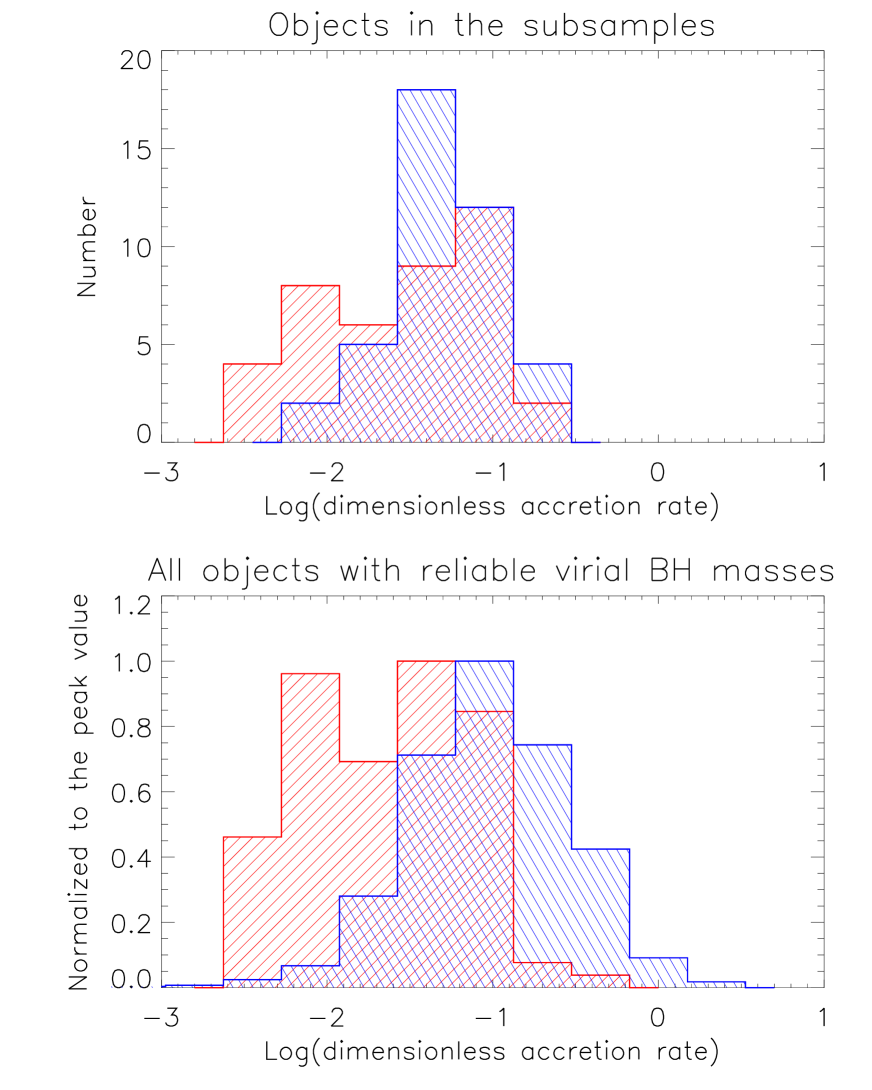
, where and represent the Eddington luminosity and the bolometric luminosity simply estimated by the 9 times of the continuum luminosity at 5100Å which can be collected from Shen et al. (2011) and/or from the SDSS spectra, respectively. The dimensionless accretion rates of the objects in the subsamples are listed in Table 2. The results are shown in Fig. 10. And we can find that there are a bit smaller dimensionless accretion rates in the double-peaked emitters than in the normal quasars. The mean values of are about -1.52 and -1.64 for the 41 double-peaked emitters in the subsample and for all the 106 double-peaked emitters, respectively. However, the mean values of are about -1.31 and -1.02 for the 41 normal quasars in the subsample and for the 961 normal quasars, respectively. In other words, the longer variability timescales in the double-peaked emitters are not due to larger accretion rates in the double-peaked emitters.
In brief, statistically longer DRW process determined intrinsic variability timescales can be found and confirmed in the double-peaked emitters, even after considerations of necessary effects, especially the effects from different distributions of redshift, BH mass and accretion rate. Therefore, rather than the observed double-peaked profiles of broad emission lines, probable intrinsic different structures of accretion disk could be expected in the double-peaked emitters. And hence, the double-peaked emitters can be well treated as an unique subclass of AGN with special properties of emission regions.
Before the end of the section, we try to find an interpretation of the longer variability timescales in the double-peaked emitters. By the expressions on the disk orbital or thermal timescales, BH mass and distance of emission regions to central BH are the two main parameters. As the results shown in Fig. 5 and in Fig. 10, even the double-peaked emitters have the same BH masses and the similar accretion rates as the normal quasars, the longer variability timescales can be still confirmed. Therefore, the key point to explain the longer variability timescales is how to explain the longer distances of the emission regions to central BHs in the double-peaked emitters than in the normal quasars. Under the theoretical framework of standard thin accretion disk proposed by Shakura & Sunyaev (1973), the BH mass and the accretion rate can be effectively determine the radial dependence of temperature (the locations of emission regions). For the double-peaked emitters and the normal quasars as the results shown in Fig. 5 and in Fig. 10, the same BH masses and similar accretion rates roughly indicating similar radial dependence of temperature (similar locations of emission regions) can not explain the longer variability timescales in the double-peaked emitters. Otherwise, radial dependence of accretion rate is considered, , as supposed in Loeb, Narayan & Raymond (2001) (see also the necessary modification of standard disk model for the well-known double-peaked emitter Arp 102B in Popovic et al. (2014)). Therefore, in the double-peaked emitters, simple radial dependence of accretion rate with larger could be an acceptable interpretation of larger distance of emission regions to central black hole, although it is not clear what mechanisms control the (radial flows?).
3 Conclusions
Our main results and conclusions are as follows. First and foremost, the long-term light curves from the CSS DR2 have been well analyzed by the DRW process for a large sample of SDSS spectroscopically confirmed double-peaked emitters. Meanwhile, the long-term light curves from the SDSS S82 have been analyzed by the same DRW process for the spectroscopically confirmed normal quasars. Besides, the longer variability timescales can be confirmed in the double-peaked emitters than in the normal quasars, even after considerations of necessary effects, such as effects from different distributions of redshift, BH mass and accretion rate between the normal quasars and the double-peaked emitters. The radial dependence of accretion rate with larger value of could be an acceptable interpretation of the longer variability timescales in the double-peaked emitters. Last but not the least, the intrinsic difference between the double-peaked emitters and the normal quasars strongly supports that the double-peaked emitters could be well treated as a unique subclass of AGN.
Acknowledgements
Zhang and FLL gratefully acknowledge the anonymous referee for giving us constructive comments and suggestions to greatly improve our paper. Zhang acknowledges the kind support from the Chinese grant NSFC-U1431229. FLL is supported under the NSFC grants 11273060, 91230115 and 11333008, and State Key Development Program for Basic Research of China (No. 2013CB834900 and 2015CB857000). This manuscript has made use of the data from the CSS. The CSS survey is funded by the National Aeronautics and Space Administration and the U.S. National Science Foundation. The CSS website is http://nesssi.cacr.caltech.edu/DataRelease/. This manuscript has made use of the data from the SDSS projects. Funding for SDSS-III has been provided by the Alfred P. Sloan Foundation, the Participating Institutions, the National Science Foundation, and the U.S. Department of Energy Office of Science. The SDSS-III web site is http://www.sdss3.org/. SDSS-III is managed by the Astrophysical Research Consortium for the Participating Institutions of the SDSS-III Collaboration including the University of Arizona, the Brazilian Participation Group, Brookhaven National Laboratory, Carnegie Mellon University, University of Florida, the French Participation Group, the German Participation Group, Harvard University, the Instituto de Astrofisica de Canarias, the Michigan State/Notre Dame/JINA Participation Group, Johns Hopkins University, Lawrence Berkeley National Laboratory, Max Planck Institute for Astrophysics, Max Planck Institute for Extraterrestrial Physics, New Mexico State University, New York University, Ohio State University, Pennsylvania State University, University of Portsmouth, Princeton University, the Spanish Participation Group, University of Tokyo, University of Utah, Vanderbilt University, University of Virginia, University of Washington, and Yale University.
| name | z | name | z | name | z | ||||||
|---|---|---|---|---|---|---|---|---|---|---|---|
| 000710+005329 | 0.32 | 7.00.5 | -1.60.2 | 001224102226 | 0.22 | 5.90.7 | -2.60.3 | 002444+003221 | 0.40 | 6.60.6 | -2.20.2 |
| 012128+003450 | 0.33 | 2.60.1 | -1.40.1 | 013023+000551 | 0.34 | 5.10.6 | -1.30.2 | 013253095239 | 0.26 | 6.10.6 | -1.70.2 |
| 014901080838 | 0.21 | 6.40.6 | -2.10.2 | 015530085704 | 0.16 | 6.30.6 | -2.00.2 | 021259003028 | 0.39 | 6.00.6 | -2.10.2 |
| 022930000845 | 0.61 | 5.30.9 | -2.00.3 | 030021071459 | 0.39 | 6.60.5 | -1.80.2 | 031235063431 | 0.35 | 4.10.6 | -2.10.2 |
| 032559+000800 | 0.36 | 5.80.6 | -1.90.2 | 034247+010933 | 0.36 | 5.70.5 | -1.80.2 | 073927+404347 | 0.21 | 5.90.8 | -2.40.4 |
| 074157+275519 | 0.33 | 4.10.7 | -2.00.1 | 074500+292702 | 0.33 | 5.80.6 | -1.70.2 | 075403+481428 | 0.27 | 6.40.5 | -1.80.2 |
| 075408+431610 | 0.35 | 7.20.4 | -1.50.2 | 080310+293234 | 0.33 | 7.30.4 | -1.20.2 | 081051+174034 | 0.34 | 6.50.6 | -1.90.2 |
| 081916+481746 | 0.22 | 6.60.7 | -2.10.3 | 082125+421907 | 0.22 | 5.30.7 | -2.00.2 | 082406+334245 | 0.32 | 6.30.6 | -1.80.2 |
| 083225+370736 | 0.09 | 6.80.5 | -1.20.2 | 083343+074654 | 0.21 | 6.70.5 | -2.10.2 | 083413+590300 | 0.31 | 6.50.6 | -1.60.3 |
| 084110+022952 | 0.33 | 4.90.7 | -2.10.2 | 084143+281956 | 0.47 | 5.50.6 | -2.00.2 | 084205+075926 | 0.13 | 6.60.5 | -2.20.2 |
| 085029+185350 | 0.57 | 5.90.6 | -2.10.2 | 085633+595747 | 0.28 | 6.40.6 | -2.20.2 | 091706+325625 | 0.36 | 6.00.7 | -2.70.3 |
| 091828+513932 | 0.18 | 6.50.7 | -2.70.3 | 091930+110854 | 0.37 | 5.60.6 | -2.40.2 | 091941+534549 | 0.56 | 6.00.7 | -2.20.3 |
| 092133+321320 | 0.58 | 6.80.5 | -2.10.2 | 092659+093248 | 0.42 | 5.80.6 | -2.20.2 | 093509+481909 | 0.22 | 5.50.6 | -2.20.2 |
| 093653+533127 | 0.23 | 6.60.6 | -2.40.3 | 093756+104809 | 0.27 | 2.50.0 | -0.70.0 | 093844+005715 | 0.17 | 7.20.4 | -1.90.2 |
| 094215+090016 | 0.21 | 5.50.8 | -2.70.2 | 095236+205143 | 0.28 | 4.50.6 | -2.30.1 | 095939+480439 | 0.39 | 6.00.8 | -2.40.3 |
| 100027+025951 | 0.34 | 7.00.5 | -1.50.2 | 101931+262642 | 0.25 | 6.20.6 | -1.50.2 | 103059+310256 | 0.18 | 5.40.6 | -2.00.2 |
| 103202+600836 | 0.29 | 5.70.9 | -1.60.2 | 103427+614821 | 0.16 | 6.50.7 | -2.20.2 | 103620+121734 | 0.19 | 6.80.5 | -1.70.2 |
| 105041+345631 | 0.27 | 5.50.6 | -2.30.2 | 105115+280527 | 0.42 | 5.80.6 | -2.20.2 | 105624+601558 | 0.20 | 5.90.7 | -1.60.2 |
| 110051+170934 | 0.35 | 6.00.6 | -2.00.2 | 110920+213802 | 0.34 | 6.80.5 | -1.60.2 | 111230+181311 | 0.19 | 6.40.6 | -2.30.3 |
| 111537+542725 | 0.42 | 5.60.8 | -2.00.2 | 111916+110107 | 0.39 | 4.00.7 | -1.70.1 | 112007+423551 | 0.23 | 4.30.5 | -1.30.1 |
| 113021+022211 | 0.24 | 5.60.5 | -2.10.2 | 113640+573840 | 0.15 | 5.50.8 | -2.40.3 | 114335002942 | 0.17 | 5.60.6 | -2.50.2 |
| 115227+604818 | 0.27 | 6.40.7 | -1.50.2 | 115408+252145 | 0.34 | 4.80.5 | -2.10.2 | 120442+275412 | 0.16 | 6.00.5 | -2.10.2 |
| 120714+292236 | 0.38 | 6.20.5 | -1.60.2 | 120924+103611 | 0.39 | 6.40.6 | -2.70.3 | 121037+315705 | 0.39 | 7.20.4 | -1.90.2 |
| 121716+080942 | 0.34 | 6.60.6 | -2.10.2 | 123054+110010 | 0.23 | 6.80.5 | -2.10.2 | 123215+132033 | 0.28 | 5.60.6 | -2.00.2 |
| 123807+532556 | 0.35 | 6.90.5 | -1.30.2 | 123945+195425 | 0.24 | 6.40.6 | -2.10.2 | 125142+240435 | 0.19 | 6.10.5 | -1.70.2 |
| 125809+351943 | 0.29 | 7.60.2 | -0.80.1 | 130634+304934 | 0.41 | 5.80.7 | -2.10.2 | 130927+032251 | 0.26 | 6.30.6 | -2.00.3 |
| 132145+033056 | 0.27 | 6.10.5 | -1.50.2 | 132834012917 | 0.15 | 6.60.5 | -2.00.2 | 133053+311930 | 0.24 | 5.80.6 | -1.80.2 |
| 133329+154550 | 0.25 | 5.20.5 | -2.10.2 | 133433013825 | 0.29 | 5.70.8 | -2.50.3 | 134548+114443 | 0.13 | 5.20.5 | -2.30.2 |
| 135529+352332 | 0.31 | 6.90.5 | -1.70.2 | 135712+170444 | 0.15 | 6.50.6 | -2.10.2 | 140336+174136 | 0.23 | 6.00.7 | -2.00.2 |
| 141613+021908 | 0.16 | 7.10.5 | -2.60.2 | 141628+124213 | 0.33 | 6.10.7 | -2.00.3 | 142522+080326 | 0.23 | 6.20.6 | -1.90.2 |
| 142725+194952 | 0.11 | 6.20.7 | -1.70.2 | 143204+394437 | 0.35 | 6.10.7 | -2.50.2 | 151132+100953 | 0.28 | 6.00.5 | -1.70.2 |
| 152139+033729 | 0.13 | 6.30.5 | -1.80.2 | 154019020505 | 0.32 | 6.60.5 | -2.00.2 | 154433+202626 | 0.27 | 6.70.6 | -2.40.3 |
| 161218+073145 | 0.21 | 5.90.6 | -2.20.2 | 161811+093052 | 0.26 | 5.70.7 | -2.10.2 | 163856+433512 | 0.34 | 7.20.4 | -1.20.2 |
| 165822+183735 | 0.17 | 6.60.6 | -2.50.2 | 170102+340400 | 0.09 | 5.30.5 | -2.40.2 | 172711+632242 | 0.21 | 5.80.8 | -2.00.3 |
| 212501081328 | 0.62 | 6.40.6 | -2.30.2 | 212619065408 | 0.42 | 7.10.5 | -1.90.2 | 222024+010931 | 0.21 | 6.60.5 | -1.80.2 |
| 233254+151305 | 0.21 | 6.20.7 | -2.80.3 |
Notice: Col(1), Col(5) and Col(9) list the object name in the format of SDSS Jhhmmssddmmss, Col(2), Col(6) and Col(10) list the information of redshift, Col(3), Col(7) and Col(11) list the determined DRW parameter of rest-frame in unit of days, Col(4), Col(8) and Col(12) list the determined DRW parameter of rest-frame in unit of .
| name | z | mag | name | z | mag | ||||||
|---|---|---|---|---|---|---|---|---|---|---|---|
| Double-peaked emitters | Normal quasars | ||||||||||
| 012128+003450 | 0.25 | 19.08 | 8.51 | -2.01 | 2.6 | 000557+002837 | 0.33 | 18.41 | 8.20 | -1.30 | 5.2 |
| 013023+000551 | 0.37 | 18.70 | 8.80 | -1.61 | 5.1 | 001030+010006 | 0.33 | 17.49 | 8.93 | -1.27 | 5.4 |
| 014901080838 | 0.25 | 18.58 | 8.17 | -2.04 | 6.4 | 002831000413 | 0.26 | 17.66 | 8.71 | -1.48 | 3.8 |
| 031235063431 | 0.25 | 18.65 | 8.65 | -1.41 | 4.1 | 003723+000812 | 0.34 | 18.34 | 7.95 | -0.97 | 4.5 |
| 032559+000800 | 0.34 | 17.74 | 9.05 | -2.28 | 5.8 | 004458+004319 | 0.37 | 18.67 | 8.65 | -1.42 | 5.9 |
| 073927+404347 | 0.32 | 18.51 | 8.02 | -2.01 | 5.9 | 010151+002028 | 0.23 | 18.52 | 8.80 | -1.84 | 4.9 |
| 074157+275519 | 0.34 | 18.38 | 8.68 | -1.44 | 4.1 | 010230003206 | 0.33 | 18.99 | 8.83 | -1.68 | 4.1 |
| 074500+292702 | 0.34 | 17.99 | 8.49 | -1.23 | 5.8 | 011402004750 | 0.33 | 18.68 | 8.19 | -1.00 | 3.9 |
| 082125+421907 | 0.34 | 19.02 | 8.63 | -2.51 | 5.3 | 012050001832 | 0.22 | 18.61 | 9.37 | -2.07 | 4.2 |
| 083413+590300 | 0.40 | 18.17 | 8.46 | -1.25 | 6.5 | 012602000822 | 0.31 | 17.96 | 8.60 | -1.05 | 3.8 |
| 084110+022952 | 0.33 | 19.05 | 8.86 | -2.02 | 4.9 | 013015+002557 | 0.34 | 19.05 | 8.52 | -1.37 | 4.0 |
| 084143+281956 | 0.30 | 19.43 | 8.65 | -1.21 | 5.5 | 013352+011345 | 0.49 | 18.21 | 8.38 | -1.11 | 4.9 |
| 084205+075926 | 0.39 | 17.34 | 8.02 | -1.48 | 6.6 | 013418+001536 | 0.14 | 16.79 | 8.80 | -0.85 | 5.8 |
| 085029+185350 | 0.44 | 17.80 | 8.98 | -1.16 | 5.9 | 013923010632 | 0.52 | 18.86 | 8.88 | -1.52 | 4.1 |
| 091941+534549 | 0.33 | 18.89 | 8.75 | -1.20 | 6.0 | 014017005003 | 0.58 | 16.43 | 9.01 | -1.02 | 5.4 |
| 092659+093248 | 0.33 | 17.88 | 8.84 | -1.10 | 5.8 | 015105003426 | 0.40 | 18.87 | 8.80 | -1.71 | 5.2 |
| 093756+104809 | 0.24 | 17.86 | 9.30 | -1.99 | 2.5 | 024052004110 | 0.24 | 17.84 | 9.16 | -2.03 | 4.3 |
| 095236+205143 | 0.20 | 17.59 | 8.47 | -1.11 | 4.5 | 024601005937 | 0.27 | 18.13 | 8.10 | -1.22 | 3.4 |
| 095939+480439 | 0.28 | 17.97 | 8.60 | -1.91 | 6.0 | 031142005918 | 0.40 | 19.11 | 8.37 | -1.38 | 2.3 |
| 103059+310256 | 0.26 | 16.76 | 8.68 | -1.43 | 5.4 | 205212002645 | 0.21 | 18.63 | 8.57 | -1.49 | 4.3 |
| 103202+600836 | 0.48 | 19.22 | 8.43 | -2.28 | 5.7 | 205608+002928 | 0.28 | 17.45 | 9.16 | -1.13 | 5.9 |
| 105041+345631 | 0.58 | 18.62 | 7.71 | -0.68 | 5.5 | 210839004816 | 0.28 | 19.08 | 8.81 | -1.33 | 4.9 |
| 105115+280527 | 0.28 | 17.24 | 9.20 | -1.98 | 5.8 | 211838+004035 | 0.48 | 18.60 | 7.64 | -0.62 | 4.7 |
| 105624+601558 | 0.14 | 18.23 | 8.13 | -1.58 | 5.9 | 213110003537 | 0.20 | 17.61 | 8.00 | -1.23 | 3.6 |
| 110051+170934 | 0.23 | 18.60 | 8.16 | -0.95 | 6.0 | 213245+000146 | 0.34 | 18.43 | 7.95 | -0.99 | 3.7 |
| 110920+213802 | 0.34 | 18.20 | 8.66 | -1.24 | 6.8 | 213818+011222 | 0.36 | 17.55 | 8.39 | -0.85 | 4.5 |
| 111230+181311 | 0.33 | 18.12 | 7.93 | -1.02 | 6.4 | 215010001000 | 0.25 | 18.38 | 8.77 | -1.53 | 5.3 |
| 111537+542725 | 0.21 | 18.25 | 8.73 | -1.10 | 5.6 | 215408002744 | 0.42 | 17.88 | 8.71 | -1.64 | 5.6 |
| 113021+022211 | 0.27 | 17.63 | 8.72 | -1.50 | 5.6 | 215949+001004 | 0.25 | 17.98 | 8.47 | -1.28 | 4.7 |
| 113640+573840 | 0.36 | 17.32 | 7.89 | -1.65 | 5.5 | 220332+004401 | 0.15 | 18.17 | 8.72 | -1.18 | 5.8 |
| 114335002942 | 0.40 | 17.67 | 8.65 | -1.76 | 5.6 | 221155001043 | 0.22 | 18.13 | 8.79 | -1.20 | 4.6 |
| 115227+604818 | 0.49 | 19.02 | 8.58 | -2.29 | 6.4 | 221737004854 | 0.26 | 19.52 | 8.65 | -1.35 | 5.0 |
| 115408+252145 | 0.21 | 17.58 | 8.26 | -0.64 | 4.8 | 222024+010931 | 0.34 | 16.61 | 8.73 | -1.18 | 4.8 |
| 121037+315705 | 0.22 | 16.65 | 9.03 | -0.95 | 7.2 | 222230+010231 | 0.33 | 18.70 | 8.56 | -1.72 | 3.0 |
| 121716+080942 | 0.26 | 16.76 | 8.88 | -1.11 | 6.6 | 230007+001739 | 0.39 | 18.54 | 8.14 | -1.13 | 4.0 |
| 123054+110010 | 0.23 | 16.62 | 8.59 | -1.05 | 6.8 | 230155010649 | 0.24 | 16.82 | 8.68 | -1.23 | 6.1 |
| 130634+304934 | 0.42 | 18.64 | 8.84 | -1.33 | 5.8 | 230705+004754 | 0.44 | 18.63 | 8.70 | -1.37 | 4.6 |
| 130927+032251 | 0.15 | 18.73 | 8.82 | -1.98 | 6.3 | 232259005359 | 0.32 | 17.18 | 7.88 | -0.85 | 3.6 |
| 154433+202626 | 0.33 | 18.20 | 8.13 | -1.09 | 6.7 | 232525+000352 | 0.25 | 18.10 | 8.50 | -1.32 | 6.0 |
| 161811+093052 | 0.52 | 17.73 | 8.87 | -1.71 | 5.7 | 234145004640 | 0.27 | 17.62 | 8.98 | -1.17 | 4.1 |
| 163856+433512 | 0.27 | 18.34 | 9.41 | -1.98 | 7.2 | 235457+004219 | 0.34 | 17.87 | 8.79 | -1.48 | 4.3 |
Notice: The first six columns show the parameters of the object name in the format of SDSS Jhhmmssddmmss, redshift, SDSS r-band magnitude, virial BH mass in unit of , dimensionless accretion rate and the rest-frame in unit of days for the 41 double-peaked emitters in the subsample. The last six columns shows the corresponding parameters for the 41 normal quasars in the subsample.
References
- Andrae, Kim & Bailer-Jones (2013) Andrae, R., Kim, D. W., & Bailer-Jones, C. A. L., 2013, A&A, 554, 137
- Bailer-Jones (2012) Bailer-Jones, C. A. L., 2012, A&A, 546, A89
- Bentz et al. (2013) Bentz, M. C., et al., 2013, ApJ, 767, 149
- Bramich et al. (2008) Bramich, D. M., et al., 2008, MNRAS, 386, 887
- Brockwell & Davis (2002) Brockwell, P. J., & Davis, R. A. 2002, Introduction to Time Series and Forecasting (2nd ed.; New York: Springer)
- Chen & Halpern (1989) Chen, K. Y., & Halpern, J. P., 1989, ApJ, 344, 115
- Drake et al. (2009) Drake, A. J., 2009, ApJ, 696, 870
- Eracleous & Halpern (1994) Eracleous, M., & Halpern, J. P., 1994, ApJS, 90, 1
- Eracleous et al. (1995) Eracleous, M., Livio, M., Halpern, J. P., Storchi-Bergmann, T., 1995, ApJ, 438, 610
- Eracleous et al. (1997) Eracleous, M., Halpern, J. P., Gilbert, A. M., Newman, J. A., Filippenko, A. V., 1997, ApJ, 490, 216
- Flohic & Eracleous (2008) Flohic, H. M. L. G., & Eracleous, M., 2008, ApJ, 686, 138
- Gaskell (1996) Gaskell, M., 1996, ApJL, 464, 107
- Hawkins (2002) Hawkins, M. R. S. 2002, MNRAS, 329, 76
- Hopkins et al. (2006) Hopkins, P. F., et al., 2006, ApJS 163, 1
- Jester et al. (2005) Jester, S., et al., 2005, AJ, 130, 873
- Kelly, Bechtold & Siemiginowska (2009) Kelly, B. C., Bechtold, J., & Siemiginowska, A., 2009, ApJ, 698, 895
- Kozlowski et al. (2010) Kozlowski, S., et al., 2010, ApJ, 708, 927
- Landolt (2009) Landolt, A. u., 2009, ApJ, 698, 895
- Larson et al. (2003) Larson, S., et al., 2003, DPS, 35, 3604
- Lewis, Eracleous & Storchi-Bergmann (2010) Lewis, K. T., Eracleous, M., & Storchi-Bergmann, T., 2010, ApJS, 187, 416
- Loeb, Narayan & Raymond (2001) Loeb, A., Narayan, R., & Raymond, J. C., 2001, ApJL, 547, 151
- MacLeod et al. (2010) MacLeod C. L., et al., 2010, ApJ, 721, 1014
- Meusinger, Hinze & de Hoon (2011) Meusinger, H., Hinze, A., & de Hoon, A., 2011, A&A, 525, 37
- Mushotzky et al. (2011) Mushotzky, R. F., Edelson, R., Baumgartner, W., Gandhi, P., 2011, ApJL, 743, 12
- Peterson (2001) Peterson, B. M., Advanced Lectures on the Starburst-AGN Connection, Proceedings of a conference held in Tonantzintla, Puebla, Mexico, 26-30 June, 2000. Edited by Aretxaga, I., Kunth, D., and Mujica, R.. Singapore: World Scientific, 2001., p.3
- Popovic et al. (2014) Popovic, L. C., et al., 2014, A&A, 572, 66
- Rees (1984) Rees, M. J., 1984, ARA&A, 22, 471
- Schmidt et al. (2010) Schmidt, K. B., et al., 2010, ApJ, 714, 1194
- Schmidt et al. (2012) Schmidt, K. B., et al., 2012, ApJ, 744, 147
- Shakura & Sunyaev (1973) Shakura, N. I., & Sunyaev, R. A., 1973, A&A, 24, 337
- Shapovalova et al. (2001) Shapovalova, A. I., et al., 2001, A&A, 376, 775
- Shen et al. (2011) Shen, Y., et al., 2011, ApJS, 194, 45
- Stauffer, Schild & Keel (1983) Stauffer, J., Schild, R., & Keel, W., 1983, ApJ, 270, 4655
- Storchi-Bergmann et al. (2003) Storchi-Bergmann, T., et al., 2003, ApJ, 489, 8
- Strateva et al. (2003) Strateva, I. V., et al., 2003, AJ, 126, 1720
- Torricelli-Ciamponi et al. (2000) Torricelli-Ciamponi, G., Foellmi, C., Courvoisier, T. J.-L., Paltani, S. 2000, A&A, 358, 57
- Ulrich, Maraschi & Urry (1997) Ulrich, M. H., Maraschi, L., & Urry, C. M., 1997, ARA&A, 35, 445
- Vestergaard & Peterson (2006) Vestergaard, M., & Peterson, B. M. 2006, ApJ, 641, 689
- Zhang, Dultzin & Wang (2007) Zhang, X.-G., Dultzin, D., Wang, T.-G., 2007, MNRAS, 377, 1215
- Zhang (2013) Zhang, X.-G., 2013, MNRAS Letter, 431, 112
- Zhang (2014) Zhang, X.-G., 2014, MNRAS, 438, 557
- Zheng, Veilleux & Grandi (1991) Zheng, W., Veilleux, S., Grandi, S. A., 1991, ApJ, 381, 418
- Zu, Kochanek & Peterson (2011) Zu, Y., Kochanek, C. S., & Peterson, B. M., 2011, ApJ, 735, 80
- Zu et al. (2013) Zu, Y., Kochanek, C. S., Kozlowski, S., Udalski, A., 2013, ApJ, 765, 106