An active, asynchronous companion to a redback millisecond pulsar
Abstract
PSR J17232837 is a “redback” millisecond pulsar (MSP) with a low-mass companion in a 14.8 h orbit. The system’s properties closely resemble those of “transitional” MSPs that alternate between spin-down and accretion-powered states. In this paper we report on long-term photometry of the 15.5 mag companion to the pulsar. We use our data to illustrate that the star experiences sporadic activity, which we attribute to starspots. We also find that the companion is not tidally locked and infer for the ratio between the rotational and orbital periods. Finally, we place constraints on various parameters, including the irradiation efficiency and pulsar mass. We discuss similarities with other redback MSPs and conclude that starspots may provide the most likely explanation for the often seen irregular and asymmetric optical lightcurves.
1 Introduction
Targeted radio searches towards Fermi-LAT unclassified point sources have unravelled numerous millisecond pulsars (MSPs) with non-degenerate companions (Roberts, 2013). Their defining properties include radio eclipses around superior conjunction (i.e. when the pulsar is behind the companion), and Xray emission, rapid orbital-period modulations (Archibald et al., 2013), and strong optical variability. This rich phenomenology suggests that the pulsar companions are losing mass, thereby providing a unique opportunity to probe accretion physics and stellar evolution in the presence of a strong external heating source.
Eclipsing MSPs are commonly classified as either “black widows” or “redbacks”, depending on the mass of the companion ( of up to few M⊙, and M⊙ respectively). Even though the origin and evolution of these systems remain ambiguous (Chen et al., 2013; Benvenuto et al., 2014), the relative population sizes suggest that the two subclasses are not directly linked, but rather represent stable endpoints of distinct evolutionary paths (Chen et al., 2013). This argument is somewhat challenged by recent observations illustrating that redback MSPs can transition between a spin-down radio MSP state and a low-mass Xray binary (LMXB) state (Archibald et al., 2009).
State changes have now been observed in three binaries, with recurrence time-scales of order few years (Archibald et al., 2009; Papitto et al., 2013; Stappers et al., 2014; Patruno et al., 2014; Bassa et al., 2014; Bogdanov et al., 2014b; Tendulkar et al., 2014; Roy et al., 2015). According to the prevailing theory, transitions are likely driven by irradiation feedback on the companion, which alters its size and mass-loss rate, triggering propeller-type instabilities on an accretion disk (see discussion in Patruno et al., 2014).
Indeed, for most known redback MSPs the companion luminosity modulates strongly with the orbital period, presumably due to the varying view of a heated area on the stellar surface (e.g. Breton et al., 2013; de Martino et al., 2014; Bellm et al., 2016; Roberts et al., 2015; Deneva et al., 2016). Thus far however, interpretation of redback lightcurves has been proven challenging. For instance, models in which the companion’s side facing the pulsar is directly heated by the pulsar wind do not adequately describe the asymmetries and phase-dependence of the observed “day/night” variations (e.g. Roberts et al., 2015; Deneva et al., 2016).
Among alternatives, the most viable option appears to be a modified geometry in which the pulsar wind is reprocessed by intra-binary shocks, the presence of which is suggested by phase-resolved X-ray observations. Romani & Sanchez (2016) recently demonstrated that one can introduce an arbitrary degree of asymmetries in the lightcurve, if the reflected radiation is modelled self-consistently. Their model seems to improve model fits substantially, at least in the case of PSR J2215+5135, a redback MSP with a lightcurve well-sampled in binary phase. Still, numerous questions remain. For instance, the intra-binary shock model does not provide a explanation for the often seen secular changes in average flux. Also, its long-term self-consistency remains to be tested as, thus far, most redback lightcurves have been sampled over a limited number of orbital cycles.
Herein we present long-term optical photometry of PSR J17232837, a 1.86 ms redback MSP in a 14.8 h orbit around a main-sequence-like companion. PSR J17232837 was discovered in the Parkes Multibeam survey in 2004 (Faulkner et al., 2004). In a long-term radio-timing study, Crawford et al. (2013) find that the system shares common properties with transitional MSPs, including irregular radio eclipses around superior conjunction and timing noise suggestive of tidal interactions between the pulsar and its Roche-lobe filling companion. The system has a bright ( mag) optical counterpart, making it an ideal case-study for redback MSPs. We use our data to illustrate that the companion star experiences periods of increased surface activity, leading to variability modulated at the rotational period, which is not synchronized with the orbital period. This behaviour can fully account for the (transient) asymmetries seen over individual orbital cycles.
2 Observations
PSR J17232837 was observed by the lead author between 2014 August 3 and 2015 October 27 from Overberg, South Africa. The location of the observatory allows for continuous monitoring of the target for up to 9 hours per night, or 60% of the orbital period. The site suffers from minimal light pollution and the seeing typically ranges from 2 to 3 arcsec.
All observations were conducted with a 30 cm Cassegrain telescope and a commercial SBIG ST9e CCD camera cooled to C, with 20 m2 pixels arranged in a 512512 grid. 1844 images were collected over sixty seven nights, with exposure times ranging from 300 s (in 2014) to 600 s (in 2015). No photometric filters were used. Guiding corrections were performed with the integrated tracking CCD at 1 sec intervals, always using the same star.
The images were reduced using standard dark and sky-flat frames acquired sporadically throughout the campaign. The magnitudes reported below are based on differential ensemble-type aperture photometry, computed with C-Munipac/Muniwin (v. 2.0.17222http://c-munipack.sourceforge.net/), a public photometry program. Fluxes were measured inside an aperture enclosing 2 times the FWHM of the local PSF, and the sky was extracted from a surrounding region up to 5 times the FWHM, but excluding the area close to our source, which contains a faint star. We experimented with different settings, each time extracting consistent results.
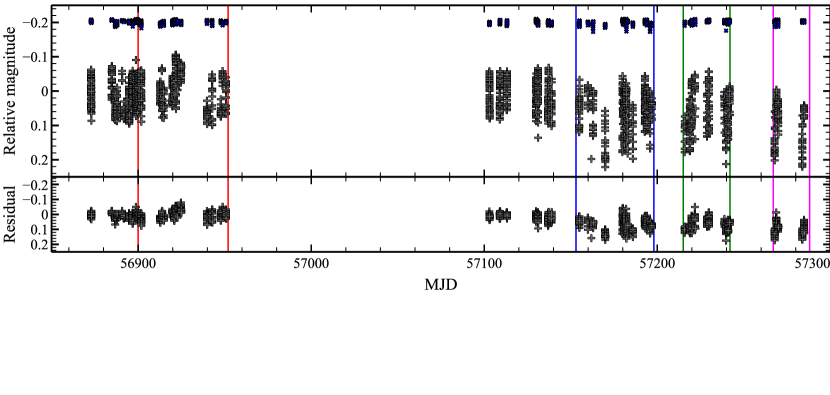
A set of six isolated bright objects were selected to derive a virtual comparison star. We verified this choice by monitoring the stability for one of them against the other five. As can be seen in Figure 1, the residual flux is consistent with white noise, with a root-mean-square value of 9 mmag.
Time stamps were derived from PC time which was synchronized to an international time server and checked regularly against a GPS master clock. All measurements below refer to barycentric times corresponding to the center of each exposure.
Binary phases were calculated using the pulsar timing ephemeris of Crawford et al. (2013), adopting MJD 55425.320466, for the time of ascending node and days, for the orbital period. We also account for the small secular change in the orbital period, , which could result in a delay of up to sec over the span of the observations. Higher-order variations in were omitted, as their effect is too small to influence our results (see Crawford et al., 2013). Under the adopted convention, coincides with the superior conjunction, when the pulsar is eclipsed by its companion.
3 Results
Figure 1 shows the lightcurve of the companion to PSR J17232837 from August 2014 to October 2015. The most dominant trend is a mag drop in flux after MJD 57160.
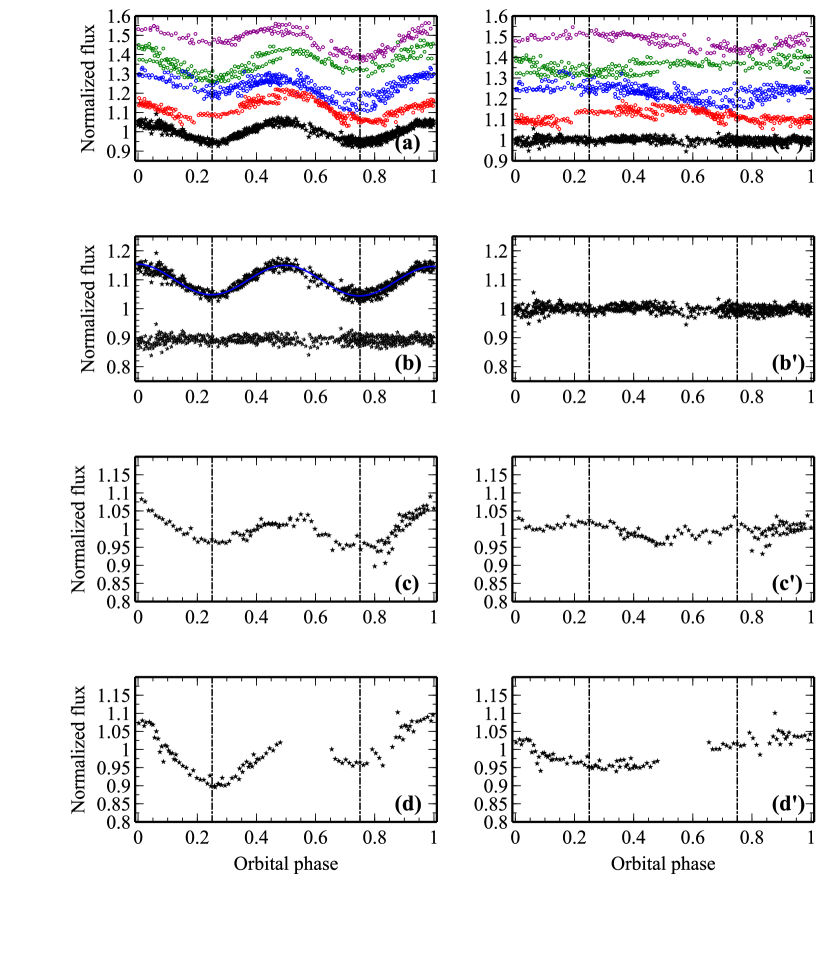
In Figure 2a we show our entire dataset folded with the orbital ephemeris of Crawford et al. (2013). Here, one can already see a seemingly “chaotic” behaviour which would be difficult to attribute to a stable geometric configuration. We find that this is caused by periods of increased activity, intervened by periods of “quiescence”. In what follows we discuss these separately and use them to constrain various system parameters.
3.1 Tidal deformation and direct irradiation
Upon visual inspection, we identify two periods of quiescence, between MJDs 56872–56901 and MJDs 57102–57130. The folded lightcurve corresponding to these epochs (Figure 2b) is dominated by a persistent signal modulated at the first orbital harmonic. We model the lightcurve in two ways. First, we fit an empirical model which includes two sinusoids at the fundamental and first orbital harmonic (with phases fixed using the timing ephemeris), and a third degree polynomial for normalization.
We infer fractional amplitudes of and for the two sine waves, and polynomial coefficients consistent with zero, except for the constant normalization factor. Varying the polynomial degree (from 0 to 5) yields consistent results. When allowing for phase offsets we find and a somewhat larger fractional amplitude for the fundamental. The reduced for these fits is , most likely due to overestimated uncertainties. Thus far, we were unable to derive more reliable measurement errors from our data. The rms scatter of the residuals suggests that true uncertainties are 2.5 smaller. However, in what follows we do not rescale the uncertainty estimates, to stay on the conservative side.
We next turn to the Lomb-Scargle periodogram of the data (Lomb, 1976; Scargle, 1982), shown in Figure 3. From the aforementioned windows we infer for the strongest signal, peaking at h333All values and associated uncertainties derived from frequency analysis are based on Monte-Carlo simulations, where we generate several 10 000 realizations of the lightcurve. We report mean values and their standard deviations. , which is fully consistent with the prediction of the timing ephemeris. If we instead use the entire dataset we find; (Figure 3a). This suggests that the true uncertainties are somewhat larger, and therefore we adopt,
| (1) |
for the rest of our analysis. At two times we infer for the quiescent data, and for the full dataset, although, as we discuss in §3.2 this is likely contaminated by a stronger peak in the vicinity.
We believe that the dominant source of variability is ellipsoidal variations from the tidally-distorted companion. If one treats these perturbatively, then can be thought of as the linear term of the Fourier expansion describing the ellipsoidal signal, with (Beech, 1989; Morris & Naftilan, 1993). Here is the semi-major axis of the companion, is the mass ratio and (of order unity) depends on the properties of the atmosphere and the CCD response (see §4.1 for details). In §4.1 we use our measurement to constrain various parameters of the system.
For the interpretation is not as straight-forward. For direct irradiation one would expect , where is the irradiation temperature, is the effective photospheric temperature, and accounts for the atmospheric albedo and the irradiation efficiency. In principle, the dependence on inclination could be stronger, depending on the wind radial profile. If one takes these estimates at face value then 4%, adopting the system parameters discussed in Crawford et al. (2013) and below. However, we do not believe that our data support direct irradiation as firstly ,there is evidence for misalignment between inferior conjunction and maximum flux and secondly, the signal may be contaminated by starspots and aliases of the ellipsoidal modulation.
3.2 Starspots and stellar rotation
We now focus on data collected during periods of increased activity.
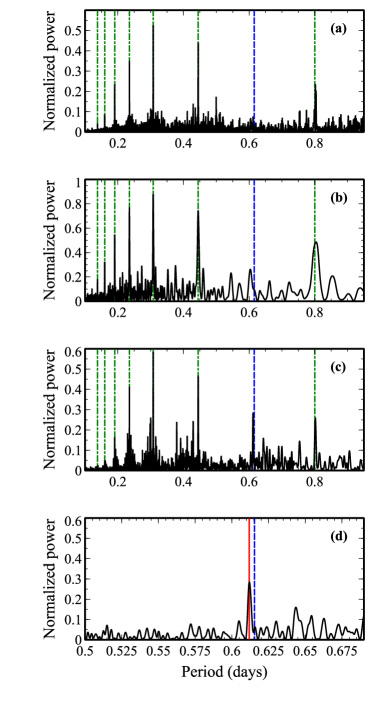
Figure 3c shows the Lomb-Scargle periodogram of the data acquired between MJDs 56901–56950, and after MJD 57161. Here, the most striking feature is an extra signal with fractional amplitude at d. This is similar, but not identical, to the orbital period inferred from the timing solution, or self-consistently from our data using the ellipsoidal variations.
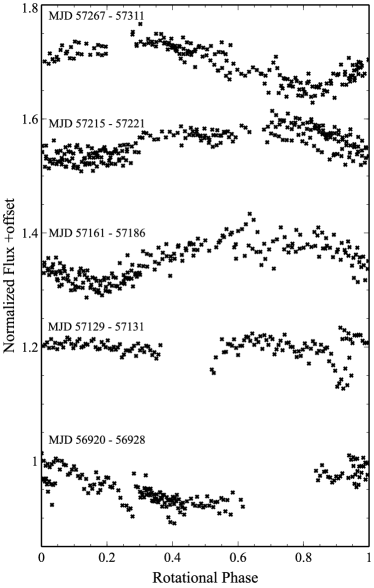
In Figure 4 we plot sequences of the residual signal folded at , after subtracting the ellipsoidal variation inferred in §3.1. Interestingly, the shape of the residual evolves over time and occasionally deviates significantly from a sine. We believe that the most obvious explanation for this phenomenology is stellar activity, in which case traces stellar rotation. Each sequence in Figure 4 must correspond to a distinct group of star-spots. Overall, we find evidence for 8 spots with lifetimes ranging between 3 and 45 days. Generally, after the drop in average flux on MJD 57161, the minima appear to be deeper and more persistent.
Evidently, the signal does not maintain coherence over time and therefore our estimate for above must be biassed. Repeating the frequency analysis for the three largest and most persistent star-spots (the three upper sequences in Figure 4) yields: days respectively, and a weight-averaged spin-to-orbital-period ratio of,
| (2) |
using our self-consistent estimate for from §3.1. In averaging, we assume rigid rotation, given that the photometric precision and cadence do not suffice to to resolve differential rotation. We further discuss this result in the following section.
4 Ramifications
To our knowledge, the data presented here establish the most densely-sampled photometric lightcurve for any eclipsing binary pulsar to date, also providing the first direct inference of the spin rate for any MPS companion. As shown in §3.2, there is clear evidence for asynchronous rotation. Here we explore some of the ramifications of our measurements in more detail.
4.1 System parameters
PSR J17232837 hosts an MSP, and hence it is reasonable to expect that the system went through at least one phase of Roche-lobe overflow during which the companion was tidally locked. If one assumes that the spin-up of the companion was caused by a recent contraction, e.g. due to a reconfiguration of the internal magnetic field on a dynamical timescale (Matese & Whitmire, 1983; Applegate, 1992), then the rotational rate inferred above relates directly to the Roche-lobe filling factor,
| (3) |
In practice, the tidal torque is acting to spin-down the star, while an additional magnetic torque may also influence the spin evolution. In any case, the torque-free assumption should yield a reliable upper limit for the filling factor.
Adopting , one can use the constraints on ellipsoidal variations and to derive an estimate on the inclination and component masses, since , where the latter is also a function of (Eggleton, 1983). Using from Crawford et al. (2013) we infer ; with the more precise estimate, from our follow-up work (Antoniadis et al., in prep.),
| (4) |
and, through the binary mass function (Crawford et al., 2013), M⊙ and M⊙.
For low-mass, slightly evolved stars with K and dex, spherically symmetric model atmospheres convolved with the Kepler bandpass (which is similar to that of our CCD) yield gravity and limb-darkening coefficients that imply (e.g. Neilson & Lester, 2013, and references therein). This would suggest a low-mass neutron star with M⊙. If , then the pulsar mass should be even lower.
Obviously, there are several caveats related to this analysis. For instance, the tidal deformation is treated perturbatively. Given the amplitude of the signal and the almost perfectly symmetrical maxima, this should be a adequate approximation (i.e. higher-order terms should be small). In addition, the estimate for may differ substantially for non-symmetric Roche-lobe filling stars. From Eq. 4 one sees that a massive (e.g. M⊙) would require an effective .
A more realistic estimate for the system’s geometry can be obtained through a detailed numerical model. We modeled the quiescent lightcurve with the nightfall444http://www.hs.uni-hamburg.de/DE/Ins/Per/Wichmann/Nightfall.html lightcurve-synthesis code (Wichmann, 1998), using , and as free parameters, while keeping the mass-ratio fixed to our spectroscopic estimate. The flux was calculated using tabulated NextGen atmospheres with dex, integrated over the Bessel bandpass. This analysis yields overall consistent results, with , , K, and , which agree well with our semi-analytic estimate, but imply an even lower pulsar mass at face value. The best-fit synthetic lightcurve is shown in Figure 2b. In conclusion, while both the analytic and numerical constraints for the component masses may be biased, the inferred pulsar mass is rather typical and consistent with the MSP masses observed in nature (e.g. Antoniadis et al., 2016).
4.2 Irradiation and intra-binary shocks
Interestingly, in X-rays, PSR J17232837 shows evidence for non-thermal emission modulated at the orbital period Bogdanov et al. (2014a). This hints to the presence of an intra-binary shock front which, if persistent, could lead to indirect heating of the companion (Romani & Sanchez, 2016). In §3.1 we discuss evidence for that based on a small signal with a maximum misaligned with inferior conjunction during quiescent periods. Even though our estimates are likely contaminated by residual surface activity, taken at face value they still imply a relatively small irradiation efficiency (% adopting a surface temperature of K and a spin-down luminosity of erg s-1 from Crawford et al. (2013)). An additional significant source of uncertainty here is the kinematic contribution to for the pulsar, which thus far remains unconstrained (Crawford et al., 2013).
In summary, must be small, but our data do not suffice provide useful constraints. We do however believe that misinterpretation of time-series optical photometry may lead to overestimates for the irradiation efficiency for other systems.
4.3 Relation to other eclipsing MSPs
While surface activity has not been confidently detected in other binary MSPs, in retrospect, a few systems share striking similarities with PSR J17232737 suggesting that this may be a common property of eclipsing MSPs. For instance Bellm et al. (2016) report a similar secular change in average flux for PSR J21290429, and a sine term at the fundamental, which they discuss in the context of relativistic beaming; Deneva et al. (2016) also observe a similar signal in PSR J1048+2339, while Li et al. (2014) note that a combination of ellipsoidal variations, heating and starspot activity is required to explain the lightcurve of PSR J16282305. Finally, Romani et al. (2015) find spectroscopic evidence for photospheric eruptions in the black-widow system PSR 13113430.
In addition,the long-term timing properties of several systems, including PSRs J1023+0038 (Archibald et al., 2013), J20510827 (Shaifullah et al., 2016), J22390533 (Pletsch & Clark, 2015) and B1957+20 (Applegate & Shaham, 1994) provide further indirect evidence for magnetized secondaries (Applegate, 1992). More generally, a magnetic field would also lead to an enhanced stellar wind, thereby providing a possible mechanism to explain the radio eclipses, even in cases where the secondary is under-filling its Roche lobe and the pulsar irradiation is negligible.
The presence of strong magnetic fields in all redback companions would not be surprising, as rotation is believed to enhance the stellar dynamo (Berdyugina, 2005). Both young stars in open clusters and late-type rapid rotators in binaries show evidence for persistent large spots even at high latitudes and close to their polar caps (Berdyugina, 2005; Korhonen, 2012). Stellar rotation also influences the duration of magnetic cycles, with faster rotation often leading to shorter activity lengths (Saar & Brandenburg, 1999; Wright et al., 2011). If those cycles regulate the stellar wind, they could therefore lead to variable mass outflows with timescales similar to those of the MSP state transitions.
References
- Antoniadis et al. (2016) Antoniadis, J., Tauris, T. M., Ozel, F., et al. 2016, ArXiv e-prints, arXiv:1605.01665
- Applegate (1992) Applegate, J. H. 1992, ApJ, 385, 621
- Applegate & Shaham (1994) Applegate, J. H., & Shaham, J. 1994, ApJ, 436, 312
- Archibald et al. (2013) Archibald, A. M., Kaspi, V. M., Hessels, J. W. T., et al. 2013, ArXiv e-prints, arXiv:1311.5161
- Archibald et al. (2009) Archibald, A. M., Stairs, I. H., Ransom, S. M., et al. 2009, Science, 324, 1411
- Bassa et al. (2014) Bassa, C. G., Patruno, A., Hessels, J. W. T., et al. 2014, MNRAS, 441, 1825
- Beech (1989) Beech, M. 1989, Ap&SS, 152, 329
- Bellm et al. (2016) Bellm, E. C., Kaplan, D. L., Breton, R. P., et al. 2016, ApJ, 816, 74
- Benvenuto et al. (2014) Benvenuto, O. G., De Vito, M. A., & Horvath, J. E. 2014, ApJ, 786, L7
- Berdyugina (2005) Berdyugina, S. V. 2005, Living Reviews in Solar Physics, 2, doi:10.1007/lrsp-2005-8
- Bogdanov et al. (2014a) Bogdanov, S., Esposito, P., Crawford, III, F., et al. 2014a, ApJ, 781, 6
- Bogdanov et al. (2014b) Bogdanov, S., Patruno, A., Archibald, A. M., et al. 2014b, ApJ, 789, 40
- Breton et al. (2013) Breton, R. P., van Kerkwijk, M. H., Roberts, M. S. E., et al. 2013, ApJ, 769, 108
- Chen et al. (2013) Chen, H.-L., Chen, X., Tauris, T. M., & Han, Z. 2013, ApJ, 775, 27
- Crawford et al. (2013) Crawford, F., Lyne, A. G., Stairs, I. H., et al. 2013, ApJ, 776, 20
- de Martino et al. (2014) de Martino, D., Casares, J., Mason, E., et al. 2014, MNRAS, 444, 3004
- Deneva et al. (2016) Deneva, J. S., Ray, P. S., Camilo, F., et al. 2016, ApJ, 823, 105
- Eggleton (1983) Eggleton, P. P. 1983, ApJ, 268, 368
- Faulkner et al. (2004) Faulkner, A. J., Stairs, I. H., Kramer, M., et al. 2004, MNRAS, 355, 147
- Korhonen (2012) Korhonen, H. 2012, in IAU Symposium, Vol. 286, Comparative Magnetic Minima: Characterizing Quiet Times in the Sun and Stars, ed. C. H. Mandrini & D. F. Webb, 268–278
- Li et al. (2014) Li, M., Halpern, J. P., & Thorstensen, J. R. 2014, ApJ, 795, 115
- Lomb (1976) Lomb, N. R. 1976, Ap&SS, 39, 447
- Matese & Whitmire (1983) Matese, J. J., & Whitmire, D. P. 1983, A&A, 117, L7
- Morris & Naftilan (1993) Morris, S. L., & Naftilan, S. A. 1993, ApJ, 419, 344
- Neilson & Lester (2013) Neilson, H. R., & Lester, J. B. 2013, A&A, 554, A98
- Papitto et al. (2013) Papitto, A., Ferrigno, C., Bozzo, E., et al. 2013, Nature, 501, 517
- Patruno et al. (2014) Patruno, A., Archibald, A. M., Hessels, J. W. T., et al. 2014, ApJ, 781, L3
- Pletsch & Clark (2015) Pletsch, H. J., & Clark, C. J. 2015, ApJ, 807, 18
- Roberts (2013) Roberts, M. S. E. 2013, in IAU Symposium, Vol. 291, Neutron Stars and Pulsars: Challenges and Opportunities after 80 years, ed. J. van Leeuwen, 127–132
- Roberts et al. (2015) Roberts, M. S. E., McLaughlin, M. A., Gentile, P. A., et al. 2015, ArXiv e-prints, arXiv:1502.07208
- Romani et al. (2015) Romani, R. W., Filippenko, A. V., & Cenko, S. B. 2015, ApJ, 804, 115
- Romani & Sanchez (2016) Romani, R. W., & Sanchez, N. 2016, ArXiv e-prints, arXiv:1606.03518
- Roy et al. (2015) Roy, J., Ray, P. S., Bhattacharyya, B., et al. 2015, ApJ, 800, L12
- Saar & Brandenburg (1999) Saar, S. H., & Brandenburg, A. 1999, ApJ, 524, 295
- Scargle (1982) Scargle, J. D. 1982, ApJ, 263, 835
- Shaifullah et al. (2016) Shaifullah, G., Verbiest, J. P. W., Freire, P. C. C., et al. 2016, ArXiv e-prints, arXiv:1607.04167
- Stappers et al. (2014) Stappers, B. W., Archibald, A. M., Hessels, J. W. T., et al. 2014, ApJ, 790, 39
- Tendulkar et al. (2014) Tendulkar, S. P., Yang, C., An, H., et al. 2014, ApJ, 791, 77
- Wichmann (1998) Wichmann, R. 1998, Nightfall User Manual, ,
- Wright et al. (2011) Wright, N. J., Drake, J. J., Mamajek, E. E., & Henry, G. W. 2011, ApJ, 743, 48