CTEQ-TEA parton distribution functions and HERA Run I and II combined data
Abstract
We analyze the impact of the recent HERA Run I+II combination of inclusive deep inelastic scattering cross-section data on the CT14 global analysis of parton distribution functions(PDFs). New PDFs at next-to-leading order and next-to-next-to-leading order, called CT14, are obtained by a refit of the CT14 data ensembles, in which the HERA Run I combined measurements are replaced by the new HERA Run I+II combination. The CT14 functional parametrization of PDFs is flexible enough to allow good descriptions of different flavor combinations, so we use the same parametrization for CT14 but with an additional shape parameter for describing the strange quark PDF. We find that the HERA I+II data can be fit reasonably well, and both CT14 and CT14 PDFs can describe equally well the non-HERA data included in our global analysis. Because the CT14 and CT14 PDFs agree well within the PDF errors, we continue to recommend CT14 PDFs for the analysis of LHC Run 2 experiments.
pacs:
12.15.Ji, 12.38 Cy, 13.85.QkI Introduction
CT14 parton distribution functions (PDFs) Dulat:2015mca are obtained in a global analysis of a variety of hadronic scattering experimental data. They are suitable for general-purpose QCD calculations at the Large Hadron Collider (LHC) and in other experiments. The previous generation of general-purpose PDFs from CTEQ-TEA (CT) group, designated as CT10 Gao:2013xoa ; Lai:2010vv , was used in a wide range of analyses in hadron collider phenomenology. The CT10 PDFs were based on diverse experimental data from fixed-target experiments, HERA and the Tevatron collider, but without data from the LHC. The CT14 global analysis represents the upgrade of the CT10 fit and includes data from the LHC Run I, as well as updated data from the Tevatron and HERA experiments. The CT14 PDF sets are available at LHAPDF LHAPDF together with recent PDF parametrizations from other groups Harland-Lang:2014zoa ; Ball:2014uwa ; Alekhin:2013nda ; Jimenez-Delgado:2014twa . The latest version of the PDF4LHC recommendation Butterworth:2015oua provides users with a consistent procedure on how to combine the CT14, NNPDF, and MMHT PDF sets in phenomenological analyses.
The CT14 PDFs are determined from data on inclusive high-momentum transfer processes, for which perturbative QCD is expected to be reliable. For example, in the case of deep-inelastic lepton scattering (DIS), only data with GeV and GeV2 are used, where mass squared of the final state hadronic system . Data in this region are expected to be relatively free of nonperturbative effects, such as higher-twist or nuclear corrections. In the global analysis, the HERA Run I inclusive DIS measurements have imposed important PDF constraints in the CT10 and CT14 analyses.
In 2015, the H1 and ZEUS collaborations released a novel combination of measurements of inclusive deep-inelastic scattering cross sections at collider HERA Abramowicz:2015mha . We refer to this data ensemble as HERA2 throughout this paper, to be distinguished from the previous combination of HERA data sets on DIS published in 2009 Aaron:2009aa , which we call HERA1. HERA2 is the combination of HERA Run I measurements of about 100 pb-1 of and 15 pb-1 of data, and Run II measurements of 150 pb-1 of and 235 pb-1 of data, resulting in a total integrated luminosity of approximately 500 pb-1. The individual H1 and ZEUS measurements used in the combination were published previously in Refs. Aaron:2009bp ; Aaron:2009kv ; Adloff:1999ah ; Adloff:2000qj ; Adloff:2003uh ; Aaron:2012qi ; Andreev:2013vha ; Collaboration:2010ry and Breitweg:1997hz ; Breitweg:2000yn ; Breitweg:1998dz ; Chekanov:2001qu ; Breitweg:1999aa ; Chekanov:2002ej ; Chekanov:2002zs ; Chekanov:2003yv ; Chekanov:2003vw ; Chekanov:2009gm ; Chekanov:2008aa ; Abramowicz:2012bx ; Collaboration:2010xc ; Abramowicz:2014jak . The two collaborations employed different experimental techniques and used different detectors and methods for kinematic reconstruction. Therefore the new HERA2 combined measurements exhibit a significantly reduced systematic uncertainty.
The main goal of this paper is to analyze the impact of the HERA2 measurements on the CT14 global analysis. We replace the combined HERA1 data set used in the published CT14 PDFs Dulat:2015mca with the HERA2 set and examine the resulting changes in PDF central values and uncertainties. Also, we study the dependence of the goodness of fit upon kinematic cuts on and , as it was suggested Abramowicz:2015mha that the low- HERA2 data are not well fitted by the CT10 and CT14 PDFs. Related studies of the impact of HERA2 data in the context of MMHT14 and NNPDF3.0 fits can be found in Refs. Harland-Lang:2016yfn ; Thorne:2015caa ; Rojo:2015nxa .
To this end, the CTEQ-TEA PDFs have been refitted at next-to-leading order (NLO) and next-to-next-to-leading order (NNLO) by using the global CT14 data ensemble, but with the HERA2 measurements in place of HERA1. The new PDFs obtained after the refitting procedure are named CT14, to distinguish from CT14. The HERA2 data set has 1120 data points in the fitted region with GeV and GeV2. There are 162 correlated systematic errors, and seven procedural uncertainties, in addition to the luminosity uncertainty. When HERA2 is included in the global fit, there are in total 3287 data points in the CT14HERA2 data ensembles, compared to 2947 in the original CT14 fits. This is because two other changes have been made in the data analysis. First, we have dropped the New Muon Collaboration (NMC) muon-proton inclusive DIS data on Arneodo:1996qe , because that data cannot be fitted well. As concluded in Ref. Pumplin:2002vw , the NMC proton data are influenced by some unknown or underestimated systematic errors. Meanwhile, we continue to include the NMC proton to deuteron ratio data on . Second, we updated the data table for the CMS 7 TeV inclusive jet experiment Chatrchyan:2012bja , which became available after the completion of the CT14 study, without appreciable effects on the PDFs.
As in CT14 Dulat:2015mca , the theoretical predictions for the majority of processes in the CT14HERA2 fit are calculated at the NNLO level of accuracy. In particular, a NNLO treatment Guzzi:2011ew of heavy-quark mass effects in neutral-current(NC) DIS is realized in the S-ACOT- scheme Aivazis:1993kh ; Aivazis:1993pi ; Collins:1998rz ; Tung:2001mv and is essential for obtaining correct predictions for LHC electroweak cross sections Gao:2013wwa ; Lai:2010nw ; Nadolsky:2008zw ; Tung:2006tb . However, the calculations for charged-current(CC) DIS and inclusive jet production are included at NLO only; in both cases, the complete NNLO contributions are not yet available. In Sec. II of Ref. Dulat:2015mca , we presented various arguments suggesting that the expected impact of the missing NNLO effects in jet production on the PDFs is small relative to current experimental errors. Similarly, the NNLO contribution to charged-current DIS, including massive charm scattering contributions Berger:2016inr , is modest compared to the experimental uncertainties.
It is useful to review quickly the advances in the CT14 global analysis, compared to CT10. Regarding data: The new LHC measurements of and cross sections Aad:2011dm ; Chatrchyan:2013mza ; Aaij:2012vn directly probe flavor separation of and partons in an -range around that was not directly assessed by earlier experiments. The updated measurements of electron charge asymmetry from the DØ collaboration D0:2014kma probe the quark PDF at . These measurements are included in the CT14 and CT14HERA2 analyses. Regarding parametrization: In the CT14 analysis, the description of variations in relevant PDF combinations, such as and , is improved, as compared to CT10, by increasing the number of free PDF parameters from 25 to 28. The functional form for the initial scale PDFs adopted by the CT14 fit is parametrized by Bernstein polynomials (reviewed in the Appendix of Ref. Dulat:2015mca ) which have the property that a single polynomial is dominant in any given range, hence reducing undesirable correlations among the PDF parameters that sometimes occurred in CT10. Also, in the asymptotic limits of or , the CT14 functional forms allow the ratios of or to reach any values, so that these ratios are determined by the global fit; this is in contrast to the more constrained behavior of those PDF ratios assumed in the CT10 parametrization forms.
The CT14HERA2 fit adopts the same functional form for the initial scale parametrization as CT14, except for the strange quark and antiquark PDFs. More specifically, in the CT14 analysis, we have used the CT14 PDF functional form Dulat:2015mca at the initial scale ,
| (1) |
where the functions are linear combinations of Bernstein polynomials. In the CT14 fit Dulat:2015mca , the strange quark PDF is parametrized according to Eq. (1), with being a constant. There, we have tied to the common of and , and assumed in the analysis. Thus, we have just two parameters for the strange quark and antiquark PDFs in our standard CT14 analysis: and normalization. With this limitation on , we find that it is necessary to extend the strange quark uncertainty by adding two “extreme strange” PDFs to the set of Hessian error PDFs. In the CT14 PDFs, we use a different technique to avoid underestimating the strangeness uncertainty provided by the Hessian error PDF set: while in the published CT14 PDFs, we set ; in the CT14HERA2 fit, we allow to differ from . By freeing the parameter , we find that it is not necessary to construct additional extreme strange quark PDFs. So, whereas the CT14 error PDFs include two extreme strange and two extreme gluon PDFs, the CT14 error PDFs include only two extreme gluon PDFs to model the uncertainty of gluon PDFs in the very small region. Thus the total number of error PDFs is the same for CT14 and CT14, viz. 56 error PDFs.
To summarize, we use this parametrization, differing from the standard CT14 parametrization Dulat:2015mca only by the addition of one free parameter for ; and we refit the CT14 data set, with the HERA1 combined data replaced by the HERA2 combination, after dropping the NMC muon-proton inclusive DIS data on Arneodo:1996qe and correcting the data table for the CMS 7 TeV inclusive jet experiment Chatrchyan:2012bja .
The rest of the paper summarizes findings of the CT14HERA2 global analysis, presented in several parts:
-
•
Section 2 concerns the goodness-of-fit for this new QCD global analysis with special emphasis on the quality of the fit to the HERA2 combined data. We find a large value of for a subset of the HERA2 measurements, from scattering, and we discuss the origin of this increase.
-
•
Section 3 describes a study of the role of HERA2 data points at low . This is studied by excluding low- data points and refitting the PDFs.
-
•
Section 4 concerns the changes of the PDFs themselves. We find some changes from CT14 to CT14HERA2 , but they are not significant within the standard CTEQ estimates of PDF uncertainties.
-
•
Section 5 is a summary of our conclusions.
In the end, we find that the differences between CT14 and CT14 PDFs are smaller than the uncertainties of the PDFs, as estimated by the Hessian method of error propagation. For this reason we reckon that the standard CT14 PDFs should continue to be used for making predictions to compare against current and future LHC data. However, we will make the CT14 PDFs available in the LHAPDF format for specialized studies, such as those that are sensitive to behavior of strange (anti)quark PDFs.
II The Global analysis with the final HERA2 combined Data
As we explained in the introduction, when constructing a PDF ensemble for general-purpose applications, the CTEQ-TEA global analysis selects the experimental data points at large enough and , where contributions beyond the leading-twist QCD are reduced. With the default lower cut on the selected data points, GeV, the HERA1 ensemble contains 579 data points, while that of HERA2 contains 1120 data points. In Table 1 we summarize the results for the total values of the HERA1 combined data (column 2) and HERA2 combined data (column 3), for both NLO and NNLO approximations of QCD. The rows CT14(NLO) and CT14(NNLO) use the published CT14 PDFs, with no refitting; they were fit with HERA1 data. The rows NLO10, NLO55, NNLO10 and NNLO55 are refits with a slightly more flexible parametrization for the strange quark PDF and the inclusion of the non-HERA data sets, as described in Sec. I; NLO10 and NNLO10 use only HERA1 data; NLO55 and NNLO55 use HERA1 data with weight 0.5 and HERA2 data with weight 0.5 in the global sum. The rows and use the same parametrization and non-HERA data as NLO10 and NNLO10, but they use only HERA2 data. Note that increases, and decreases, as we vary the balance of HERA1 and HERA2 data used in the analysis, from weights to to . However, the changes are not large, given the number of data points, 579 and 1120 respectively. We have also compared the values for non-HERA data for the new fits, and we find that is essentially unchanged as we vary the balance of HERA1 and HERA2 data, with the three weighting choices. This shows that the HERA1 and HERA2 data sets are equally consistent with the non-HERA data.
| (wt); | (wt); | |
| CT14(NLO) | 590 | 1398 |
| NLO10 | 576 (1.0) | 1404 (0.0) |
| NLO55 | 586 (0.5) | 1374 (0.5) |
| CT14 | 595 (0.0) | 1373 (1.0) |
| CT14(NNLO) | 591 | 1469 |
| NNLO10 | 583 (1.0) | 1458 (0.0) |
| NNLO55 | 596 (0.5) | 1411 (0.5) |
| CT14 | 610 (0.0) | 1402 (1.0) |
Furthermore, we find that the NLO fit has a lower value of global than the NNLO fit. This is a robust result: it is independent of whether a HERA1 or HERA2 data set is used. It is also still true if , , and are varied as free parameters—separately, of course, for NLO and NNLO. The conclusions still hold if the kinematic cut is raised, cf. Sec. III.
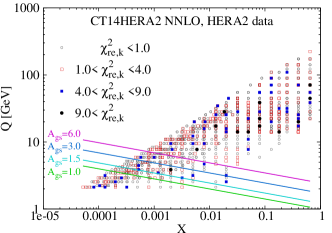
In order to understand the impact of the HERA2 data, we focus on some more detailed quantitative studies in Figs. 1-3. Considering the value of the global per number of points (), i.e., the overall goodness of fit for the QCD global analysis, we find to be 1.07 and 1.09, respectively, at the NLO and NNLO, which is about the same as for the standard CT14 global analysis Dulat:2015mca . However, the values of for the HERA2 data after refitting are found to be 1.22 and 1.25, respectively, at the NLO and NNLO. (For comparison, the for the HERA Run I ensemble data in the CT14 fits is about 1.02 at either NLO or NNLO.) These large values of raise a question: do they come from a few isolated data points, or from a systematic difference between data and theory? To address this question, in Fig. 1 we show the distribution of the reduced- () values for individual data points, as they are distributed over the kinematic plane.
The definition of is, for an individual data point (),
| (2) |
where is the central data value, is the theory value, is the uncorrelated error, and the sum over is an effective shift in the central value caused by optimized systematic nuisance parameters . [See, e.g., Eq. (4) in the original CT10 analysis. Lai:2010vv .] Thus, represents our best measure for the difference between data and theory for the th data point. The total for the experimental data set quoted in Table 1 (where exp stands for HERA1 or HERA2) is obtained by summing over all experimental points and adding the penalty for deviations of the optimized nuisance parameters from their central values at 0,
| (3) |
To identify the source of the elevated total for the HERA2 ensemble, we first scrutinize the contributions from the individual points. Figure 1 illustrates the values of when the HERA1 data are compared to the CT14 (NLO and NNLO) theory, and the HERA2 data are compared to CT14 (NLO and NNLO) theory. The bottom-right inset also shows different values of the geometric scaling variable that are discussed in Sec. III.
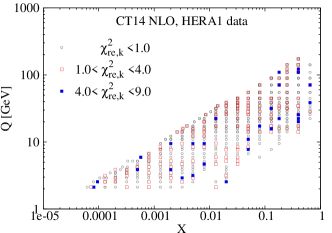
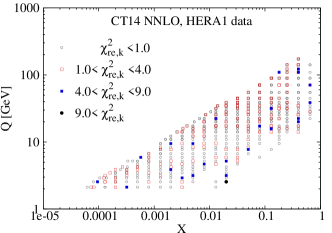
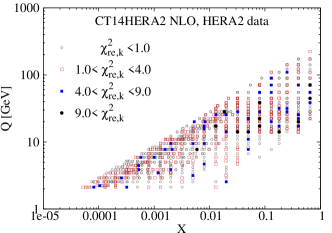
In the subfigures for HERA2 (either at NLO or NNLO), we notice that points with are rather uniformly distributed throughout the phase space, without being concentrated in a particular region. In other words, the elevated values of in Table 1 do not arise from a single kinematic region.
II.0.1 Varied statistical weights for the HERA2 data
An interesting way to assess the impact of the HERA2 combined data is to vary the weight given to this data set in the global function. Namely, we increase the statistical weight of the HERA2 data; that is, we include , with , instead of the default (with ), into the global function . The purpose here is to see whether increasing the HERA2 weight will induce large changes in the PDFs.
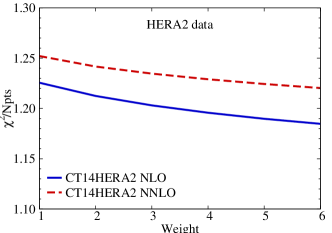
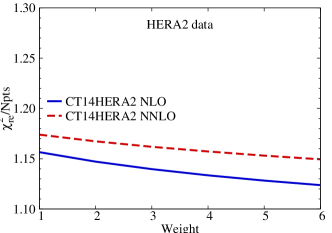
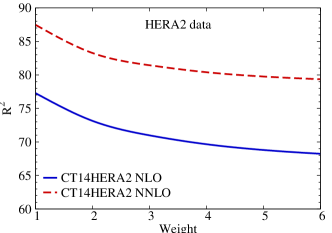
First, we examine how increasing the weight of HERA2 data reduces for the HERA2 data. Figure 2 shows for the HERA2 combined data () with CT14HERA2 -like fits generated with weight factor varying from 1 to 6, at both NLO and NNLO accuracy. The upper-left plot shows ; the upper-right plot shows ; and the lower one shows , the sum of the quadratic penalties on the optimized systematic shifts in our treatment of correlated systematic errors as nuisance parameters Lai:2010vv . Of course, increasing the weight of the HERA2 data must cause to decrease for that data. But the change of is not large—only about for a factor of 6 extra weighting. The results are similar for NLO and NNLO.
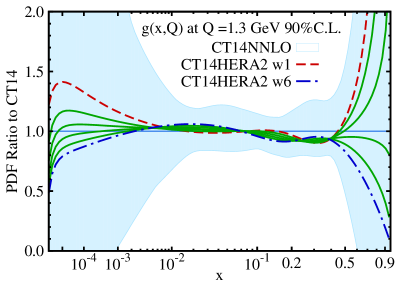
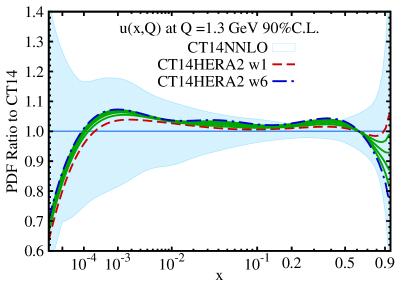
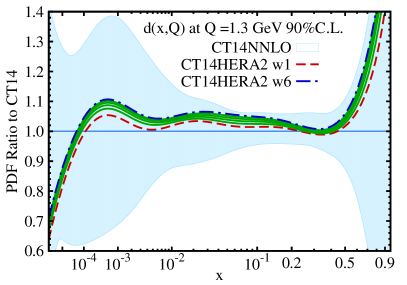
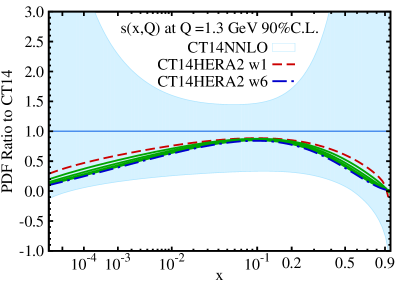
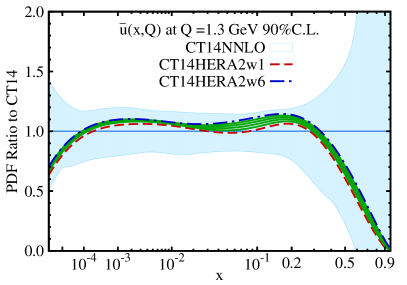
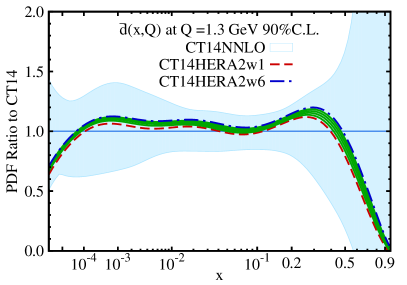
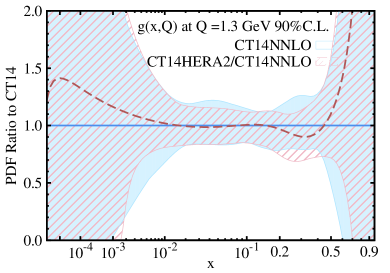
Secondly, as the weight of the HERA2 data set is increased, the resulting PDFs change, too. Figure 3 illustrates this, by plotting the ratio of the CT14 PDF to the CT14 PDF, as a function of the weight factor assigned to the HERA2 data. The HERA2 weights range from 1 to 6. The uncertainty band of the CT14 PDF is also shown, evaluated at the 90% confidence level (C.L.). All PDFs are plotted at GeV. For the gluon, as the HERA2 weight increases, the CT14 PDF decreases at and decreases rapidly at ; for intermediate values, varies by a few percent. For the up quark, the PDF exhibits a modest fractional increase in the central region (for ) relative to its PDF error band, as the HERA2 weight increases. The down quark PDF has a similar behavior for but with larger magnitude of variation than the up quark. Similarly, for the up antiquark, the PDF exhibits a modest fractional increase for around to , as the HERA2 weight increases; and the down antiquark PDF has a similar increase for around . In contrast to the up and down flavors, the strange quark PDF is reduced relative to CT14. The reduction of is mainly caused by freeing the parameter . But, as we weight the HERA2 data more heavily, decreases even further. We note that the same conclusion also holds for the CT14 NLO PDFs.
III Impact of data selection cuts on the fit to HERA2 Data
The HERA2 publication Abramowicz:2015mha found that both HERAPDF2.0 PDFs and values depend significantly on the choice of , the minimum value of the four-momentum-transfer in the HERA2 analysis. In this section we explore the impact of variations of on the CT14HERA2 global analysis.
We perform multiple fits of CT14HERA2 PDFs, in which is varied from 2 to 6 GeV, and compare the results to the previous findings of the CT14 analysis. For every choice of , we report the total , reduced (i.e., ), and systematic shift penalty defined by Eq. (3), together with the number of data points in parentheses. Tables 2 and 3 show these quantities for the HERA1 and HERA2 data, compared to the theoretical predictions based on CT14 NNLO and CT14HERA2 NNLO PDFs, respectively. The lower parts of each table show the breakdown of and numbers of points over the four contributing DIS subprocesses, in NC and CC interactions: NC , NC , CC , and CC .
In the CT14 analysis the subsets of HERA1 data have small values of , as shown in Table 2. For the processes, is less than ; for the processes, is approximately . Also, there is no dependence on , except for a small decrease in for the case of NC . The total decreases with because the NC subset dominates the total. We conclude that, for the CT14/HERA1 analysis, the standard choice GeV is not qualitatively different from the other choices in the 2 to 6 GeV range.
| [GeV] | No cut | 2.00 | 3.87 | 4.69 | 5.90 |
|---|---|---|---|---|---|
| (647) | 1.02 (579) | 0.93 (516) | 0.93 (493) | 0.91 (470) | |
| 0.43(48.80) | 0.24(27.34) | 0.25(28.38) | 0.25(28.48) | ||
| (647) | 0.94 (579) | 0.89 (516) | 0.87 (493) | 0.84 (470) | |
| NC | (434) | 1.05 (366) | 0.96 (303) | 0.96 (280) | 0.92 (257) |
| NC | (145) | 0.74 (145) | 0.75 (145) | 0.75 (145) | 0.75 (145) |
| CC | (34) | 0.97 (34) | 0.98 (34) | 0.99 (34) | 0.99 (34) |
| CC | (34) | 0.53 (34) | 0.53 (34) | 0.53 (34) | 0.53 (34) |
In the CT14HERA2 /HERA2 analysis (Table 3), the values of are larger than 1 for the subprocesses, and much larger in the cases of scattering. The PDFs for the different columns of Table III were refitted for each choice of . Even with the refitting, the values of remain large. The dependence of on is small for NC and negligible for the other three cases.
| [GeV] | No cut | 2.00 | 3.87 | 4.69 | 5.90 |
|---|---|---|---|---|---|
| (1306) | 1.25 (1120) | 1.19 (967) | 1.21 (882) | 1.23 (842) | |
| 0.51 (87.47) | 0.29(49.11) | 0.29 (48.99) | 0.29 (49.40) | ||
| (1306) | 1.17 (1120) | 1.14 (967) | 1.15 (882) | 1.18 (842) | |
| NC | (1066) | 1.11 (880) | 1.06 (727) | 1.06 (642) | 1.09 (602) |
| NC | (159) | 1.45 (159) | 1.44 (159) | 1.45 (159) | 1.45 (159) |
| CC | (39) | 1.10 (39) | 1.10 (39) | 1.10 (39) | 1.10 (39) |
| CC | (42) | 1.52 (42) | 1.50 (42) | 1.50 (42) | 1.50 (42) |
In contrast to CT14, in the CT14HERA2 analysis we see only small variations in with the four values of . We note that the apparent large change in from of 2 to 3.87 GeV, as shown in the second row of Table 3, is due to the change in values in the third row. Recall that is given by the sum of , which changes little, and , which decreases from 2 GeV to 3.87 GeV. With a larger value, at 3.87 GeV, there are fewer data points to be fit with the same number of correlated systematic errors (170 in the CT14HERA2 analysis), hence it leads to a smaller value, from 0.51 to 0.29.
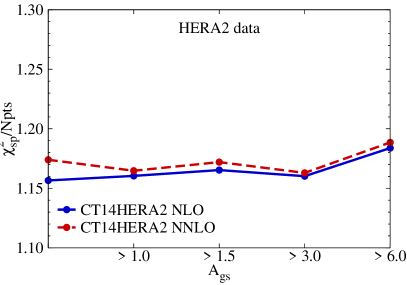
Figure 4 shows the results on versus of Table 3 in graphical form. The behavior of for the HERA2 data (sum of all four subprocesses) is illustrated in the left panels of Fig. 4. The graphs show the dependence on in the CT14HERA2 analysis at both NLO and NNLO. The upper panel is and the middle panel is the reduced , versus . The values of for the HERA2 data exhibit a shallow minimum for in the range GeV. The reduction of at GeV, compared to our standard choice of GeV, from 1.17 to 1.15, does not seem significant. An interesting feature of the graphs is that near the minimum the NNLO and NLO results are equal, whereas NNLO has slightly larger on either side of the minimum.
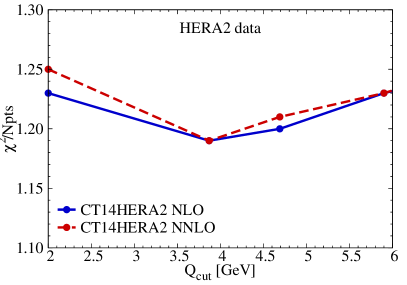
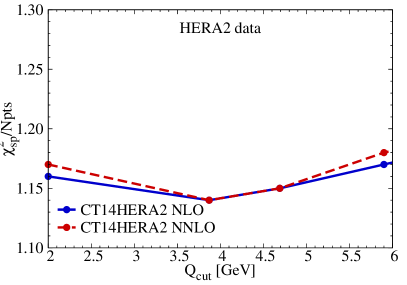
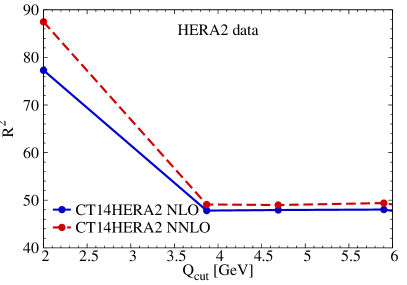
The lower panel in Fig. 4 shows , the total quadratic penalty for the systematic errors, as a function of . The value of decreases significantly from = 2 GeV to 3.87 GeV, from 87 to 49. For ideal Gaussian systematic errors we would expect for 170 systematic errors. When the low- data points are discarded by the cut, the systematic errors become less important. However, this reduction of is shared by 1120 total data points, so the overall net change in is mild.
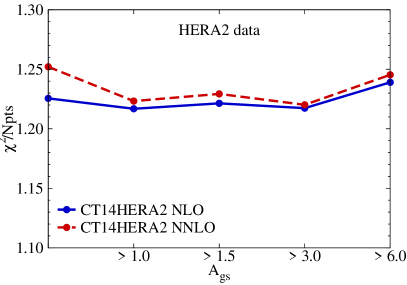
III.0.1 Dependence on the geometric rescaling variable
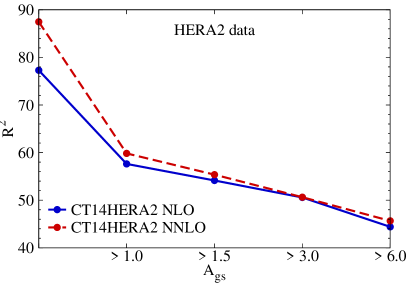
While Fig 4 examines dependence of fits on cuts that are imposed independently of the Bjorken value, it is as instructive to consider the dependence of on correlated cuts in and . For this purpose we define the geometric scaling variable , where is a parameter set equal to in this study Stasto:2000er ; Caola:2009iy ; Lai:2010vv . The variable can be utilized to explore the impact of data in kinematic regions of both small and small . We can test whether the goodness of fit improves if we exclude data at small . The variable has been used in previous analyses to search for possible deviations from DGLAP evolution due to saturation or small- related phenomena Stasto:2000er ; Caola:2009iy . The basic method is to (i) generate PDFs using data in the kinematic region above the cut in the and plane, where the NLO/NNLO DGLAP factorization is supposed to be valid; (ii) then use DGLAP evolution equations to evolve these PDFs down to the low- and region below the cut, where one might expect possible deviations; (iii) finally, compare predictions to the data in the low region, which was not used for PDF determination. The portion of HERA2 data that is excluded by varying from 1.0 to 6.0 is shown in Fig. 1 (the lower right inset). The results of the fits for various choices of , at both NLO and NNLO accuracy, are illustrated in the right panels of Fig. 4. (The upper panel is , the middle panel is reduced , and the lower panel is .) The values of for four choices of are shown. Here, we consider only data points with values greater than 2 GeV in order to validate the application of the perturbative DGLAP evolution equation. We find that the behavior of has small variations, and they are not monotonic. Hence, we conclude that our analysis of HERA2 data does not indicate clear deviations from DGLAP evolution. Alternatively, one could include also the data points below the cut (though still with GeV) in the calculation of in the final comparison while fitting only the data above the cut. We found a similar conclusion as that carried out for the CT10 NLO PDFs, as shown in the appendix of Ref. Lai:2010vv . For example, the value of of the combined HERA2 data set, with , increases by about units as compared to that without any cut. This result does not change much even when we use a more flexible gluon PDF, by introducing one more nonperturbative shape parameter, in the fit. Furthermore, the value of for the NLO fit is larger than the NNLO fit by about 0.1 unit, which is about the same size as the variation from including the cut in the fit. This is comparable with the usual uncertainties and consistent with the above conclusion that the HERA2 data do not show clear deviations from DGLAP evolution.
IV Comparison of CT14 and CT14 PDFs
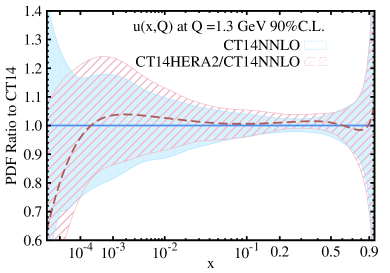
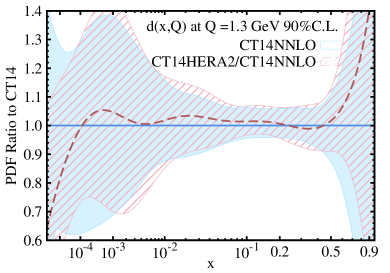
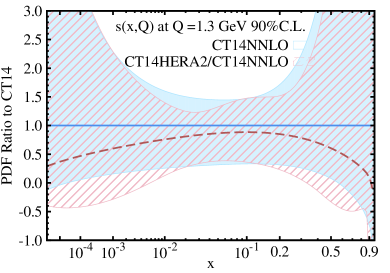
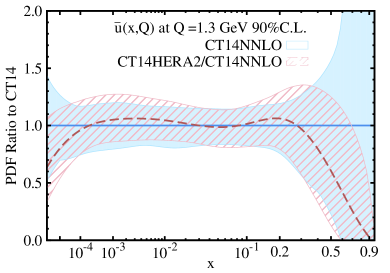
In this section we describe the changes in central values and uncertainties of CT14 PDFs, which are obtained from our global analysis with the weight of HERA2 data set to be 1, compared to CT14 PDFs. Here, is equal to the initial scale GeV; also, only the NNLO PDFs are shown. At this low scale, the PDF uncertainties are magnified, and they are reduced at electroweak scales as a consequence of DGLAP evolution. Additional plots can be found on the CTEQ public website cteqweb .
Figures 5 and 6 show plots where CT14 (dashed red) is compared to CT14 (solid blue), including error bands. Some comments about this comparison are listed below.
-
•
The central value of the CT14 gluon in the range is almost unchanged compared to CT14; it is larger by about 30% at , by a larger factor for , and it is smaller by about 10% at .
-
•
The up and down quarks are generally slightly larger than (but close to) CT14 in the range , where the CT14 uncertainty band is comparable to that of CT14; whereas they are both systematically larger by about 5% in the intermediate region of . The CT14/CT14 ratio decreases at in both cases. The down quark increases at , while the up quark decreases slightly at . The slow oscillations in reflect the behavior of Bernstein polynomials in Eq. (1).
-
•
The strange quark central PDF is reduced over the entire range, mainly due to the change of freeing one shape parameter for describing the strange (anti)quark PDF; but this reduction is statistically insignificant and completely within the uncertainty of the previous PDF ensemble. In particular a reduction of approximately % is observed at both and .
-
•
The changes in and quarks share similar features. These PDFs are almost unchanged for . The quark PDF increases by about 10% at around 0.2, and the quark PDF similarly increases at around 0.3. Both the and quarks, similar to the quark, decrease by large factors for , where the gluon and down quark PDFs increase, as a consequence of the momentum sum rule. It is important to keep in mind that at the antiquark PDFs take very small values, their behavior is very uncertain and strongly depends on the parametrization form.
-
•
The individual PDF uncertainties do not change appreciably, except in the unconstrained regions.
-
•
We have verified that the change seen in gluon, up and down quark PDFs mainly arises from replacing the HERA1 data (in CT14 analysis) by the HERA2 data (in CT14 analysis). This was explicitly checked by comparing CT14 PDFs to the result of yet another new fit in which we used the exact same setup as that in the CT14 global analysis, but with the HERA1 data replaced by the HERA2 data.
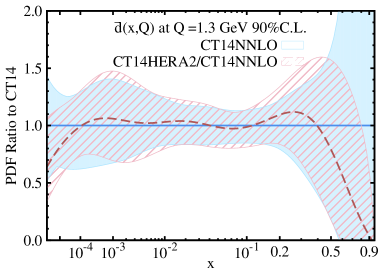
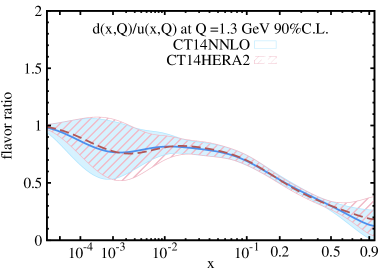
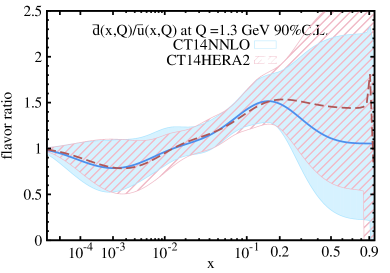
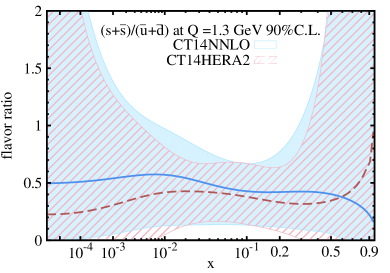
Now we turn to certain ratios of PDFs. Figure 6 shows the most relevant effects of the HERA2 data on the PDF ratios at GeV. Comparing CT14 to CT14 we observe the following.
-
•
The ratio remains approximately the same for CT14 and CT14, in both the central value and uncertainty, for all values of .
-
•
The ratio at is about the same for CT14 and CT14, with compatible uncertainties. However, it is larger for CT14 as increases beyond 0.2, despite having a large uncertainty. We note that this change mainly arises from using the more flexible parametrization in the strange quark PDF. An interesting feature is that is greater than 1 for CT14HERA2 at large region.
-
•
The strange quark fraction is an important PDF ratio that has been discussed recently in several QCD analyses Aad:2012sb ; Samoylov:2013xoa ; Chatrchyan:2013uja ; Alekhin:2014sya ; Dulat:2015mca . As done in the CT14 global analysis, we assume that and PDFs are the same at the initial scale. We find that the value of for CT14 is smaller than for CT14 in the range from to . This is mainly because the strange quark PDF decreases when going from CT14 to CT14HERA2 , as discussed above.
V Discussion and Conclusions
In this paper, we have presented the CT14HERA2 parton distribution functions, constructed from a global analysis of QCD that uses the HERA Run I and II combined data set on deeply inelastic scattering Abramowicz:2015mha . This compendium of 20 years of HERA data, reconciled as well as possible, including comparative analysis of systematic errors from the two collaborations, H1 and ZEUS, provides the most comprehensive information about DIS available today. A comparison of the current QCD analysis of this data (HERA2) to the CT14 global analysis of the previous generation of HERA data (HERA1) yields important insights about the structure of the nucleon, at the highest precision achieved.
The main purpose of the paper is to examine the quality of agreement of perturbative QCD predictions with the HERA2 data and discuss the impact of these data on the PDFs and their uncertainties used for a variety of LHC applications. We conclude that the CT14HERA2 and CT14 PDFs, do have some differences. However, the differences are smaller than the PDF uncertainties of the standard CT14 analysis.
Some specific features of the CT14HERA2 PDFs are elucidated in the paper.
-
•
Figure 2 shows values of for the HERA2 data. is marginally smaller in the NLO analysis than at NNLO, but the difference is clearly negligible. In either case, decreases as HERA2 data is included with increasing weight, at about the same rate for NLO and NNLO.
-
•
Figures 4 and 5 show that HERA2 data slightly modify the , , and PDFs. The PDF decreases, mainly due to the use of a slightly more flexible parametrization for the strange quark PDF. The and PDFs decrease at large , where and PDFs increase, so as to satisfy the momentum sum rule. The most significant effects of the HERA2 data in the CT14HERA2 analysis are seen in the ratio of which is greater than 1 for very large , although this change is much less than the size of the error band. Also, the strangeness fraction is roughly 20% smaller than the standard CT14 for the intermediate range of . This is mainly caused by the reduction in the strange quark PDF.
Because the CT14 and CT14HERA2 PDFs agree well within the PDF errors, we do not expect noticeable differences in their predictions for experimental observables at the LHC. We have explicitly checked that using CT14HERA2 and CT14 PDFs at NNLO gives almost the same predictions for the cross section for and production Aad:2016naf ; CMS:2015ois ; Aad:2011dm ; CMS:2011aa ; Chatrchyan:2014mua , as well as the associated and charm production Chatrchyan:2013uja , at the LHC energies.
In future CT analyses we may employ the HERA2 combined data as an important part of the global data set, together with the new LHC data that will be published, such as low- and high-mass Drell-Yan processes and top quark differential distributions. For the present, we continue to recommend CT14 PDFs for the analysis of LHC Run 2 experiments. However, we make the CT14 PDFs available in the LHAPDF format for specialized studies, such as those that are sensitive to behavior of strange (anti)quark PDFs.
Acknowledgements.
This research was supported in part by the National Science Foundation under Grants No. PHY-1410972 and No. PHY-1417326; by the U.S. Department of Energy under Award No. DE-AC02-06CH11357 and Grants No. DE-SC0013681 and No. DE-SC0010129; by the National Natural Science Foundation of China under Grant No. 11465018; and by the Lancaster-Manchester-Sheffield Consortium for Fundamental Physics under STFC Grant No. ST/L000520/1.References
- (1) S. Dulat, T.-J. Hou, J. Gao, M. Guzzi, J. Huston, P. Nadolsky, J. Pumplin, C. Schmidt, D. Stump, and C.-P. Yuan, Phys. Rev. D 93, 033006 (2016).
- (2) J. Gao, M. Guzzi, J. Huston, H.-L. Lai, Z. Li, P. Nadolsky, J. Pumplin, D. Stump, and C.-P. Yuan, Phys. Rev. D 89, 033009 (2014).
- (3) H. L. Lai, M. Guzzi, J. Huston, Z. Li, P. M. Nadolsky, J. Pumplin, and C.-P. Yuan, Phys. Rev. D 82, 074024 (2010).
- (4) LHAPDF, https://lhapdf.hepforge.org/.
- (5) L. A. Harland-Lang, A. D. Martin, P. Motylinski, and R. S. Thorne, Eur. Phys. J. C 75, 204 (2015).
- (6) R. D. Ball et al. (NNPDF Collaboration.), J. High Energy Phys. 04 (2015) 040.
- (7) S. Alekhin, J. Blumlein, and S. Moch, Phys. Rev. D 89, 054028 (2014).
- (8) P. Jimenez-Delgado and E. Reya, Phys. Rev. D 89, 074049 (2014).
- (9) J. Butterworth et al., J. Phys. G 43, 023001 (2016).
- (10) H. Abramowicz et al. (ZEUS, H1 Collaboration), Eur. Phys. J. C 75, 580 (2015).
- (11) F. D. Aaron et al. (ZEUS, H1 Collaboration), J. High Energy Phys. 01 (2010) 109.
- (12) F. D. Aaron et al. (H1 Collaboration), Eur. Phys. J. C 63, 625 (2009).
- (13) F. D. Aaron et al. (H1 Collaboration), Eur. Phys. J. C 64, 561 (2009).
- (14) C. Adloff et al. (H1 Collaboration), Eur. Phys. J. C 13, 609 (2000).
- (15) C. Adloff et al. (H1 Collaboration), Eur. Phys. J. C 19, 269 (2001).
- (16) C. Adloff et al. (H1 Collaboration), Eur. Phys. J. C 30, 1 (2003).
- (17) F. D. Aaron et al. (H1 Collaboration), J. High Energy Phys. 09 (2012) 061.
- (18) V. Andreev et al. (H1 Collaboration), Eur. Phys. J. C 74, 2814 (2014).
- (19) F. D. Aaron et al., Eur. Phys. J. C 71, 1579 (2011).
- (20) J. Breitweg et al. (ZEUS Collaboration), Phys. Lett. B 407, 432 (1997).
- (21) J. Breitweg et al. (ZEUS Collaboration), Phys. Lett. B 487, 53 (2000).
- (22) J. Breitweg et al. (ZEUS Collaboration), Eur. Phys. J. C 7, 609 (1999).
- (23) S. Chekanov et al. (ZEUS Collaboration), Eur. Phys. J. C 21, 443 (2001).
- (24) J. Breitweg et al. (ZEUS Collaboration), Eur. Phys. J. C 12, 411 (2000); 27, 305(E) (2003).
- (25) S. Chekanov et al. (ZEUS Collaboration), Eur. Phys. J. C 28, 175 (2003).
- (26) S. Chekanov et al. (ZEUS Collaboration), Phys. Lett. B 539, 197 (2002); 552, 308(E) (2003).
- (27) S. Chekanov et al. (ZEUS Collaboration), Phys. Rev. D 70, 052001 (2004).
- (28) S. Chekanov et al. (ZEUS Collaboration), Eur. Phys. J. C 32, 1 (2003).
- (29) S. Chekanov et al. (ZEUS Collaboration), Eur. Phys. J. C 62, 625 (2009).
- (30) S. Chekanov et al. (ZEUS Collaboration), Eur. Phys. J. C 61, 223 (2009).
- (31) H. Abramowicz et al. (ZEUS Collaboration), Phys. Rev. D 87, 052014 (2013).
- (32) H. Abramowicz et al. (ZEUS Collaboration), Eur. Phys. J. C 70, 945 (2010).
- (33) H. Abramowicz et al. (ZEUS Collaboration), Phys. Rev. D 90, 072002 (2014).
- (34) L. A. Harland-Lang, A. D. Martin, P. Motylinski, and R. S. Thorne, Eur. Phys. J. C 76, 186 (2016).
- (35) R. S. Thorne et al., Proc. Sci., EPS-HEP20152015 (2015) 505 [arXiv:1508.06621].
- (36) J. Rojo (NNPDF Collaboration), Proc. Sci., EPS- HEP20152015 (2015) 506 [arXiv:1508.07731].
- (37) M. Arneodo et al. (New Muon Collaboration), Nucl. Phys. B483, 3 (1997).
- (38) J. Pumplin, D. R. Stump, J. Huston, H.-L. Lai, P. Nadolsky, and W.-K. Tung, J. High Energy Phys. 07 (2002) 012.
- (39) S. Chatrchyan et al. (CMS Collaboration), Phys. Rev. D 87, 112002 (2013); 87, 119902 (2013).
- (40) M. Guzzi, P. M. Nadolsky, H.-L. Lai, and C.-P. Yuan, Phys. Rev. D 86, 053005 (2012).
- (41) M. A. G. Aivazis, F. I. Olness, and W. K. Tung, Phys. Rev. D 50, 3085 (1994).
- (42) M. A. G. Aivazis, J. C. Collins, F. I. Olness, and W-K Tung, Phys. Rev. D 50, 3102 (1994).
- (43) J. C. Collins, Phys. Rev. D 58, 094002 (1998).
- (44) W. K. Tung, S. Kretzer, and C. Schmidt, J. Phys. G 28, 983 (2002).
- (45) J. Gao, M. Guzzi, and P. M. Nadolsky, Eur. Phys. J. C 73, 2541 (2013).
- (46) H. L. Lai, J. Huston, Z. Li, P. Nadolsky, J. Pumplin, D. Stump, and C.-P. Yuan, Phys. Rev. D 82, 054021 (2010).
- (47) P. M. Nadolsky, H.-L. Lai, Q.-H. Cao, J. Huston, J. Pumplin, D. Stump, W.-K. Tung, and C.-P. Yuan, Phys. Rev. D 78, 013004 (2008).
- (48) W. K. Tung, H. L. Lai, A. Belyaev, J. Pumplin, D. Stump, and C.-P Yuan, J. High Energy Phys. 02 (2007) 053.
- (49) E. L. Berger, J. Gao, C. S. Li, Z. L. Liu, and H. X. Zhu, Phys. Rev. Lett. 116, 212002 (2016).
- (50) G. Aad et al. (ATLAS Collaboration), Phys. Rev. D 85, 072004 (2012).
- (51) S. Chatrchyan et al. (CMS Collaboration), Phys. Rev. D 90, 032004 (2014).
- (52) R. Aaij et al. (LHCb Collaboration), J. High Energy Phys. 06 (2012) 058.
- (53) V. M. Abazov et al. (D0 Collaboration), Phys. Rev. D 91, 032007 (2015); 91, 079901(E) (2015).
- (54) A. M. Stasto, K. J. Golec-Biernat, and J. Kwiecinski, Phys. Rev. Lett. 86, 596 (2001).
- (55) F. Caola, S. Forte, and J. Rojo, Phys. Lett. B 686, 127 (2010).
- (56) The CTEQ-TEA webpage http://hep.pa.msu.edu/cteq/public/index.html,
- (57) G. Aad et al. (ATLAS Collaboration), Phys. Rev. Lett. 109, 012001 (2012).
- (58) O. Samoylov et al. (NOMAD Collaboration), Nucl. Phys. B876, 339 (2013).
- (59) S. Chatrchyan et al. (CMS Collaboration), J. High Energy Phys. 02 (2014) 013.
- (60) S. Alekhin, J. Blümlein, L. Caminada, K. Lipka, K. Lohwasser, S. Moch, R. Petti, and R. Plačakytė, Phys. Rev. D 91, 094002 (2015).
- (61) G. Aad et al. (ATLAS Collaboration), Phys. Lett. B 759, 601 (2016).
- (62) CMS Collaboration,ReportNo.CMS-PAS-SMP-15-004,2015.
- (63) S. Chatrchyan et al. (CMS Collaboration), J. High Energy Phys. 10 (2011) 132.
- (64) S. Chatrchyan et al. (CMS Collaboration), Phys. Rev. Lett. 112, 191802 (2014).