Level-crossing spectroscopy of nitrogen-vacancy centers in diamond: sensitive detection of paramagnetic defect centers
Abstract
We report a magnetic field dependence of fluorescence of diamond single crystals containing NV- centers. In such spectra, numerous sharp lines are found, which correspond to Level Anti-Crossings (LACs) in coupled spins systems comprising an NV- center. Theoretical modeling of such “LAC-spectra” enables characterization of paramagnetic defect centers and determination of their magnetic resonance parameters, such as zero-field splitting and hyperfine coupling constants. The outlined method thus enables sensitive detection of paramagnetic impurities in diamond crystals.
pacs:
61.72.jn, 75.30.Hx, 78.55.-m, 81.05.ugI Introduction
The negatively charged nitrogen-vacancy center (NV- center) in diamond signle crystals is of great interest due to its unique physical properties.Doherty et al. (2013) NV- centers represent a promising molecular system for many applications as well as an excellent test system for single-molecule spectroscopy, quantum information processingGruber et al. (1997); Wrachtrup et al. (2001); Jelezko and Wrachtrup (2004); Childress et al. (2006); Wrachtrup and Jelezko (2006); Hanson et al. (2006a); Gaebel et al. (2006); Santori et al. (2006); Waldermann et al. (2007); Maurer et al. (2012); van der Sar et al. (2012); Dolde et al. (2013, 2014); Pfaff et al. (2014) and nanoscale magnetometry Taylor et al. (2008); Balasubramanian et al. (2008); Maze et al. (2008); Rittweger et al. (2009); Acosta et al. (2009); Fang et al. (2013).
The ground state of the NV- centers is a triplet state. The triplet ground state is split (due to the electron dipole-dipole interaction) and the eigen-states have different energies depending on the spin projection on the symmetry axis. The energy term lowest in energy is the term with zero projection, , of the electron spin on the molecular axis. The splitting between this term and the terms with the projections and at zero magnetic field is GHz. For symmetry reasons (the system has symmetry) the terms are degenerate (due to axial symmetry of the diolar tensor).
Upon light-induced transitions to the excited state of the NV- center, the evolution of the system depends on the electron spin state. The reason is the spin projection-selective inter-system crossing from the excited triplet state to the excited singlet state. For the state this process is inefficient, whereas for the states the excited singlet state is formed with a relatively high yield. The singlet excited state eventually decays to the ground state due to inter-system crossing; again, the rate of this process depends on being the highest for . Consequently, after a few excitation cycles the state is enriched; in other words, strong non-equilibrium electron spin polarization the NV- center is formed. This effect is usually referred to as optically-induced spin polarization Loubser and Van Wyk (1977); Manson et al. (2006); Delaney et al. (2010); Goldman et al. (2015) despite the fact that in this state the average projection of the electron spin is zero for any direction in space (no macroscopic net polarization is formed). Optically generated polarization of NV- centers is of significance for many applications.
One of the methods to study the properties of NV- centers and their interaction with other defect centers is provided by the analysis of the photo-luminescence intensity of the NV- centers and its magnetic field dependence. van Oort and Glasbeek (1989); Epstein et al. (2005); Hanson et al. (2006b); Rogers et al. (2008, 2009); Lai et al. (2009); Armstrong et al. (2010); Anishchik et al. (2015) The external magnetic field changes the spin polarization value: this effect can be monitored by a reduction of the luminescence intensity of NV- centers at particular magnetic field strengths. Manson et al. (2006) Typically, the magnetic field dependence of the photo-luminescence contains a smooth background with sharp lines on top of it. For observing such lines it is necessary to orient precisely the diamond crystal: these lines can only be detected when the magnetic field vector is parallel to the [111] axis of the diamond crystal lattice. Even a slight misalignment strongly broadens the lines and reduces their magnitude such that the sharp lines vanish. These lines are attributed to Level Anti-Crossings (LACs) either in the NV- center or in an extended spin system comprising an NV- center and another paramagnetic defect center in diamond. The most prominent line is observed at 1024 G, where there is an LAC of the triplet levels of the ground state of the NV- center. Other lines are referred to, perhaps, misleadingly, as cross-relaxation lines. van Oort and Glasbeek (1989) However, we clearly demonstrate in this work that all sharp lines are coming from the coherent spin dynamics at specific LACs. Thus, it is reasonable to name the sharp lines “LAC-lines” and the corresponding magnetic field dependencies can be named “LAC-spectra”. By an LAC (also termed “avoided crossing”) we mean the following situation. Let us imagine that at a particular field strength a pair of levels, corresponding to quantum states and , tends to cross, i.e., to become degenerate. However, when there is a perturbation matrix element , which mixes the levels, the degeneracy is lifted with a consequence that the crossing is avoided. Importantly, at an LAC efficient coherent exchange of populations of the and states occurs, Colegrove et al. (1959); Pravdivtsev et al. (2013a, b); Clevenson et al. (2016), i.e., LAC efficiently mediate spin polarization transfer.
In this work, we perform an experimental and theoretical study of LAC-spectra of diamond single crystals containing NV- centers. For observation of LAC-lines we make an efficient use of lock-in detection; this method dramatically increases the sensitivity. Thus, we detect the luminescence in the presence of a small-amplitude modulation of the external magnetic field. We demonstrate that the LAC-lines are prominent at small modulation frequencies. By optimizing the experimental settings we can strongly enhance weak LAC-lines and reveal many new LAC-lines, which were previously unknown. We propose a simple and efficient theoretical approach to calculating LAC-spectra. A comparison between theory and experimental data enables indirect detection of paramagnetic centers and precise determination of their magnetic parameters.
II Experimental results
II.1 Materials and methods
Details of the experimental method are outlined in a previous publication Anishchik et al. (2015).
Experiments were performed using two samples, here named SMP1 and SMP2 of synthetic diamond single crystals. The two samples differ in the content and concentration of paramagnetic impurities. The samples were grown at high temperature and high pressure in the Fe-Ni-C system. As-grown, the crystals were iradiated by fast electrons of the energy of 3 MeV, the irradiation dose was el/cm2; after that the samples were annealed in vacuum for two hours at a temperature of 800o. The average concentration of the NV- centers for the SMP1 and SMP2 samples are and cm-3, respectively; the concentration of the so-called P1 centers (see explanation below) is 23 and 55 ppm, respectively. Hence, the SMP2 sample contains more paramagnetic impurities than the SMP1 sample. Both samples contain carbon and nitrogen atoms in natural abundance.
The sample was located in an external magnetic field, which is a sum of a permanent field and an oscillating field of a small amplitude :
| (1) |
Here is the modulation frequency. The sample was irradiated by light of a wavelength of 532 nm and power of 400 mW. The beam direction was either parallel or perpendicular to the magnetic field vector B0. In all experiments we worked with linearly polarized light and varied the orientation of the electric polarization vector E with respect to the B0 vector. Most experiments were done with E parallel to B0 and with E perpendicular to B0. The luminescence intensity was measured by a photo-multiplier; the modulated luminescence signal was an input signal for the lock-in amplifier. The modulation frequency was varied in a range from 10 Hz to 100 kHz. In all experiments presented here the modulation amplitude was 0.5 G. All experiments were performed at room temperature.
II.2 LAC-spectra and LAC-lines
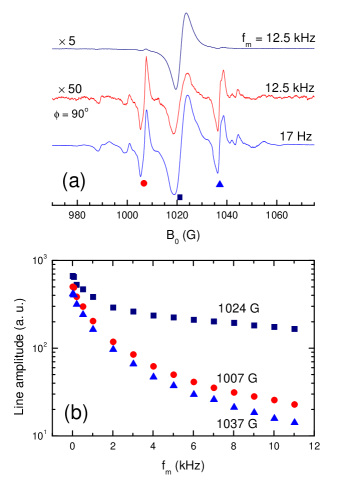
It is well-known that when the sample is oriented precisely, such that , at a magnetic field G there is a sharp dip, an LAC-line, in the luminescence intensity, which is caused by an LAC between the state and state of the ground state of the NV- center. Additionally, weak satellite lines can be observed; observation of these lines is a good indication for precise orientation of the sample. Our experimental results for the SMP2 sample using lock-in detection are presented in Fig. 1. In Fig. 1(a) we show the LAC-spectra of the NV- centers for the magnetic field range around 1024 G at the modulation frequency of 12.5 kHz and 17 Hz. When lock-in detection is used, each LAC-line has two components, a negative one and a positive one. One can readily see that at kHz and appropriate setting of the lock-in detector phase (set such that the amplitude of the LAC line at 1024 G is maximal) the satellites at 1007 G and 1037 G are hardly visible. These lines are coming from magnetic dipole-dipole interaction of NV- centers with neutral nitrogen (P1 centers), which replaces carbon atoms in the diamond crystal lattice. The small amplitude of these lines indicates a slow response times of processes, which lead to the formation of these lines. For the same reason, the phase shift is close to : when such a phase shift is introduced the satellite lines become clearly visible. Interestingly, despite the almost ten-fold decrease of the line intensity (for the central LAC-line) other weak LAC-lines appear in the spectrum.
When the modulation frequency is reduced to 17 Hz the amplitude of the central LAC-line increases by roughly a factor of 7, whereas the satellite lines become 50 times more intense. The phase shift for all lines becomes negligibly small. Additional weaker lines show up in the spectrum as the signal-to-noise ratio significantly increases.
In Fig. 1(b) we present the experimental dependencies of the line intensities on the modulation frequency. In these experiments we measured the total (peak to peak) amplitude of the two-component LAC-lines; the lock-in detector phase was set for each line in each experiment such that the amplitude of the line was maximal. One can readily see that in the frequency range under study the line intensity changes by roughly two order of magnitude. Interestingly, the frequency dependence is not exponential and the slope of the curve increases at low frequencies.
The most interesting experimental fact is that the increase of the line intensities occurs at low frequencies, namely, at values, which are much smaller than any spin relaxation rates of the NV- center. Such a strong dependence can be explained by polarization transfer from electron spins to nuclear spins having much longer relaxation times Anishchik and Ivanov (2016).
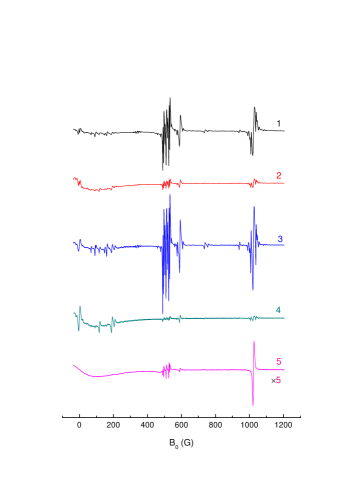
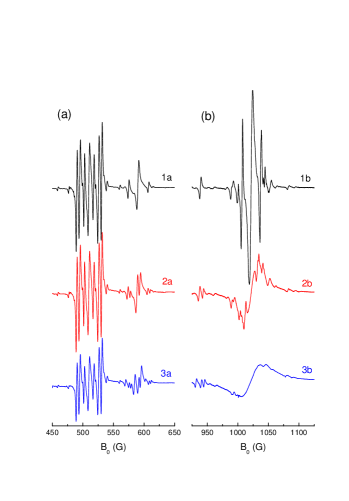
The absence of a phase shift and the significant increase in the signal-to-noise ratio at low modulation frequencies gives us some hope to observe new LAC-lines. In Fig. 2 we present the LAC-spectra of the two samples. These spectra are obtained at different polarization of the incident light and at Hz. Additionally, we show the LAC-spectrum of the SMP2 sample at kHz and . All previously known LAC-lines are seen in curve 5 in Fig. 2, which has been measured at the high modulation frequency. Namely, these are the seven lines in the field range 450-550 G, a line at 590 G and the LAC-line at 1024 G. The zero-field line, which has been found by some of us Anishchik et al. (2015) is not visible because its phase shift is about 80o at these experimental conditions resulting in a strongly reduced line intensity.
When the modulation frequency is reduced, many new lines appear in the LAC spectra of both samples. In the field range 0-250 G there is a group of lines appearing, which has never been reported. At the high frequency (12.5 KHz) in this range there is only one broad line found corresponding to the well-known Epstein et al. (2005); Rogers et al. (2008, 2009); Armstrong et al. (2010) smooth decrease of the photo-luminescence intensity. Besides this, several groups of low-intensity lines appear. All observed lines are coming from interaction of the NV- centers with other paramagnetic defect centers. Specifically, in the entire spin system of coupled paramagnetic centers there is polarization transfer occurring at LACs. As a consequence the luminescence intensity of NV- centers is reduced and LAC-lines appear. Investigating the origin of such LAC-lines allows one to identify the defect centers and determine their magnetic resonance parameters, such as zero-field splitting (ZFS) and hyperfine couplings (HFCs).
When the polarization of the incident light is changed from to the intensity of LAC-lines considerably decreases. Specifically, for most lines the intensity diminishes. However, the intensity of the zero-field line grows: in spectrum 4 the zero-field line is the most intense.
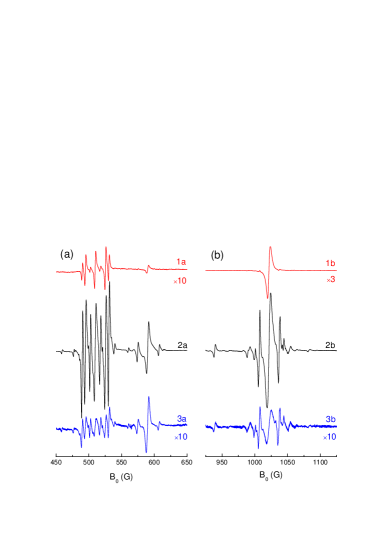
In Fig. 3 we zoom into the LAC-spectrum of the SMP2 sample showing the field ranges of 540-650 G and 925-1125 G. Upon lowering of the modulation frequency from 12.5 kHz to 17 Hz the intensity of all LAC-lines increases; their relative intensities also change. Likewise, all lines become much less intense when the light polarization is . For the lines showing up in the range 580-530 G the intensity decreases by a factor of 40; for the line at 590 G the decrease is 8-fold. For the LAC-lines showing up in the range 925-1125 G there is an overall reduction of the line intensity, which is different for individual lines.
In Fig. 4 we present the LAC spectra for the two samples showing the field range from to G at the two different polarizations of the incident light. For both samples we can observe sharp LAC-lines, which are much more pronounced for the SMP2 sample (having a higher concentration of paramagnetic defect centers). In both samples the zero-field line is observed Anishchik et al. (2015); however, its shape is different for the two samples. The shape and intensity of this line do not change much upon rotation of the light polarization vector. Additionally, there is a group of lines appearing in the range 50-250 G; their intensity is very sensitive to the light polarization. The spectrum becomes simple for the SMP2 sample when : it comprises a singlet line at 120 G and a doublet at about 200 G. These lines are also seen when but their intensity a two times lower. At this light polarization, more lines appear: a singlet at 50 G, a narrow doublet at 100 G and a doublet at 160 G. At the other polarization, , these lines also show up but their intensity is so low, that they rather look like experimental noise.
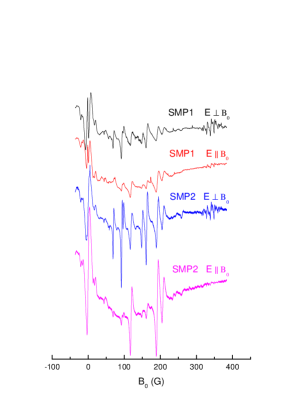
In our experiments the sample is precisely oriented such that . When the light polarization is the NV- centers oriented along the field vector are not excited and do not acquire any spin polarization. For this reason, the LAC-lines (singlet and doublet) seen in the lower curve in Fig. 4 are due to excitation of the NV- centers tilted by 70.53o with respect to the field vector. Other lines, which appear at the polarization are coming from excitation of the NV- centers oriented parallel to the field vector.
In Fig. 5 we present the dependence of the LAC-line shape on the sample rotation, as shown for the field range 450-650 and 925-1125 G. The SMP2 sample is rotated by a small angle. We compare the results for the sample with the [111] axis oriented parallel to with an accuracy of 0.1o and for the same sample rotated by an angle of 0.4o and . The value of the rotation angle is cross-checked by a calculation performed for the LAC-line at 590 G. One can see that the lines falling in the range 450-550 G become less intense but keep the shape and position. The line at 1024 G is broadened and decreased in amplitude; the satellites practically disappear. The lines at 590 G and 940 G are synchronously split into two or three components. It is known that the LAC-line at 590 G is due to the dipole-dipole interaction of NV- centers having different orientations with respect to the field vector Armstrong et al. (2010). Most likely, the LAC-line at 940 G has a similar origin.
III Theory
In order to model the LAC spectra we make use of a model, developed previously Ivanov et al. (2008) for simulating coherent polarization transfer phenomena. In this model we assume that light irradiation continuously generates electron spin polarization of the NV- center. We neglect the spin evolution occurring during light excitation and relaxation to the ground state, thereby assuming that such processes are much faster than spin polarization transfer. Hence, we consider only polarization from the ground state of the NV- centers; polarization transfer in the excited state can be treated in a similar manner.
When polarization transfer occurs within a single NV- center it is driven by the following Hamiltonian:
| (2) |
Here is the g-factor of the NV- center, is the ZFS tensor of the triplet state, is the HFC constant with the 14N nucleus (HFC anisotropy is neglected), is the nuclear quadrupolar interaction, which is neglected. Hereafter, is the spin operator of the NV- center (the -spin is equal to 1); is the spin operator of the 14N nucleus of the NV- center (the -spin is equal to 1). Polarization generated by light excitation is given by the following density matrix:
| (3) |
Here is a matrix having only one non-zero element, which corresponds to the population of the state; describes the nuclear density matrix at equilibrium conditions. In high-temperature approximation this matrix is simply proportional to the unity matrix of the corresponding dimensionality, , divided by a weighting factor in order to provide normalization . For instance, for a spin-1 nucleus this matrix has only three diagonal matrix elements equal to .
In eq. (2) we specify the interaction tensors, which depend on the sample orientation. These tensors become simple, namely, diagonal, in the principle axis system. In any other frame the tensors are no longer diagonal and their precise form are determined by the frame rotations. The frame rotation can be taken into account by either performing three Euler rotations or by specifying the direction cosines for the frame transformations. Here we do not go into detail of such standard calculations. To set the orientation of ZFS tensors it is sufficient to perform only Euler rotation because (i) the experiment is set-up such, that there is axial symmetry and (ii) the dipolar tensor is axially symmetric. We always assume that the -axis is parallel to the field vector. Thus, to describe the frame transformation, it is sufficient to specify only the tilt angle, , between the -axis and the -axis of the tensor. Of course, for symmetry reason the latter -axis coincides with the symmetry axis of the NV- center; likewise, all other tensors (g-tensor, HFC tensor) posses the same symmetry. For NV- centers the principal values of the ZFS tensor are:Doherty et al. (2013) GHz, . In calculations we always consider NV- centers oriented parallel to the external field and NV- centers tilted by 70.53o degrees with respect to the -axis. In a precisely oriented diamond crystal a quarter of the NV- centers have and three quarters have . Rotations of the sample by small angles can be taken into account in the same way.
To calculate the LAC spectrum we go through the following steps. First, we calculate in the eigen- basis of the Hamiltonian. Second, we remove all off-diagonal elements (coherences) of the density matrix thus assuming that they are washed out during the spin evolution over an extended irradiation period. Finally, we calculate the luminescence intensity as the total population of the state, , since this is the state, which provides bright luminescence upon irradiation when no spin mixing occurs. Such a method follows closely the previously developed approach.
By generalizing this approach we can also take into account polarization transfer between different paramagnetic defect centers. For two interacting centers, each having a single magnetic nucleus, the Hamiltonian takes the form:
| (4) |
Here the spin operators and parameters of the second center are introduced in the same way (by simply re-defining the indices, ); (here is the vector connecting the two centers) stands for the tensor of the dipole-dipole interaction between the electron spins of the two defect centers. The initial density matrix is constructed in the same way as for a single NV- center: the electronic triplet state of the NV- center is assumed to be polarized, whereas all other spins are at thermal equilibrium. All further steps required to calculate the LAC-spectrum are the same as previously. The method can be generalized to an arbitrary number of interacting spins in a straightforward way. Finally, to ease the comparison with the experimental data we can numerically take the derivative of the calculated LAC-spectra.
Typical magnetic resonance parameters used in calculations (derived from experimental data Doherty et al. (2013)) are given in Table 1.
| D (MHz) | g|| | g⟂ | A|| (MHz) | A⟂ (MHz) | |
|---|---|---|---|---|---|
| NV- | 2870 | 2.0029 | 2.0031 | 2.5 | 2.5 |
| P1 | 0 | 2.0023 | 2.0023 | 114 | 81 |
| NV0 | 1685 | 2.0029 | 2.0035 | 26 | 17.3 |
IV Discussion
In Fig. 6 we present the calculation results obtained using the outlined theoretical model. Specifically, we present LAC-spectra, which are calculated as the magnetic field dependencies of . We can now study how is modified due to interactions with different paramagnetic defect centers.
In Fig. 6(a) we present the dependence for an interacting pair of paramagnetic centers NV-+P1, where P1 is the neutral nitrogen atom, which replaces a carbon atom in the crystal lattice. P1 is a paramagnetic spin-1/2 center; thus, in the calculation we set and (corresponding to a 14N nucleus). We also performed averaging over the four possible orientations of the P1 center. For simplicity, we show the dependence only for an NV- center oriented parallel to the external magnetic field . At such an orientation we find sharp dips in the dependence, which appear at the LACs of the spin system. One can readily see that in the LAC-spectra there are two groups of lines. The first group of lines appears around 1024 G (the main LAC-line and weak satellites); the second group of lines is around 500 G, altogether there are seven lines in this group. At other orientations of the NV- center there are no sharp lines; for this reason we do not show the for other orientations.
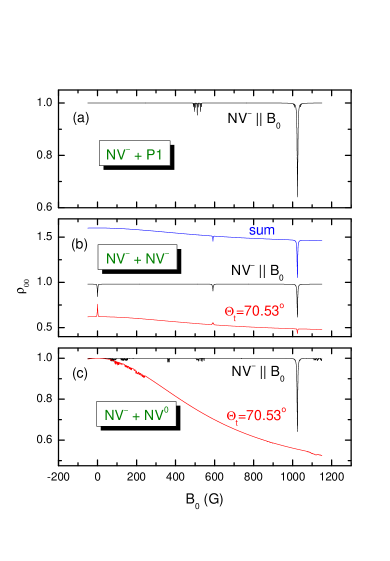
In Fig. 6(b) we also present the calculated LAC spectra for two interacting NV- centers. Here the dependence is shown for two orientations of the NV- centers, both centers are oriented parallel to the external field and tilted by 70.53o with respect to the field. We also present the sum of the two e dependencies, which is averaged over four orientations of one of the partners.
At an arbitrary orientation of the NV- center the LAC-line at 1024 G is observed. For the NV- center oriented parallel to the external field is due to an LAC of the and states of the NV- center itself. When the NV- center is tilted by 70.53o with resect to the field the LAC-line is due to polarization transfer between this center and the one oriented parallel to the field. For this reason, the intensity of the LAC line in this case is lower.
At both orientations there is an LAC-line at 590 G; however, it has different intensity in the two cases. This line is due to dipole-dipole interaction of two NV- centers having different orientations. For the center oriented parallel to the field the LAC-line is a dip; for the other orientation it is a peak. However, the amplitude of the LAC-line is higher in the former case; consequently, the overall effect is negative (a dip is seen).
Interestingly, at zero field also has a feature, a peak of a dip. In the previous work Anishchik et al. (2015) some of us have shown that this line comes from interaction of NV- centers with different orientation. As it is seen from Fig. 6(b), the effect has the same sign but opposite size for different orientations. Therefore for averaged over orientations this line is missing. However, interpreting experiments where the fluorescence intensity is measured one should note that the excitation efficiency of an NV- center, as well as its spin polarization, are orientation-dependent. For this reason, the zero-field LAC-line can be observed; its intensity is expected to be proportional to the square of the light intensity, as has been found experimentally Anishchik et al. (2015).
In Fig. 6(c) we present the dependencies for the case where an NV- center is coupled to a neutral NV0 center by dipole-dipole interaction. The electron spin of the NV0 center is ; the nuclear spins are . In the Figure we show the result for two orientations of the NV-, as averaged over the four orientations of the NV0 center.
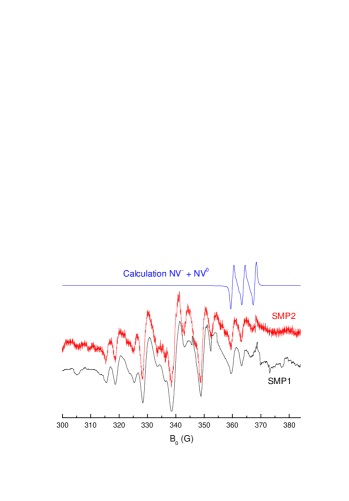
When the NV- center is oriented along the external field the LAC-line at 1024 G is seen as well as additional four groups of lines. For the tilt angle of 70.53o the calculation predicts numerous lines at magnetic fields less than 300 G. We are not able to assign any experimentally observed lines except for the triplet in the field range 360-370 G (see Fig. 10). None of the lines shown in Fig. 6 can explain the experimentally observed lines in the range 25-250 G shown in Fig. 4.
For the ease of comparison of theoretical and experimental results hereafter we present the first derivative of the curves.
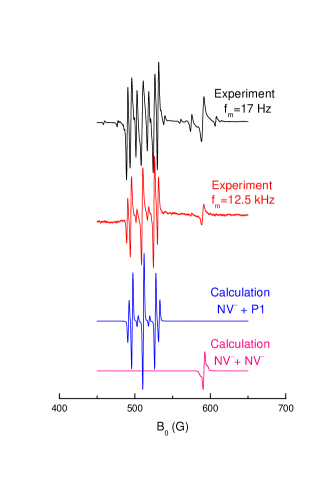
In Fig. 7 two experimental LAC-spectra are shown for the B0 range of 450-650 G obtained at the modulation frequency of 17 Hz and 12.5 kHz, as well as the calculation results for the pairs of defect centers NV-+P1 and NV-+NV-. Interaction of the NV- with the P1 center leads to the formation of LAC-lines in the field range 480-540 G; their positions exactly coincide with those for the experimentally measured lines. Relative intensities of the LAC-lines in the calculation are close to the experimentally found ones at kHz being considerably different from those found at 17 Hz. In Fig. 7 we also show the calculation result for the pair NV-+NV-. The theoretical LAC-line at 590 G is in perfect agreement with the experiment. However, the satellites, which are clearly seen at the modulation frequency of 17 Hz, are not reproduced by the calculation. The most likely reason for the appearance of these satellites is the splitting due to HFC with 13C spins, which are not included in the calculation. As far as the line at 940 G in Figs. 5 and 8 is concerned, it can be reproduced by calculations when we take into account the interaction of an NV- center with an excited state of the NV- center (although the fitting HFC constant for the excited state turns out to be significantly smaller than the value found previously Steiner et al. (2010)). Therefore the origin of this line remains an open issue.
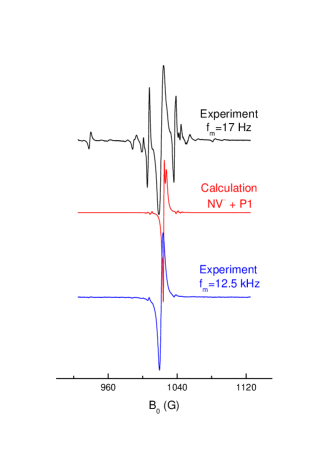
In Fig. 8 we show the experimental LAC-spectra around the LAC-line at 1024 G obtained using Hz and kHz and the calculated spectrum for an NV- center interacting with a neutral nitrogen P1 center. One can readily see that (as well as in the previous case) the relation of the amplitudes of the LAC-lines is close to that found experimentally using the modulation frequency of 12.5 kHz. However, the discrepancy with the experimental results obtained using Hz is bigger. Most likely, such a discrepancy comes from the simplifying assumptions made in the calculations. Specifically, the calculation reflects the static value of and the experiment at high modulation frequencies much better corresponds to the derivative of this static value. At the same time, the effect of the increased intensity is much more pronounced for weak LAC-lines, see Fig. 1. Hence, we can state that lowering of leads to distortions of LAC-lines but at the same time allows one to detect weak LAC-lines.
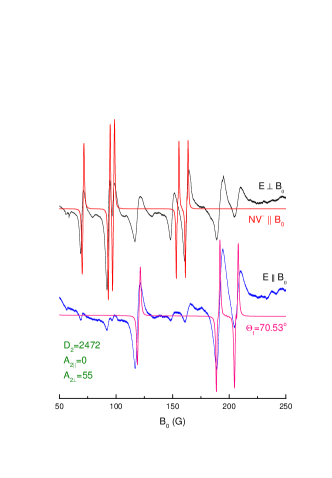
The experimental results for the fields lower than 250 G cannot be explained by considering interaction of an NV- center with the paramagnetic centers (P1, NV- and NV0) mentioned above. We tried to determine the parameters, which provide good agreement between theory and experiments. It turns out that the experimental curves can be reasonably well modeled by considering the dipole-dipole interaction with a paramagnetic center with the electron spin and nuclear spin , having the same symmetry as the NV- center. In Fig. 9 we show the experimental traces and calculation results. We did not attempt to fit the width of the LAC-lines and fitted only the positions of the lines in the LAC-spectra. The experimental data obtained for are compared to the calculation assuming that the NV- center axis is parallel to the magnetic field (since the centers with this orientations are most effectively excited and polarized by light). When the NV- centers, whose axis is parallel to , are not excited at all. For this reason, we compare the experimental spectra with the calculations assuming that the NV- center is tilted by 70.53o with respect to . As can be seen from the Figure one can fit the positions of almost all LAC-lines by using the following parameters: =2472 MHz, =0, =0, =55 MHz.The only line, which cannot be assigned is the line at 150 G. Imperfections of the fit and somewhat unusual relation between the components of the HFC tensor leaves us in doubts about the model. Most likely, the unknown center has a different symmetry. We cannot identify what this defect center is; one can only assume that this is a center containing a substitutional phosphorus atom and a vacancy next to it.
Finally, let us discuss the lines found in the range 300-390 G, see Fig. 10. One can see that there are many lines in this range. The calculation for the pair NV-+NV0 reproduces well three of these lines. The origin of other lines remains unclear.
Additional calculations validating the theoretical model and showing the optimal fitting parameters are shown in Supplementary Information at the end of the manuscript.
V Conclusions
In this work by using lock-in detection we have found many new LAC-lines in the magnetic field dependence of the luminescence intensity of the NV- centers in diamonds. These lines strongly depend on the modulation frequency: by lowering one can increase the line intensity and resolve new LAC-lines. We have found a simple and efficient method for describing spin polarization transfer between the NV- centers and other defect centers in the diamond crystal. This method allows one to calculate LAC-spectra and assign LAC-lines. We were able to identify a previously unknown defect center. Potentially, our experimental method going hand in hand with the new theory is a powerful tool for investigating paramagnetic defect centers and their interaction.
Acknowledgements.
Experimental work was supported by the Russian Foundation for Basic Research (Grant No. 16-03-00672); theoretical work was supported by the Russian Science Foundation (grant No. 15-13-20035).References
- Doherty et al. (2013) M. W. Doherty, N. B. Manson, P. Delaney, F. Jelezko, J. Wrachtrup, and L. C. L. Hollenberg, Physics Reports 528, 1 (2013).
- Gruber et al. (1997) A. Gruber, A. Dräbenstedt, C. Tietz, L. Fleury, J. Wrachtrup, and C. von Borczyskowski, Science 276, 2012 (1997).
- Wrachtrup et al. (2001) J. Wrachtrup, S. Y. Kilin, and A. P. Nizovtsev, Optics and Spectroscopy 91, 429 (2001).
- Jelezko and Wrachtrup (2004) F. Jelezko and J. Wrachtrup, J. Phys.: Condens. Matter 16, R1089 (2004).
- Childress et al. (2006) L. Childress, M. V. Gurudev Dutt, J. M. Taylor, A. S. Zibrov, F. Jelezko, J. Wrachtrup, P. R. Hemmer, and M. D. Lukin, Science 314, 281 (2006).
- Wrachtrup and Jelezko (2006) J. Wrachtrup and F. Jelezko, J. Phys.: Condens. Matter 18, S807 (2006).
- Hanson et al. (2006a) R. Hanson, O. Gywat, and D. D. Awschalom, Phys. Rev. B 74, 161203 (2006a).
- Gaebel et al. (2006) T. Gaebel, M. Domhan, I. Popa, C. Wittmann, P. Neumann, F. Jelezko, J. R. Rabeau, N. Stavrias, A. D. Greentree, S. Prawer, J. Meiler, J. Twamley, P. R. Hemmer, and J. Wrachtrup, Nat. Phys. 2, 408 (2006).
- Santori et al. (2006) C. Santori, D. Fattal, S. M. Spillane, M. Fiorentino, R. G. Beausoleil, A. D. Greentree, P. Olivero, M. Draganski, J. R. Rabeau, P. Reichart, B. C. Gibson, S. Rubanov, D. N. Jamieson, and S. Prawer, Opt. Express 14, 7986 (2006).
- Waldermann et al. (2007) F. C. Waldermann, P. Olivero, J. Nunn, K. Surmacz, Z. Y. Wang, D. Jaksch, R. A. Taylor, I. A. Walmsley, M. Draganski, P. Reichart, A. D. Greentree, D. N. Jamieson, and S. Prawer, Diamond and Rel. Mat. 16, 1887 (2007).
- Maurer et al. (2012) P. C. Maurer, G. Kucsko, C. Latta, L. Jiang, N. Y. Yao, S. D. Bennett, F. Pastawski, D. Hunger, N. Chisholm, M. Markham, D. J. Twitchen, J. I. Cirac, and M. D. Lukin, Science 336, 1283 (2012).
- van der Sar et al. (2012) T. van der Sar, Z. H. Wang, M. S. Blok, H. Bernien, T. H. Taminiau, D. M. Toyli, D. A. Lidar, D. D. Awschalom, R. Hanson, and V. V. Dobrovitski, Nature (London) 484, 82 (2012).
- Dolde et al. (2013) F. Dolde, I. Jakobi, B. Naydenov, N. Zhao, S. Pezzagna, C. Trautmann, J. Meijer, P. Neumann, F. Jelezko, and J. Wrachtrup, Nature Physics 9, 139 (2013).
- Dolde et al. (2014) F. Dolde, V. Bergholm, Y. Wang, I. Jakobi, B. Naydenov, S. Pezzagna, J. Meijer, F. Jelezko, P. Neumann, T. Schulte-Herbrüggen, B. Jacob, and J. Wrachtrup, Nature Communications 5, 3371 (2014).
- Pfaff et al. (2014) W. Pfaff, B. Hensen, H. Bernien, S. B. van Dam, M. S. Blok, T. H. Taminiau, M. J. Tiggelman, R. N. Schouten, M. Markham, D. J. Twitchen, and R. Hanson, Science 345, 532 (2014).
- Taylor et al. (2008) J. M. Taylor, P. Cappellaro, L. Childress, L. Jiang, D. Budker, P. R. Hemmer, A. Yacoby, R. Walsworth, and M. D. Lukin, Nature Physics 4, 810 (2008).
- Balasubramanian et al. (2008) G. Balasubramanian, I. Y. Chan, R. Kolesov, M. Al-Hmoud, J. Tisler, C. Shin, C. Kim, A. Wojcik, P. R. Hemmer, A. Krueger, T. Hanke, A. Leitenstorfer, R. Bratschitsch, F. Jelezko, and J. Wrachtrup, Nature (London) 455, 648 (2008).
- Maze et al. (2008) J. R. Maze, P. L. Stanwix, J. S. Hodges, S. Hong, J. M. Taylor, P. Cappellaro, L. Jiang, M. V. Gurudev Dutt, E. Togan, A. S. Zibrov, A. Yacoby, R. L. Walsworth, and M. D. Lukin, Nature (London) 455, 644 (2008).
- Rittweger et al. (2009) E. Rittweger, K. Y. Han, S. E. Irvine, C. Eggeling, and S. W. Hell, Nature Photonics 3, 144 (2009).
- Acosta et al. (2009) V. M. Acosta, E. Bauch, M. P. Ledbetter, C. Santori, K.-M. C. Fu, P. E. Barclay, R. G. Beausoleil, H. Linget, J. F. Roch, F. Treussart, S. Chemerisov, W. Gawlik, and D. Budker, Phys. Rev. B 80, 115202 (2009).
- Fang et al. (2013) K. Fang, V. M. Acosta, C. Santori, Z. Huang, K. M. Itoh, H. Watanabe, S. Shikata, and R. G. Beausoleil, Phys. Rev. Lett. 110, 130802 (2013).
- Loubser and Van Wyk (1977) J. H. N. Loubser and J. A. Van Wyk, Diamond Research 1, 11 (1977).
- Manson et al. (2006) N. B. Manson, J. P. Harrison, and M. J. Sellars, Phys. Rev. B 74, 104303 (2006).
- Delaney et al. (2010) P. Delaney, J. C. Greer, and J. A. Larsson, Nano Lett. 10, 610 (2010).
- Goldman et al. (2015) M. L. Goldman, M. W. Doherty, A. Sipahigil, N. Y. Yao, S. D. Bennett, N. B. Manson, A. Kubanek, and M. D. Lukin, Phys. Rev. B 91, 16520 (2015).
- van Oort and Glasbeek (1989) E. van Oort and M. Glasbeek, Phys. Rev. B 40, 6509 (1989).
- Epstein et al. (2005) R. J. Epstein, F. M. Mendoza, Y. K. Kato, and D. D. Awschalom, Nat. Phys. 1, 94 (2005).
- Hanson et al. (2006b) R. Hanson, F. Mendoza, R. Epstein, and D. Awschalom, Phys. Rev. Lett. 97, 087601 (2006b).
- Rogers et al. (2008) L. J. Rogers, S. Armstrong, M. J. Sellars, and N. B. Manson, New Journal of Physics 10, 103024 (2008).
- Rogers et al. (2009) L. J. Rogers, R. L. McMurtrie, M. J. Sellars, and N. B. Manson, New Journal of Physics 11, 063007 (2009).
- Lai et al. (2009) N. Lai, D. Zheng, F. Jelezko, F. Treussart, and J.-F. Roch, Appl. Phys. Lett. 95, 133101 (2009).
- Armstrong et al. (2010) S. Armstrong, L. J. Rogers, R. L. Mcmurtrie, and N. B. Manson, Physics Procedia 3, 1569 (2010).
- Anishchik et al. (2015) S. V. Anishchik, V. G. Vins, A. P. Yelisseyev, N. N. Lukzen, N. L. Lavrik, and V. A. Bagryansky, New J. Phys. 17, 023040 (2015).
- Colegrove et al. (1959) F. D. Colegrove, P. A. Franken, R. R. Lewis, and R. H. Sands, Phys. Rev. Lett. 3, 420 (1959).
- Pravdivtsev et al. (2013a) A. N. Pravdivtsev, A. V. Yurkovskaya, R. Kaptein, K. Miesel, H.-M. Viethd, and K. L. Ivanov, Phys. Chem. Chem. Phys. 15, 14660 (2013a).
- Pravdivtsev et al. (2013b) A. N. Pravdivtsev, A. V. Yurkovskaya, H.-M. Viethd, and K. L. Ivanov, J. Chem. Phys. 139, 244201 (2013b).
- Clevenson et al. (2016) H. Clevenson, E. H. Chen, F. Dolde, C. Teale, D. Englund, and B. D, Phys. Rev. A 94, 021401 (2016).
- Anishchik and Ivanov (2016) S. V. Anishchik and K. L. Ivanov, “Level anti-crossing spectra of nitrogen-vacancy centers in diamond detected by using modulation of the external magnetic field,” (2016), arXiv:1609.06661 [quant-ph].
- Ivanov et al. (2008) K. L. Ivanov, A. V. Yurkovskaya, and H.-M. Viethd, J. Chem. Phys. 128, 154701 (2008).
- Steiner et al. (2010) M. Steiner, P. Neumann, J. Beck, F. Jelezko, and J. Wrachtrup, Phys. Rev. B 81, 035205 (2010).
Supplementary information
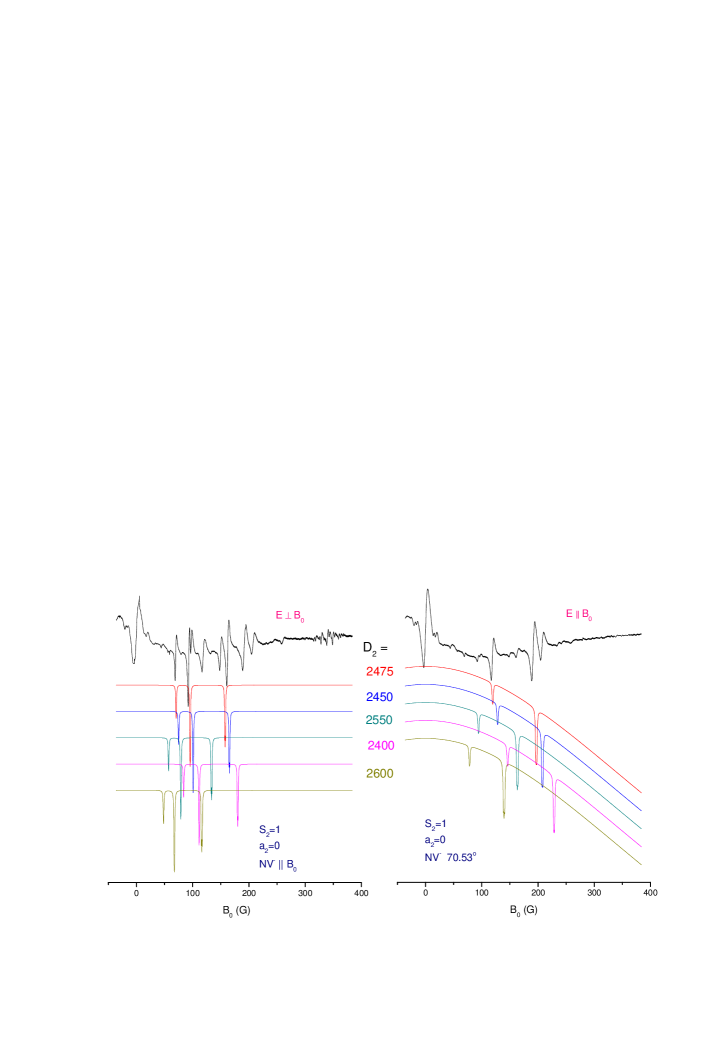
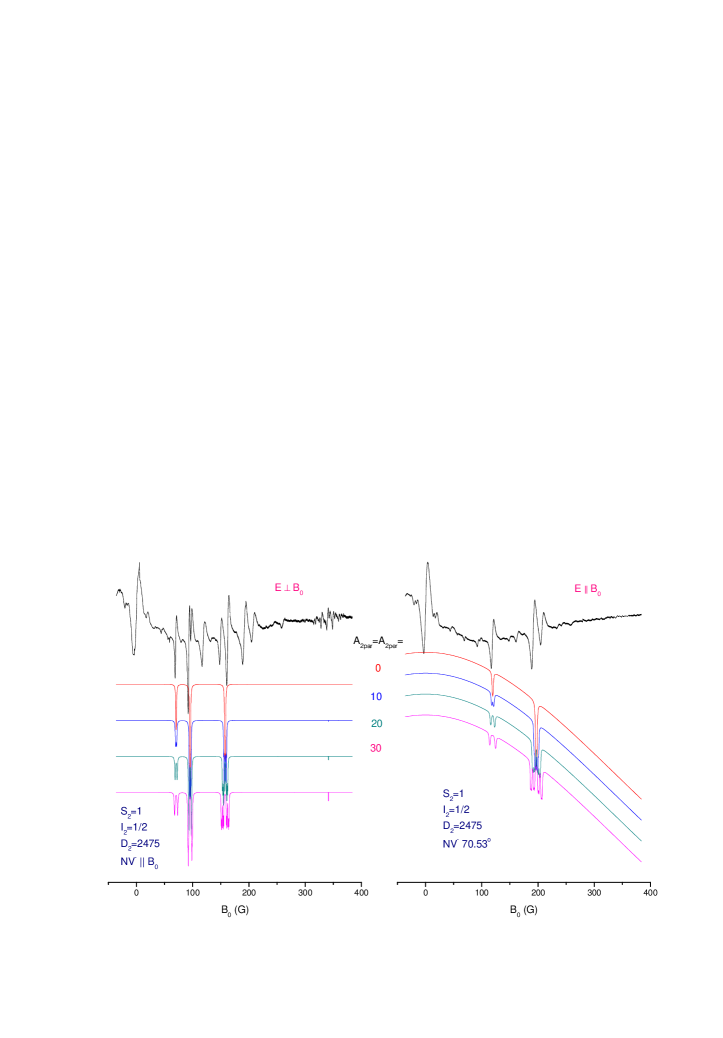
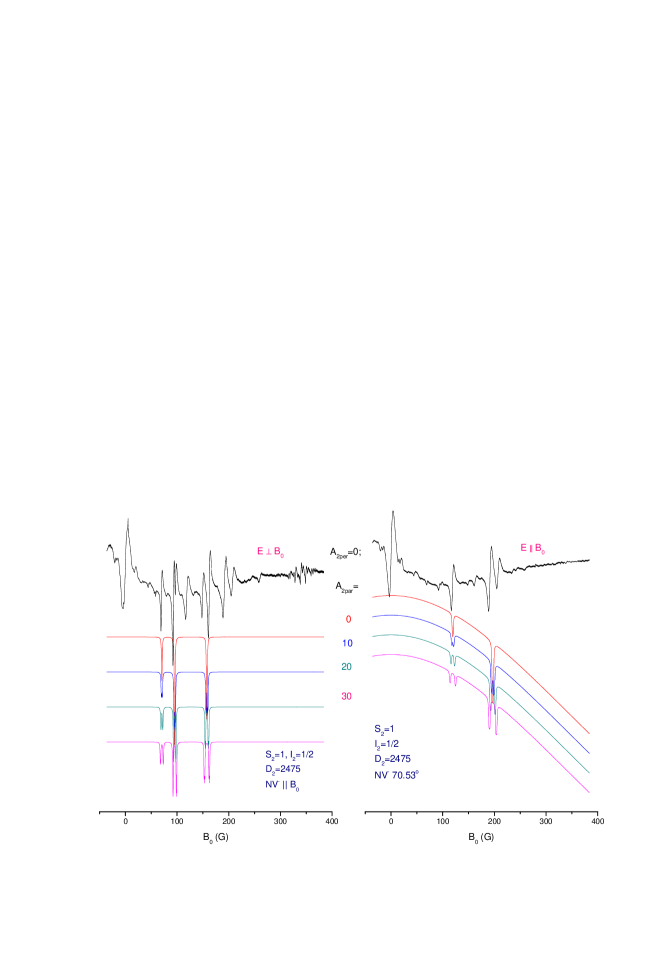
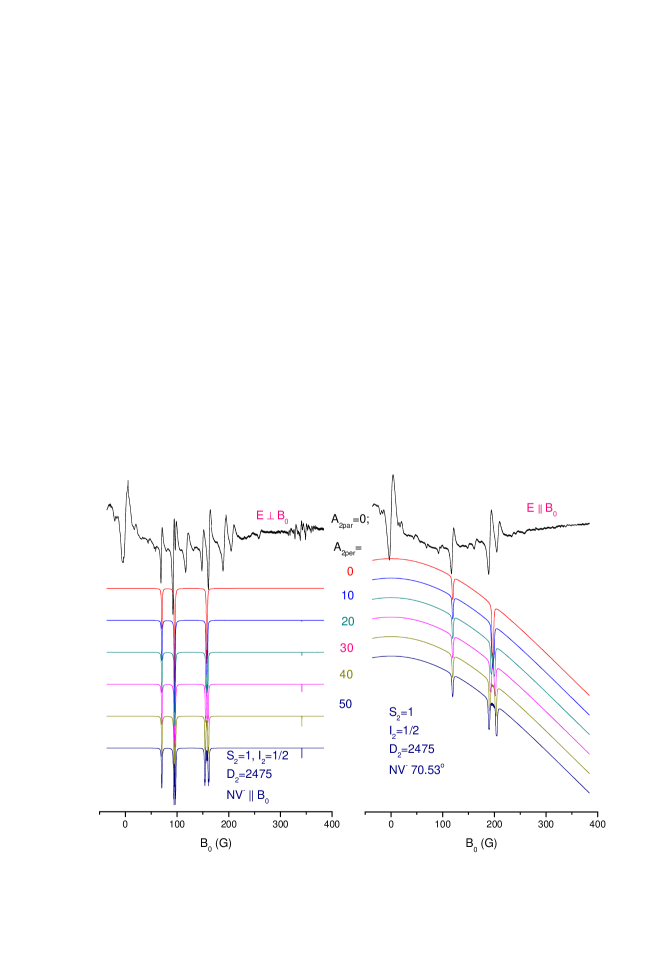
In Figs. 11–14 we present the experimental LAC-spectra of the SMP2 sample (for different light polarizations) along with theoretical simulations at different parameters. These figures clarify the relevant parameters as extracted from fitting. We shown only the field range from to G. For the unknown paramagnetic center, X, we assume that its nuclear spin is equal to 1 and . In all figures in the left we show the results for the NV- centers oriented along the magnetic field; in the right - for the centers tilted by 70.53o with respect to . In all cases we assumed that the X-center has the same symmetry as the NV- center and averaged over its four possible orientations.
In Fig. 11 we show the calculation performed assuming with different values. The parameter is equal to zero in all cases; the value (in MAX) corresponds to the same color of the curve. One can see that the best agreement with the experimental results is reached when MHz.
In Fig. 12 we assume that the HFC of the X-center is isotropic and vary its value. It is seen the experimental LAC-spectrum cannot be simulated at any non-zero HFC value.
In Fig. 13 we assume that the HFC censor is strongly anisotropic, namely, =0. Clearly the quality of the fits is the same as in the calculation assuming isotropic HFC.
Finally in Fig. 14 we assume that the HFC tensor is anisotropic but set =0. The agreement with the experiment becomes much better; however, the reason for is unclear.