GMRT Hi study of giant low surface brightness galaxies
Abstract
We present Hi observations of four giant low surface brightness (GLSB) galaxies UGC 1378, UGC 1922, UGC 4422 and UM 163 using the Giant Meterwave Radio Telescope (GMRT). We include Hi results on UGC 2936, UGC 6614 and Malin 2 from literature. Hi is detected from all the galaxies and the extent is roughly twice the optical size; in UM 163, Hi is detected along a broken disk encircling the optical galaxy. We combine our results with those in literature to further understand these systems. The main results are the following: (1) The peak Hi surface densities in GLSB galaxies are several times cm-2. The Hi mass is between M⊙, dynamical mass ranges from a few times M⊙ to a few times M⊙. (2) The rotation curves of GLSB galaxies are flat to the outermost measured point with rotation velocities of the seven GLSB galaxies being between 225 and 432 km s-1. (3) Recent star formation traced by near-ultraviolet emission in five GLSB galaxies in our sample appears to be located in rings around the galaxy centre. We suggest that this could be due to a stochastic burst of star formation at one location in the galaxy being propagated along a ring over a rotation period. (4) The Hi is correlated with recent star formation in five of the seven GLSB galaxies.
keywords:
galaxies: spiral - galaxies: evolution -radio lines: galaxies - techniques: interferometric1 Introduction
In the last few decades low surface brightness (LSB) galaxies have received a lot of attention. LSB galaxies are defined as disk galaxies with a central surface brightness 23 mag arcsec-2 (Impey & Bothun 1997) which distinguishes them from the high surface brightness (HSB) galaxies. The low surface brightness galaxies are missing in earlier optical catalogues due to sky brightness causing a strong bias against detection of objects with central surface brightness fainter than the Freeman value ( 21.65 0.35 mag arcsec-2). The accidental discovery of the first giant LSB (GLSB) galaxy Malin-1 by Bothun et al. (1987) demonstrates that there might be a large number of galaxies with similar properties (Bothun et al. 1990; Sprayberry et al. 1993; Sprayberry et al. 1995; O’Neil & Bothun 2000). Many LSB galaxies have since been identified in deep and large field survey (Schombert & Bothun 1988; Schombert et al. 1992; Davies et al. 1994; Schwartzenberg et al. 1995; Sprayberry et al. 1995). Surveys have revealed some LSB galaxies having disk scale lengths comparable to the Milky Way. LSB galaxies are host to a range of stellar populations, covering the entire range of H-R diagram (Zackrisson et al. 2005; Zhong et al. 2008). LSB galaxies show deficit in molecular gas (Schombert et al. 1990) which has been detected in only a few galaxies (Das et al. 2006; O’Neil et al. 2000; Das et al. 2010). LSB galaxies are very rich in Hi but have low gas surface densities and slowly rising Hi rotation curves. They have higher MHI/LB ratios as compared to HSB galaxies (de Blok et al. 1996). The Hi masses are close to 109 M⊙ (de Blok & McGaugh 1996) and the Hi surface density are usually close to the critical density for star formation (Kennicutt 1989; van der Hulst et al. 1993; de Blok et al. 1996). LSB galaxies comprise a significant fraction of the spiral galaxy population (McGaugh et al. 1995) and hence form an important class of spiral galaxies. Some LSB spirals have been found to be larger than the normal galaxy - these have been referred to as Giant LSB galaxies. In a Hi survey of 116 LSB galaxies, selected from the Bothun et al. (1985) catalog, carried out using the Arecibo and Nancay telescopes, 81 LSB galaxies were detected out of which 38 have Hi mass M⊙ (O’Neil et al. 2004). These 38 galaxies might be GLSB galaxies but this survey was done with a large telescope beam; interferometric observations are required to distinguish GLSB galaxies from HSB galaxies in the field of view.
On the basis of the study to date, it is clear that LSB galaxies have some different properties compared to the HSB galaxies possibly due to different evolutionary sequence. The galaxy evolution and its star formation history are strongly correlated with the environment in which the galaxy is evolving. The effect of the environment upon bright galaxies are well studied and there are noticeable variations in galaxy properties like morphology, color and magnitude.
In the present paper, we take up Hi 21cm-line study of the sample of seven GLSB galaxies, UGC 1378, UGC 1922, UGC 4422, UM 163, UGC 2936, UGC 6614 and Malin 2. This sample has been studied in the radio continuum by us in an earlier paper, Mishra et al. (2015). Here, we present Hi 21cm-line observations of the first four galaxies i. e. UGC 1378, UGC 1922, UGC 4422, UM 163 and employ the results on UGC 6614, Malin 2 from Pickering et al. (1997) and for UGC 2936 by Pickering et al. (1999). We refer to the basic properties and the parameters of the galaxies of the entire sample as given in Table 1 of Mishra et al. (2015).


| 11footnotetext: Flux densities from SETJY 22footnotetext: Flux densities and error from GETJY 33footnotetext: These data were taken with the old hardware backend at GMRT | UGC 1378 | UGC 1922 | UGC 4422 | UM 163 |
|---|---|---|---|---|
| Observing dates | 30-12-11 | 31-12-11 | 29-12-11 | 28-07-06 |
| Flux calibrator(s) | 3C 48 | 3C 48 | 3C 147, 3C 286 | 3C 48, 3C 286 |
| Flux density(Jy)a | 16.08 | 16.41 | 22.27, 14.86 | 16.31, 14.96 |
| Phase calibrator | 0217+738 | 3C 48 | 0842+185 | 2225-049 |
| Flux density(Jy)b | 2.600.03 | 16.410.02 | 1.160.01 | 7.530.15 |
| Central frequency (MHz) | 1397 | 1362 | 1392 | 1372 |
| Central velocity (kms-1) | 2935 | 10894 | 4330 | 10022 |
| Bandwidth (MHz) | 16 | 16 | 16 | 04 |
| tsource (hr) | 5.5 | 6.0 | 5.5 | 5.5 |
| No. of channels | 256 | 256 | 512 | 128 |
| Channel resolution (km s-1) | 13.8 | 14.2 | 6.9 | 6.6 |
| Synthesized beam/ | ||||
| Ang resolution | ||||
| RMS noise per channel | 1.5, 1.3, 1.0 | 1.7, 1.5, 1.1 | 2.4, 2.0, 1.5 | 1.1, 1.0, 0.8c |
| at diff. res.(mJy/beam) |
2 Observations And Data Analysis
11footnotetext: AIPS is distributed by the National Radio Astronomy Observatory, which is a facility of the National Science Foundation operated under cooperative agreement by Associated Universities, Inc.The observations were made with the Giant Metrewave Radio Telescope (GMRT; Swarup et al. 1991). The GMRT is an array of 30 antennas, each of 45 m in diameter spread over a maximum baseline length of 25 km. At a frequency of 1420 MHz, the system temperature and gain of the instrument are listed as 76 K and 0.22 KJy-1 respectively. The data on UM 163 were taken with the old hardware backend at GMRT and we had some flux calibration issues. The maps presented here have been made with the best possible solutions but we would like to caution the reader that these maps and estimated column densities need to be confirmed by future observations. Flux calibration was carried out using scans on any of the available standard calibrators (3C 48/ 3C 147/ 3C 286) which were observed at the start, end or middle of the observing run. Phase calibration was carried out using a nearby calibrator source. Phase calibrator was observed once in every 30 minutes. Bandpass calibration was carried out using the flux calibrators. The data were reduced using standard tasks in NRAO AIPS1. Bad data due to dead antennas and those with significantly lower gain than others, and radio frequency interference (RFI) were flagged. After removing bad data, the final gain tables were generated and the target source data were calibrated. The data were then imaged by using a cell size of . The spectral line cube was made after removing the continuum emission using the AIPS tasks UVSUB and IMLIN. The task IMAGR was used to get the final three-dimensional deconvolved Hi data cubes. We applied primary beam correction to all images by using PBCOR. DOPSET was used to obtain the frequency offset for the heliocentric velocity of the galaxy. From these cubes, the Hi emission and the Hi velocity field were extracted using the AIPS task MOMNT. Data cubes were made at various cutoffs in the uv plane, including 0-20 k, 0-10 k and 0-05 k and these were then convolved to a circular beam. These resulted in respective angular resolutions of about , and . Details of the observations are summarized in Table 1.
| 11footnotetext: Observed Hi linewidth 22footnotetext: Average value from rotation curve fitting using tilted ring model. In case of UGC 1922 we derived the inclination from the observed Hi ellipticity 33footnotetext: Hi mass: MHI= 2.36 105 D2 Hi flux, where the luminosity distance D is given in Mpc 44footnotetext: Dynamical mass Mdyn = (Vrot)2 R/G 55footnotetext: Single dish Hi flux from the GBT (beam 9′) (Hogg et al. 2007) 66footnotetext: Single dish Hi flux from the Arecibo (beam 3′.3) (Springob et al. 2005) 77footnotetext: Single dish Hi flux from the Parkes (beam 14′.3) (Doyle et al. 2005) 00footnotetext: * from Pickering et al. (1997, 1999) | UGC 1378 | UGC 1922 | UGC 4422 | UM 163 | UGC 2936* | UGC 6614* | Malin 2* |
| Hi flux (Jy km s-1) | 34.52.2 | 6.01.1 | 16.41.4 | 0.80.1 | 13.61.7* | 15.00.8* | 4.40.3* |
| W50,obs (km sa | 50015 | 64014 | 3208 | 10012 | 50010* | 28710* | 39215* |
| Vsys (km sb | 293810 | 1085312 | 430810 | …. | 38133* | 63537* | 138355* |
| Inclination(∘) b | 595 | 512 | 404 | …. | …. | …. | …. |
| Position angle (∘) b | 1816 | 1283 | 332 | …. | …. | …. | …. |
| Vrot (km sb | 28211 | 43212 | 2548 | …. | 256* | 227* | 320* |
| Hi(1010 M⊙)c | 1.20.2 | 3.20.4 | 1.50.5 | 0.340.04 | 0.81.0* | 2.50.2* | 3.60.4* |
| Mdyn (1011 M⊙)d | 7.40.9 | 22.02.1 | 4.51.0 | …. | 5.11.2 | 6.71.4 | 25.52.8 |
| MHI/ Mdyn () | 1.6 | 1.4 | 3.3 | …. | 1.6 | 3.7 | 1.4 |
| half Hi mass radius (kpc) | 18.8 | 26 | 15.5 | …. | …. | …. | …. |
| half light radius (kpc) | 9.5 | 22.7 | 7.5 | …. | …. | …. | …. |
| Single dish Hi flux (Jy km s-1) | 35.8e | 9.2f | 20.5f | 4.4 g | …. | …. | …. |
| Absolute B magnitude | -21.5 | -21.26 | -21.33 | -21.8 | -21.76 | -20.71 | -21.58 |
| (from Hyperleda) |
3 Results
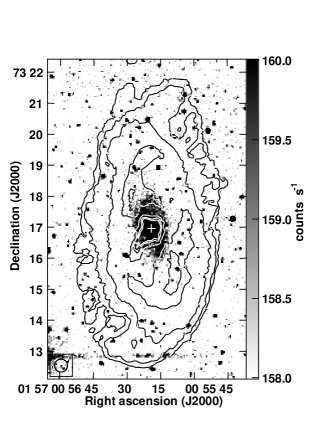
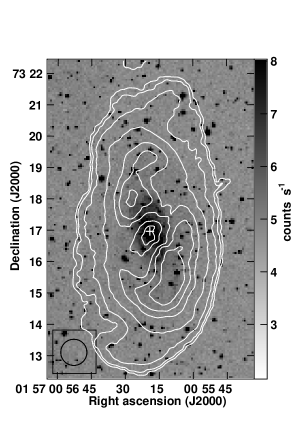
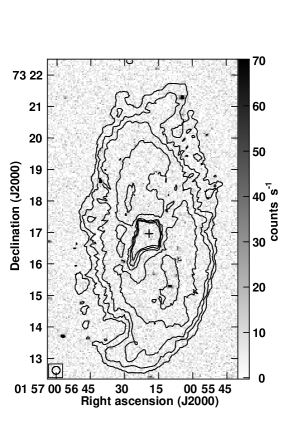
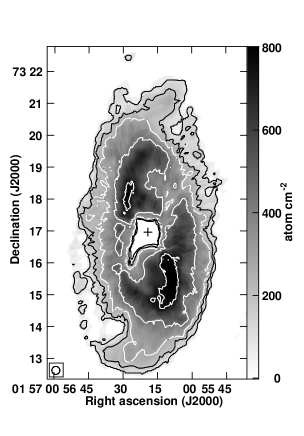
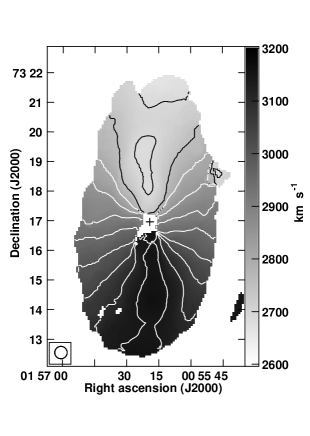
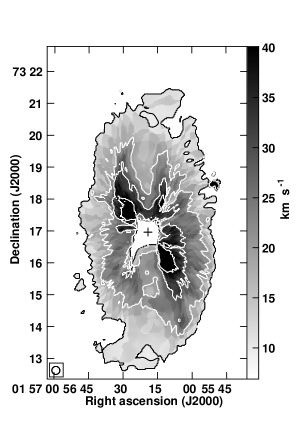
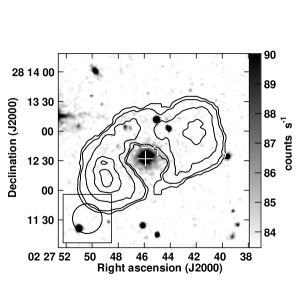
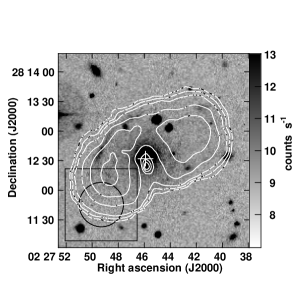
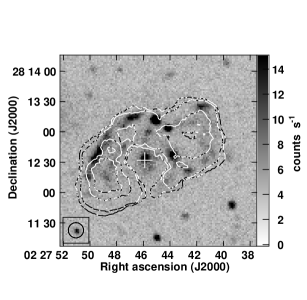
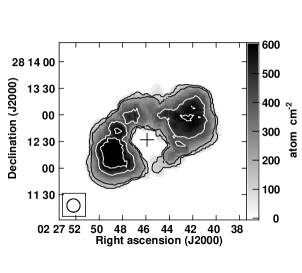
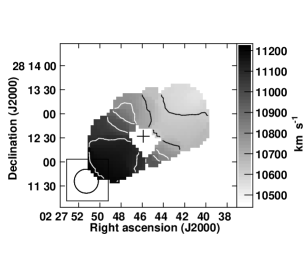
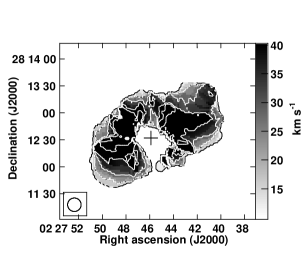
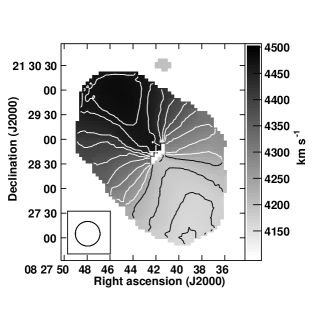
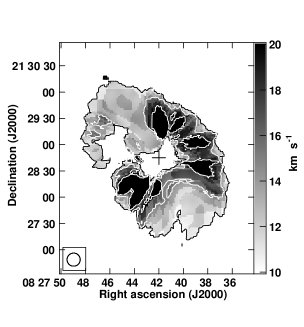
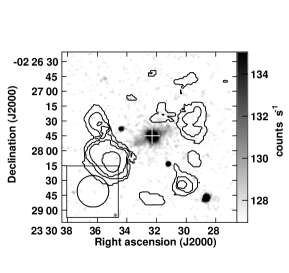
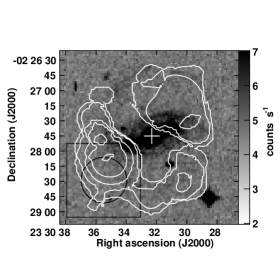
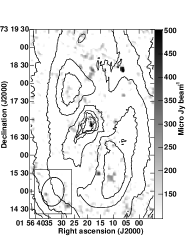
22footnotetext: http://skyview.gsfc.nasa.gov/current/cgi/query.plThe global Hi emission profiles of the sample galaxies made from low resolution maps are displayed in Figures 1(a)-(d) and various parameters derived from the Hi data are listed in Table 2. The half light radius of the galaxies approximated by half of the semi-major axis as listed by de Vaucouleurs et al. (1991) and radius of the region enclosing half the Hi mass of the galaxy are listed in Table 2. While for UGC 1378 and UGC 4422 the half Hi mass radius is close to twice that of half the semi-major axis; in the case of UGC 1922, half Hi mass radius is comparable to half the semi-major axis. Double horn profiles, characteristic of a rotating disk are observed. Total Hi intensity maps overlaid on near-infrared (NIR) from 2MASS2, B band emission from the Digitized Sky Survey (DSS)2, near-ultraviolet (NUV) from GALEX2, and Hi column density (moment 0) grey scale images are displayed in Figures 2 - 5(a)-(d). Hi velocity (moment 1) and velocity dispersion (moment 2) maps of these galaxies are displayed in Figures 2-5(e)-(f). High dispersion regions correspond to the high Hi column density regions in the galaxies. The Hi disks of three galaxies; UGC 1378, UGC 1922 and UGC 4422 show extended Hi disks of extent about twice the stellar disk whereas in UM 163, the Hi is detected in a broken disk around the optical galaxy. All the sample galaxies show mildly lopsided Hi distribution (e.g. PGC045080; Das et al. 2007) and a rotating disk. All the galaxies also show Hi absorption in the centre due to the active nucleus in these galaxies. Figures 6(a)-(d) show zoomed-in Hi total intensity contours overlaid on 610 MHz radio continuum maps (grey scale) taken from Mishra et al. (2015). Figures 7(a)-(c) show the rotation curves estimated for UGC 1378, UGC 1922 and UGC 4422. We could not estimate the rotation curve for UM 163 since the Hi is along a broken disk. In Table 2, we also include the properties of the galaxies UGC 2936, UGC 6614 and Malin 2 taken from Pickering et al. (1997, 1999) to enable us to study all the seven galaxies whose radio continuum study was presented in Mishra et al. (2015). In the following subsections we discuss the results on the individual galaxies.
3.1 UGC 1378
In Figure 1(a) the Hi spectrum produced from the spectral cube at resolution is shown. The total Hi flux is estimated to be 34.52.2 Jy km s-1 which gives a Hi mass estimate of 1.20.2 1010 M⊙ for a distance of 38.8 Mpc.
A Hi hole associated with the optical centre is detected in moment 0 maps. A region of about 30′′ ( 6kpc) appears to be evacuated of Hi, as seen in the highest resolution map (Figure 2d). This could be a combination of absorption against the active nucleus and lower Hi surface densities in the central bar. In our radio continuum map at 1.4 GHz (Mishra et al. 2015) a couple of compact sources are detected in the central 15′′ region. The observed Hi hole extends over both the sources and continues to the south-east.
The NIR disk of the galaxy is about 2′ in size (Figure 2(a)) whereas, the Hi disk is about 8′ in size (about 96 kpc). The morphology of the NIR emission with hints of spiral arms arising in the north-east and south-west matches with the high resolution Hi moment-0 map high Hi column density regions are seen in the north-east and south-west of the centre (Figure 2(d)).
The velocity field is regular across the galaxy (Figure 2(e)). The dispersion in the outer parts of the disk is 10 km s-1 increasing to 20 km s-1 in the inner 5′ (Figure 2(f)). The dispersion keeps increasing towards the centre of the galaxy and is 40 km s-1 in the central parts especially in the regions on either side of the centre along a position angle of about 45∘ which coincides with the high column density Hi. This high dispersion region coincides with the NIR disk. The GALEX image available for this galaxy is not deep enough and does not detect any NUV emission from the galaxy (Figure 2(c)). The radio continuum emission at 610 MHz is mostly confined to the central parts (see Figure 6(a)) and no Hi emission is seen to be coincident with the radio emission.
The rotation curve of UGC 1378 is shown in Figure 7(a). The rotation curve is flat out to a radial distance of 40 kpc.
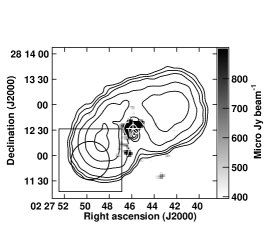
3.2 UGC 1922
The global Hi emission profile of UGC 1922 generated from the data at resolution is shown in Figure 1(b). The integrated flux is 6.01.1 Jy km s-1 and the Hi mass is 3.20.4 1010 M⊙ for a distance to the galaxy of 150 Mpc (refer to Table 2).
The galaxy shows a central Hi hole (Figures 3(a)-(d)) likely due to Hi absorption against the active nucleus. Enhanced NUV emission is seen along a broken ring to the north of the optical centre of the galaxy coinciding with the Hi emission. The blobby NUV emission skirts the highest Hi column densities and appears to trace a ring around the centre of the galaxy. This might indicate that the star formation has been triggered at the edges of the detected Hi distribution or has used up high column density Hi coincident with them. The radio continuum emission at 610 MHz is resolved (see Figure 6(b)), and confined to the central regions of this galaxy (Mishra et al. 2015).
The velocity field appears to be fairly regular with the gas approaching in the north and receding in the southern part (Figure 3(e)). The velocity dispersion in the central parts is about 50 km s-1 as seen in the high resolution maps. These motions are likely due to the central AGN. The rest of the galaxy shows an almost uniform dispersion of 30 km s-1 (Figure 3(f)). Some Hi is also detected from the north of the centre of the galaxy - the dispersion of gas here is similar to rest of the galaxy.
The observed rotation curve is shown in Figure 7(b). The rotation curve appears to be rising to the last measured point at a radial distance of 50 kpc from the centre of the galaxy.
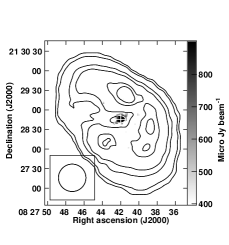
3.3 UGC 4422
The integrated Hi spectrum of UGC 4422 generated from the data at a resolution is shown in Figure 1(c). The estimated total integrated flux and the Hi mass are respectively, 16.41.4 Jy km s-1 and 1.50.5 1010 M⊙ for a distance to the galaxy of 63.4 Mpc (refer to Table 2).
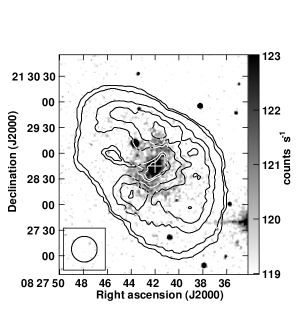
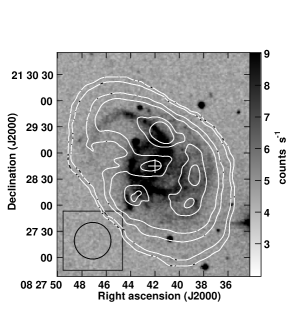
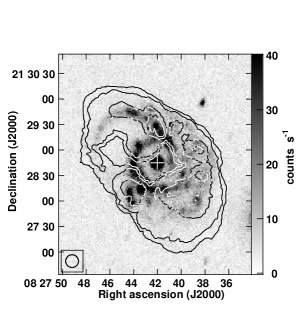
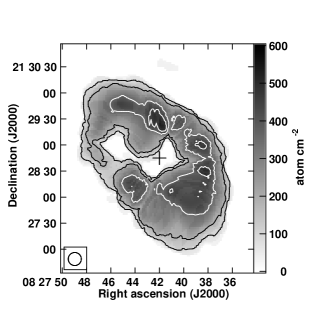
The Hi disk is larger than the optical disk and the star formation follows the Hi distribution (Figures 4(a)-(d)). A central hole in the Hi distribution due to the active nucleus is also seen in UGC 4422. NIR emission is confined to the central regions with diffuse emission surrounding an intense core. NHI in the central parts is 1021 atoms cm-2. The Hi morphology is well-correlated with the NUV morphology (Figure 4(c)). Highest column density clumps in the high angular resolution maps are clearly associated with vigorous star formation seen in the NUV (Figure 4(c)).
The velocity field across the galaxy displayed in Figure 4(e) ( ) appears undisturbed except for a warp in the outer parts. Some distortion in the velocity field north of the centre is also detected. The Hi velocity field is approaching in the south and receding in the northern parts. The velocity dispersion shows a smooth gradient from the outer parts to the inner parts. It is 10 km s-1 in the outer parts and rises to 20 km s-1 in the central part (Figure 4(f)). The radio continuum emission at 610 MHz is (see Figure 6(c)) is confined to the central regions whereas at 325 MHz (Mishra et al. 2015) coincidence between the Hi and the radio continuum emission is observed.
The observed rotation curve of this galaxy which is flat to the last measured point of about 28 kpc is shown in Figure 7(c).
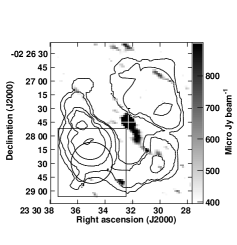
3.4 UM 163
The integrated Hi spectrum of UM 163 obtained from the cube of angular resolution of is shown in Figure 1(d). The total Hi flux estimated from the spectrum is 0.80.1 Jy km s-1, in disagreement with the value 4.4 Jy km s-1 estimated using single dish observations from the Parkes telescope (Doyle et al. 2005). Since their beam size is 14′.3, the observations are possibly picking up extended emission that GMRT observations are not sensitive to. The Hi mass corresponding to our observed flux is 0.340.04 1010 M⊙ for the galaxy distance of 136 Mpc (refer to Table 2). However using the Doyle et al. (2005) result, the Hi mass associated with the galaxy could be higher by at least five times.
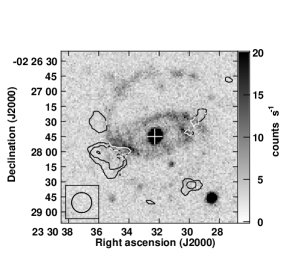
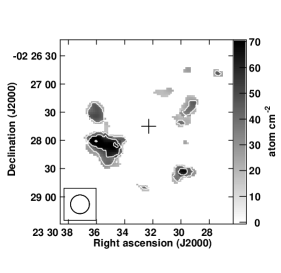
The Hi from this galaxy is detected along a disk which is broken in the north (Figures 5(a)-(d)). No Hi is detected from the optical centre of the galaxy. Highest Hi column densities are observed towards the eastern part of the galaxy. The peak column density that we observe from this galaxy is about atoms cm-2.
The DSS B band image detects a large bar-like structure extending out from the central source (Figure 5(b)). While higher Hi column densities are detected at the edges of the bar, no Hi is detected from the bar. It is possible that the Hi gas has been driven into the corotational ring by the strong bar. This may account for the lower Hi surface densities over the entire bar region. The SDSS optical images show a distinct circum-nuclear ring in the center, which could be due to nuclear star formation again triggered by the bar. Such behaviour has been observed in other barred spirals also. The NUV detects a ring around the central source with it emerging from the east and continuing north. The Hi is confined to a disk in the south with little correlation seen with the NUV (Figure 5(c)) along it.
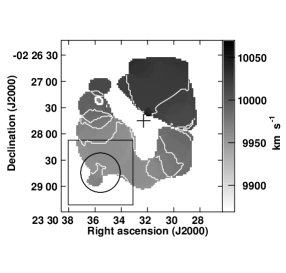
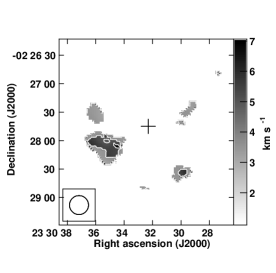
The velocity field (Figure 5(e)) smoothly varies along the disk from 9950 km s-1 in the east to 10020 km s-1 in the north-west region. However, higher velocities are seen at the tip of the disk in the east and both ends of the broken disk are moving at higher velocities compared to the central region. The velocity dispersion along the disk is low; ranging from 3 to 7 km s-1 (Figure 5(f)).
A likely explanation for the low Hi surface densities in the northern part of the disk of the galaxy could be that the recent burst of star formation has exhausted the high column density gas. Only low column density gas exists which our observations might not be sensitive to i. e. column densities lower than 1 1019 atoms cm-2. This needs to be further investigated and understood. The radio continuum emission at 610 MHz is confined to the central regions (see Figure 6(d)). No correlation is noticed between Hi and radio continuum emission.
4 Discussion
4.1 Rotation Curves of GLSB galaxies
We have estimated the rotation curves using the AIPS task GAL on the velocity field of the galaxies and determined their Hi centres, inclination, position angle and rotation velocity. The rotation curves are obtained using the tilted ring model (Begeman 1989). The rotation curve fitting procedure involves using the observed velocity field to derive five galaxy properties namely dynamical centre (X,Y), systemic velocity (Vsys), position angle (PA), inclination (Inc) and rotation velocity (Vrot). The velocities were averaged in elliptical annuli of width 10′′ . The centre, PA and the Inc estimated from Hi moment 0 map were taken as initial guesses. In the first iteration we kept all the parameters free. The inclination and centre was determined for each annulus and found to be more or less similar for all annuli for UGC 1378 and UGC 4422. In the next iteration, the inclination was fixed to the average value from the first iteration. The resulting rotation curves for UGC 1378 and UGC 4422 from this exercise are shown in Figure 7(a) and (c). The estimated rotation velocities are 282 and 254 km s-1. We could not fit a rotation curve to the velocity field of UM 163. The rotation curves were derived using the mid-resolution () velocity fields. The details of the fit are listed in Table 2.
The fitting for UGC 1922 was more involved. When all the parameters were kept free then we found that the inclination and PA showed variations with radial distance from the centre of the galaxy and the resulting rotation curve is shown by stars in Figure 7(b). The estimated rotation velocity is very large at 65842. From this run of GAL, we estimated an average value for the inclination which was 32 degrees and PA of 132 degrees which were fixed in the next iteration of GAL. This resulted in a rotation curve shown by the filled circles in Figure 7(b) and a rotation velocity of 58832 km s-1. This is also large and not commonly observed. To further check this, we derived the inclination from the observed Hi ellipticity which was 512 degrees. We re-ran GAL by fixing the inclination to 51 degrees and the resulting rotation curve gave a rotation velocity of 43212 km s-1 as shown by the filled squares in Figure 7(b). Although this is also large, we believe that till further observations can throw more light on this intriguing galaxy, this is the conservative estimate of the rotation velocity of UGC 1922. We believe that the rotation curve of UGC 1922 can be confirmed or otherwise if a better estimate of the inclination of the galaxy can be obtained. As noted above, if the inclination of UGC 1922 is 32 degrees then its rotation velocity comes out to be 588 km s-1 and if it is 51 degrees it is 432 km s-1. Nevertheless, UGC 1922 appears to be among the fastest rotating galaxies, which to the best of our knowledge are UGC 12591 (506 km s-1; Giovanelli et al. 1986) and NGC 1961 (402 km s-1; Courtois et al. 2015; Haan et al. 2008) as reported earlier in the literature. It is obvious that such galaxies are rare.
The position angle in all galaxies showed a slow variation of about . The rotation curves do not show any drop at large radial distance from the centre. Similarly flat rotation curves at large radial distances are also noted in UGC 2936 (Pickering et al. 1999), UGC 6614 and Malin 2 (Pickering et al. 1997). Thus all the six GLSB galaxies out of the total seven studied in radio continuum by Mishra et al. (2015) show a flat rotation curve to the outermost observed point - i.e. to a radial extent of about 42 kpc (220′′), 51 kpc (70′′) and 28 kpc (90′′) in UGC 1378, UGC 1922 and UGC 4422 whereas the radial extent of the optical disk is 20 kpc, 44 kpc and 15 kpc respectively. Similarly a flat rotation curve is observed upto radial distances of 35 kpc in UGC 2936 (Pickering et al. 1999), 50 kpc in UGC 6614 and 80 kpc in Malin 2 (Pickering et al. 1997) whereas the optical radial extent for these galaxies are 19 kpc, 21 kpc and 41 kpc. Thus, the Hi disk is roughly twice the size of the optical disk for all the GLSB galaxies and the rotation curve is flat over the detectable Hi disk. Flat rotation curves have also been observed in LSB spirals - five LSB spirals in van der Hulst et al. (1993), 19 LSB spirals in de Blok et al. (1996) although we note that one of the curves appears to show a drop and eight LSB galaxies in Pizzella et al. (2005).
The rotation velocities of the GLSB galaxies range from 225 to 432 km s-1. The dynamical mass estimated for the three galaxies observed here ranges from few times to few times M⊙. Thus except for UM 163 where Hi is detected in a disk around the central bar of the galaxy and the line width is only about 110 km s-1, all the GLSB galaxies are fast rotators. However we note that the LSB galaxies have lower rotation velocities between 30 and 120 km s-1 (de Blok et al. 1996).
LSB galaxies seldom seem to show a drop in the rotation velocity in the outer regions as seen in the sample of six GLSB galaxies; including the sample of Pickering et al. (1997, 1999) and 24 LSB galaxies (van der Hulst et al. 1993; de Blok & McGaugh 1996). One of the galaxies from the de Blok & McGaugh (1996) seems to suggest a slight fall in the rotation velocities in the outer parts. A few HSB galaxies have been found to show a drop in the rotation velocities in the outer parts of the galaxies (e.g Honma & Sofue 1997). Whether this difference is significant needs to be investigated using a larger sample of LSB galaxies.
4.2 Hi properties
The peak Hi surface density estimated from the maps made with a beamsize between 25′′ and 30′′ is lowest at cm-2 for UM 163 and highest at cm-2 for UGC 1378. For the maps with a resolution close to 15′′, we detect gas with peak surface densities of cm-2 in the centre of UGC 1378. Thus, such high surface density Hi clumps are likely to be present in LSB galaxies explaining the observed star formation. The peak surface densities detected in the six galaxies observed by van der Hulst et al. (1993) at a resolution of about 25′′ was between cm-2. For a resolution of about 22′′, Pickering et al. (1999) recorded a peak surface density ranging from cm-2 for the three GLSB galaxies that they studied.
All the four galaxies studied here show a hole in the centre of the Hi distribution where an active nucleus is present. The Hi is likely absorbed against this. The Hi appears to avoid the central bar as seen in both UGC 1378 and UM 163. This has been noted in HSB galaxies also. All the galaxies show some lopsidedness as seen in their integrated spectra. All the GLSB galaxies have large Hi content. The Hi mass estimated for the seven galaxies lies in the range M⊙. The Hi distribution and star formation are well-correlated for two (UGC 1922, UGC 4422) of the four galaxies studied here whereas no correlation is seen for one of the galaxies UM 163.
We note that UGC 1922, UGC 4422 and UM 163 have been catalogued as members of the Low Density Contrast Extended (LDCE) groups (Crook et al. 2007; Crook et al. 2008). UGC 4422 is also classified as member of a Lyon Galaxy Group (LGG; Garcia 1993). UGC 1378 is not classified as a group member. It can be assumed that the tidal interactions in the LDCE groups are weaker than in the LGG groups. The velocity field of the four galaxies presented here appear undisturbed. The velocity field of UGC 2936 (Pickering et al. 1999) also appears undisturbed. The kinematics of UGC 6614, which has a low inclination, shows a peculiar behaviour with the major axis of the Hi distribution being perpendicular to kinematical major axis and could be a result of a warp (van der Hulst et al. 1993). We could not find information on the detailed velocity field of Malin 2. However the undistorted velocity fields of at least five galaxies support the picture of these galaxies being subjected to none or only weak tidal forces since they evolve in under-dense regions (Bothun et al. 1993).
As pointed out by van der Hulst et al. (1993) from their study of six LSB galaxies in Hi, these galaxies have normal Hi mass to light ratios and also the fraction of dynamical mass in Hi; the differences are that LSB galaxies have more extended Hi and average surface densities which are about a factor of 2 lower than in HSB spirals. LSB disks have a mean younger age compared to HSB disks as deduced from their bluish colours in the optical (van der Hulst et al. 1993). The Hi mass of these LSB galaxies ( M⊙; van der Hulst et al. 1993) is an order of magnitude lower than that of the seven GLSB galaxies ( M⊙) discussed here. The fraction of dynamical mass in Hi is comparable at in GLSB galaxies and for most LSB galaxies (van der Hulst et al. 1993; de Blok et al. 1996).
LSB galaxies follow the same Tully-Fisher (TF) relation as HSB galaxies (Zwaan et al. 1995; McGaugh et al. 2000; McGaugh 2005). This implies that LSB galaxies compared to HSB galaxies of similar properties have M/L and sizes larger by factor of two. We find that out of the sample of seven GLSB galaxies discussed here six follow the TF relation. UM 163 is an outlier whose B band magnitude is similar to the other LSB galaxies but the line width is narrow. This is the galaxy in which the Hi is observed in a broken disk.
4.3 Star formation along rings
The star formation traced by the NUV and FUV emission from GALEX in the GLSB galaxies appears to indicate that recent star formation is along rings or broken rings. Several rings of NUV emission are seen in the GLSB galaxies - UGC 6614 and Malin 2 (see Figure 6, 7 in Mishra et al. 2015). Enhanced NUV emission along broken rings are visible in UGC 1922 (Figure 3(c)), UGC 4422 (Figure 4(c)) and UM 163 (Figure 5(c)). Out of the total seven GLSB galaxies studied by Mishra et al. (2015), five galaxies show star formation along rings around the centre of the galaxies. We also examined a sample of 16 LSB galaxies whose GALEX results are presented in Boissier et al. (2008) to search for star formation along rings. However except for a couple of possible cases, we did not find this to be a common occurrence in that sample. This difference in GLSB galaxies and LSB galaxies could possibly indicate lack of sufficiently dense Hi gas in the smaller LSB galaxies as compared to GLSB galaxies or sensitivity of the NUV observations. While such rings have been commonly observed in both atomic gas and in optical emission in tidally interacting galaxies, their presence in relatively isolated galaxies argues for a modified explanation. One possible explanation we suggest is that a burst of star formation is spread along a ring over a rotation period for relatively isolated galaxies. The trigger of this star formation could be a weak tidal interaction or a random local perturbation in sufficiently dense neutral gas.
In isolated galaxies, the perturbation would travel along the ring over a rotation period and if sufficiently dense gas is available along the ring, can trigger star formation along it. Three such rings of star formation have been seen in the isolated spiral NGC 7217 (Verdes-Montenegro et al. 1995). Since such star forming rings are also observed in galaxies subject to tidal interactions, there should be a way to distinguish between these two scenarios. If the galaxy was subject to strong tidal interactions, it can lead to gas condensing to higher densities at several locations. Subsequently star formation can be simultaneously triggered at several high density locations in a galaxy including along a ring. In this scenario, the age of the stars in the entire ring will be similar. On the other hand, in the isolated galaxy/GLSB scenario, since the differential rotation is held responsible for propagating the star formation along a ring, the stellar ages are likely to show a gradient along the ring to within a rotation period. It would be interesting to verify this by studying the stellar ages along rings in tidally interacting galaxies and in GLSB galaxies.


5 Summary
In this paper we presented the Hi emission study of a sample of four giant LSB galaxies - UGC 1378, UGC 1922, UGC 4422 and UM 163- using GMRT to examine the morphology and dynamics. We observed extended gas disks and found the Hi masses 109 M⊙. A double-horned Hi profile similar to HSB galaxies is observed in the sample galaxies.
The following are the main results from the study:
(1) All the GLSB galaxies have Hi disk roughly twice the optical sizes. The Hi disks are seen mildly lopsided in the integrated line profiles. All the galaxies show a hole in their Hi distribution in the centres of the galaxies likely due to the active nucleus.
(2) The peak Hi surface densities are several times cm-2 for most of the GLSB galaxies. This seems to suggest that there do exist regions of high surface densities in GLSB galaxies, sufficient to support star formation.
(3) The rotation curves of GLSB galaxies and LSB galaxies are flat out to the last measured points. This is seen for six (excepting UM 163) of the seven GLSB galaxies and in 24 LSB galaxies (van der Hulst et al. 1993; de Blok et al. 1996) all derived from Hi data which measure the rotation beyond the optical disk.
(4) Six of the seven GLSB galaxies follow the same TF relation as HSB galaxies. UM 163 is an outlier with its blue luminosity being similar to the other GLSB galaxies but the Hi line width being narrow.
(5) Six of the seven GLSB galaxies show star formation along ring(s) or broken ring(s) around the centre of the galaxy as inferred from enhanced NUV emission seen in GALEX images. It is difficult to comment on the seventh galaxy UGC 1378 where only a shallow GALEX image exists. Since there is a deficit of galaxies within 2 Mpc around LSB galaxies (Bothun et al. 1993), the existence of rings cannot be attributed to strong tidal interaction. We suggest that in these relatively isolated galaxies, star formation is triggered locally where sufficient Hi surface densities are available and it propagates along a ring over a rotation period of the galaxy - thus the stellar age along the ring should show a gradient. No such gradient is expected in star formation triggered by a tidal event. A detailed stellar age study is required to verify this result.
(6) The star forming regions appear to be correlated with the Hi distribution in five of the seven GLSB galaxies studied here. However little correlation between the NUV emission and Hi is visible in UM 163. A burst of star formation might have exhausted high column density gas.
(7) Since GLSB galaxies are not subject to intense tidal interactions (Bothun et al. 1993), the mean Hi surface densities have remained low -may be indicating the important role tidal interactions play in enhancing Hi surface densities and condensation into molecular gas in HSB galaxies.
(8) Finally, there appears to be no compelling reasons to support different formation scenarios for LSB and HSB spirals since the primordial quantities like galaxy masses (stellar disk + Hi content + dark matter content) and rotation velocities are statistically comparable. The differences in star formation rates, mass of the central black hole and Hi surface densities are dynamic on shorter timescales and can be explained by the under-dense environments that these LSB galaxies inhabit and the comparatively dense environment that HSB galaxies inhabit.
Acknowledgments
We thank the referee, Greg Bothun for insightful comments that improved the content of this paper. We thank the staff of the GMRT who made the observations possible. The GMRT is operated by the National Centre for Radio Astrophysics of the Tata Institute of Fundamental Research. NGK acknowledges the generous use of NASA’s Astrophysics Data System, NASA/IPAC Extragalactic Database (NED), Hyperleda database (http://leda.univ-lyon1.fr), Astrophysics arXivs, Wikipedia and Google search engine in this research. This publication makes use of data products from the 2MASS, which is a joint project of the University of Massachusetts and the Infrared Processing and Analysis Center/California Institute of Technology, funded by the National Aeronautics and Space Administration and the National Science Foundation. The NASA/IPAC Extragalactic Data base (NED) both of which are operated by Jet Propulsion Laboratory, California Institute of Technology under contract with the National Aeronautics and Space Administration.
References
- Begeman (1989) Begeman K. G., 1989, A&A, 223, 47
- Boissier et al. (2008) Boissier S., Gil de Paz A., Boselli A., Buat V., Madore B., Chemin L., Balkowski C., Amram P., Carignan C., van Driel W., 2008, ApJ, 681, 244
- Bothun et al. (1985) Bothun G. D., Beers T. C., Mould J. R., Huchra J. P., 1985, AJ, 90, 2487
- Bothun et al. (1987) Bothun G. D., Impey C. D., Malin D. F., Mould J. R., 1987, AJ, 94, 23
- Bothun et al. (1990) Bothun G. D., Schombert J. M., Impey C. D., Schneider S. E., 1990, ApJ, 360, 427
- Bothun et al. (1993) Bothun G. D., Schombert J. M., Impey C. D., Sprayberry D., McGaugh S. S., 1993, AJ, 106, 530
- Courtois et al. (2015) Courtois H. M., Zaritsky D., Sorce J. G., Pomarède D., 2015, MNRAS, 448, 1767
- Crook et al. (2007) Crook A. C., Huchra J. P., Martimbeau N., Masters K. L., Jarrett T., Macri L. M., 2007, ApJ, 655, 790
- Crook et al. (2008) Crook A. C., Huchra J. P., Martimbeau N., Masters K. L., Jarrett T., Macri L. M., 2008, ApJ, 685, 1320
- Das et al. (2010) Das M., Boone F., Viallefond F., 2010, A&A, 523, A63
- Das et al. (2007) Das M., Kantharia N., Ramya S., Prabhu T. P., McGaugh S. S., Vogel S. N., 2007, MNRAS, 379, 11
- Das et al. (2006) Das M., O’Neil K., Vogel S. N., McGaugh S., 2006, ApJ, 651, 853
- Davies et al. (1994) Davies J. I., Disney M. J., Phillipps S., Boyle B. J., Couch W. J., 1994, MNRAS, 269, 349
- de Blok & McGaugh (1996) de Blok W. J. G., McGaugh S. S., 1996, ApJ, 469, L89
- de Blok et al. (1996) de Blok W. J. G., McGaugh S. S., van der Hulst J. M., 1996, MNRAS, 283, 18
- de Vaucouleurs et al. (1991) de Vaucouleurs G., de Vaucouleurs A., Corwin Jr. H. G., Buta R. J., Paturel G., Fouque P., 1991, S&T, 82, 621
- Doyle et al. (2005) Doyle M. T., Drinkwater M. J., Rohde D. J., Pimbblet K. A., Read M., Meyer M. J., Zwaan M. A., Ryan-Weber E., Stevens J., Koribalski B. S., 2005, MNRAS, 361, 34
- Garcia (1993) Garcia A. M., 1993, A&AS, 100, 47
- Giovanelli et al. (1986) Giovanelli R., Haynes M. P., Rubin V. C., Ford Jr. W. K., 1986, ApJ, 301, L7
- Haan et al. (2008) Haan S., Schinnerer E., Mundell C. G., García-Burillo S., Combes F., 2008, AJ, 135, 232
- Hogg et al. (2007) Hogg D. E., Roberts M. S., Haynes M. P., Maddalena R. J., 2007, AJ, 134, 1046
- Honma & Sofue (1997) Honma M., Sofue Y., 1997, PASJ, 49, 539
- Impey & Bothun (1997) Impey C., Bothun G., 1997, ARA&A, 35, 267
- Kennicutt (1989) Kennicutt Jr. R. C., 1989, ApJ, 344, 685
- McGaugh (2005) McGaugh S. S., 2005, ApJ, 632, 859
- McGaugh et al. (1995) McGaugh S. S., Schombert J. M., Bothun G. D., 1995, AJ, 109, 2019
- McGaugh et al. (2000) McGaugh S. S., Schombert J. M., Bothun G. D., de Blok W. J. G., 2000, ApJ, 533, L99
- Mishra et al. (2015) Mishra A., Kantharia N. G., Das M., Srivastava D. C., Vogel S. N., 2015, MNRAS, 447, 3649
- O’Neil & Bothun (2000) O’Neil K., Bothun G., 2000, ApJ, 529, 811
- O’Neil et al. (2004) O’Neil K., Bothun G., van Driel W., Monnier Ragaigne D., 2004, A&A, 428, 823
- O’Neil et al. (2000) O’Neil K., Hofner P., Schinnerer E., 2000, ApJ, 545, L99
- Pickering et al. (1997) Pickering T. E., Impey C. D., van Gorkom J. H., Bothun G. D., 1997, AJ, 114, 1858
- Pickering et al. (1999) Pickering T. E., van Gorkom J. H., Impey C. D., Quillen A. C., 1999, AJ, 118, 765
- Pizzella et al. (2005) Pizzella A., Corsini E. M., Dalla Bontà E., Sarzi M., Coccato L., Bertola F., 2005, ApJ, 631, 785
- Schombert & Bothun (1988) Schombert J. M., Bothun G. D., 1988, AJ, 95, 1389
- Schombert et al. (1990) Schombert J. M., Bothun G. D., Impey C. D., Mundy L. G., 1990, AJ, 100, 1523
- Schombert et al. (1992) Schombert J. M., Bothun G. D., Schneider S. E., McGaugh S. S., 1992, AJ, 103, 1107
- Schwartzenberg et al. (1995) Schwartzenberg J. M., Phillipps S., Smith R. M., Couch W. J., Boyle B. J., 1995, MNRAS, 275, 121
- Sprayberry et al. (1995) Sprayberry D., Impey C. D., Bothun G. D., Irwin M. J., 1995, AJ, 109, 558
- Sprayberry et al. (1993) Sprayberry D., Impey C. D., Irwin M. J., McMahon R. G., Bothun G. D., 1993, ApJ, 417, 114
- Springob et al. (2005) Springob C. M., Haynes M. P., Giovanelli R., Kent B. R., 2005, ApJS, 160, 149
- Swarup et al. (1991) Swarup G., Ananthakrishnan S., Kapahi V. K., Rao A. P., Subrahmanya C. R., Kulkarni V. K., 1991, CURRENT SCIENCE V.60, NO.2/JAN25, P. 95, 1991, 60, 95
- van der Hulst et al. (1993) van der Hulst J. M., Skillman E. D., Smith T. R., Bothun G. D., McGaugh S. S., de Blok W. J. G., 1993, AJ, 106, 548
- Verdes-Montenegro et al. (1995) Verdes-Montenegro L., Bosma A., Athanassoula E., 1995, A&A, 300, 65
- Zackrisson et al. (2005) Zackrisson E., Bergvall N., Östlin G., 2005, A&A, 435, 29
- Zhong et al. (2008) Zhong G. H., Liang Y. C., Liu F. S., Hammer F., Hu J. Y., Chen X. Y., Deng L. C., Zhang B., 2008, MNRAS, 391, 986
- Zwaan et al. (1995) Zwaan M. A., van der Hulst J. M., de Blok W. J. G., McGaugh S. S., 1995, MNRAS, 273, L35