The Virial Relation and Intrinsic Shape of Early-Type Galaxies
1 Introduction
Early-type galaxies (ETGs) are known to follow characteristic scaling relations between several structural parameters including, most prominently, the line-of-sight velocity dispersion of their stars. The first of these relations to be discovered was the Faber–Jackson relation between velocity dispersion and galactic luminosity (Faber & Jackson, 1976). Subsequent work led to the discovery of the “classic” fundamental plane relation , or equivalently, which include the (two-dimensional, projected) effective (half-light) radius and the average surface brightness within (Dressler et al., 1987; Djorgovski & Davis, 1987); recent studies (Cappellari et al., 2013) find and . From the virial relation , with being the galaxy mass, one expects and ; the tilt of the fundamental plane, i.e. the discrepancy between expected and observed values, can be ascribed to a scaling of mass-to-light ratio with velocity dispersion (Cappellari et al. 2006; but see also Cardone et al. 2011). The Faber–Jackson relation can be understood as a projection of the fundamental plane onto the – plane (but see also Sanders 2010).
Whereas scaling relations that involve are convenient because the luminosity is an observable, the galactic dynamics is controlled by the galaxy mass for which is a proxy. For pressure-supported stellar systems, mass and velocity dispersion are connected via the virial relation
| (1) |
where is Newton’s constant and is a geometry factor of order unity (e.g., Binney & Tremaine, 2008). Accordingly, a “more fundamental plane” (Bolton et al., 2007) is given by the “mass plane” relation ; from the virial theorem, one expects and (see also Cappellari 2016 for a recent review).
Testing the validity and accuracy of Equation (1) is important as virial mass estimators of this type are widely applied to pressure-supported stellar systems. Fundamental plane studies usually derive masses from photometry and equate them with dynamical masses, presuming an equality of the two. A deviation from the theoretical relation would imply the presence of additional “hidden” parameters or dependencies between parameters. Else than for relations between luminosity and other parameters, a tilt in the mass plane would be connected immediately to the dynamics or structure of galaxies. To date, the virial relation (Equation 1) is commonly assumed to be valid exactly (cf., e.g., Cappellari et al. 2013). This is, however, not undisputed. Based on an analysis of about 50 000 SDSS galaxies, Hyde & Bernardi (2009) concluded that . More recent observations, accompanied by more sophisticated dynamical modeling, of early-type galaxies in three nearby galaxy clusters find (Scott et al., 2015). This raises the question to what extend Equation (1) is appropriate for describing the dynamics of ETGs, and which alternative formulations might be necessary.
2 Data
This work is primarily based on the ATLAS3D database of Cappellari et al. (2011, 2013). In addition, I use the dataset of Saglia et al. (2016) for an independent check. The two samples cannot be combined directly because they employ different conventions for calculating effective stellar velocity dispersions.
2.1 The ATLAS3D Sample
The ATLAS3D project (Cappellari et al., 2011, 2013) provides111http://www-astro.physics.ox.ac.uk/atlas3d data for a volume-limited sample of 260 nearby (located within 42 Mpc) early-type galaxies. For each galaxy, the surface brightness distribution is modeled with a Multi-Gaussian Expansion (MGE) algorithm. The results are fed into an Jeans Anisotropic MGE (JAM) algorithm which computes predictions for the line-of-sight velocity dispersion distribution in the sky plane. These values are compared to observed velocity dispersion distributions obtained from optical integral-field spectroscopy. The best-fit JAM models provide the effective radius and masses . For each galaxy, an effective velocity dispersion is measured from a combined spectrum co-added over an ellipse of area .
As the JAM results vary in quality, some quality-based selection of data is needed. Following the suggestion of Cappellari et al. (2013), I select galaxies for which there is at least a “good” (quality flag 2) agreement between predicted and observed velocity dispersion distributions. This results in a final dataset comprising 101 galaxies. The selected galaxies have (JAM) masses between and , effective velocity dispersions between 70 and 280 , and effective radii ranging from 0.5 kpc to 7 kpc. Formal uncertainties are 10% (0.041 dex) for effective radii, 5% (0.021 dex) for effective velocity dispersions, and 12% (0.049 dex) for galaxy (JAM) masses.
2.2 The Sample of Saglia et al. (2016)
The dataset by Saglia et al. (2016) provides data for 72 local (located within 150 Mpc) elliptical galaxies and classical bulges. Classical bulges can be regarded as elliptical galaxies that formed new disks around them; they follow the same parameter correlations as “free” ellipticals do (Kormendy & Bender, 2012). Accordingly, I will treat both types of objects jointly from now on. The sample of Saglia et al. (2016) was selected for studies of black hole – host galaxy relations and combines (re-calibrated where necessary) literature results with new integral-field spectroscopic observations.
For each galaxy, mass and scale radius are derived from photometry. Each target is decomposed into its elliptical bulge and other components like disks, rings, or bars (if any). Bulge masses are calculated from their luminosities using mass-to-light ratios derived from dynamical modeling. The three-dimensional spherical half-mass radii are used as scale radii. The effective stellar velocity dispersion is derived from a brightness-weighted sum of the squares of velocity dispersion and rotation speed over radii from 0 to . The radii and are related like (Saglia et al. 2016 for their sample; see also Hernquist 1990; Wolf et al. 2010 for general derivations).
Sample galaxies were selected with emphasis on covering a wide range in , from 70 to 390 . Half-mass radii range from 0.1 kpc to 32 kpc, bulge masses are located between and . Median formal uncertainties are 21% (0.083 dex) for bulge masses, 5% (0.021 dex) for effective velocity dispersions, and 25% (0.096 dex) for half-light radii.
3 Analysis and Results
3.1 The Virial Relation
3.1.1 Effective Radius as Scale Radius
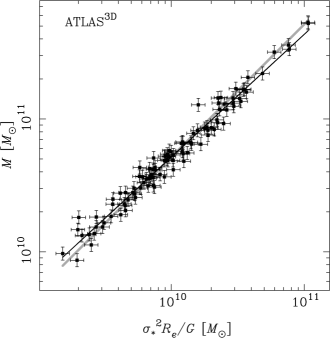
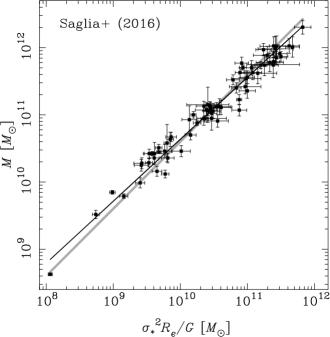
Masses, velocity dispersions, and radii are (supposed to be) connected via the virial relation expressed by Equation (1). Figure 1 shows mass as function of virial term for the two samples. Assuming a linear relation gives the best agreement for an ensemble-averaged and (standard errors of means) for the ATLAS3D and Saglia et al. (2016) samples, respectively, in full agreement with Cappellari et al. (2013) (for ATLAS3D). Assuming that different conventions for calculating explain the difference entirely, the velocity dispersions of Saglia et al. (2016) are systematically higher than the ones of ATLAS3D by 13%.
Taking a closer look however, the data deviate systematically from a naive linear relation. For a quantitative analysis I use the generalized virial relation
| (2) |
where and are free parameters; mass and virial term are normalized by their approximate medians in order to minimize the covariance of the fit parameters. Logarithms are decadic. Equation (2) describes a “restricted mass plane” because and are coupled like instead of a more general relation with independent and . By construction, the restricted mass plane probes the evolution of the ratio of observed and dynamically expected masses.
I fit Equation (2) to the data via a standard weighted linear least-squares regression. Error bars are rescaled iteratively such that min. The best-fit slopes are and (with formal errors) for the ATLAS3D and Saglia et al. (2016) data, respectively. Both values are in good agreement with each other and both are significantly – by and , respectively – smaller than unity: the empirical relation is flatter than the theoretical one. The intrinsic scatter (i.e., the difference in squares of rms residual and bivariate rms measurement error) about the best-fit lines is consistent with zero in both cases.
3.1.2 Semi-Major Axis Length as Scale Radius
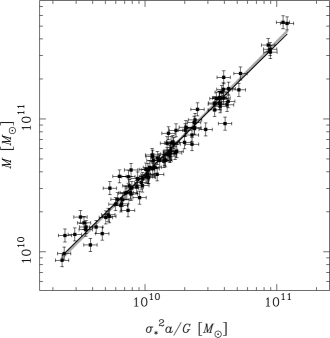
The effective radius is given by , with and being the semi-major and semi-minor axis of the projected ellipse that encloses half of the galaxy light, respectively. As argued by, e.g., Hopkins et al. (2010), the semi-major axis is a more robust proxy for the physical scale radius of a galaxy than . Replacing with results in a modified virial relation
| (3) |
which replaces Equation (1) and an updated “restricted mass plane” relation
| (4) |
which replaces Equation (2). By definition, and are related like , with being the ellipticity. The discussion in the remainder of Section 3 refers to the ATLAS3D dataset only because Saglia et al. (2016) do not provide ellipticity or semi-major axis length information for their sample galaxies.
Figure 2 shows galaxy mass as function of virial term , with computed from and . Assuming a linear relationship gives an ensemble-averaged virial factor , again in good agreement with Cappellari et al. (2013). Fitting Equation (4) to the data (in the same way as done in Section 3.1.1) results in a slope of – which agrees with unity within errors. The intrinsic scatter about the best-fit line is consistent with zero.
3.2 Ellipticity as Function of Mass
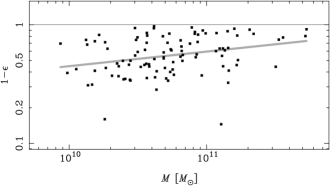
Whereas use of in the virial relation results in agreement between data and expectation (Section 3.1.2), use of finds an empirical relation that is significantly flatter than theoretically expected (Section 3.1.1). As , the difference between the two empirical relations implies that the ellipticity is a function of galaxy mass. Figure 3 illustrates the scaling of the “roundness” with for the ATLAS3D sample. For a quantitative test, I fit the relation
| (5) |
to the data; and are free parameters. The fit returns a slope of ; galaxies of higher mass tend to be less elliptical in average than the ones of lower mass.
4 Discussion
The very existence of a tight mass plane relation is somewhat puzzling. Light distributions, mass-to-light ratios, and thus the masses of EGS are derived from carefully modeling each system individually. It is not obvious that should correlate as tightly with the coarse proxies for mass, and either or (combined in the virial term), as it does, with zero intrinsic scatter (see also the corresponding discussion in Cappellari et al. 2013). The global dynamics of ETGs is simpler than one might expect given that they show a wide range of geometries and mass profiles. Likewise, it is noteworthy that a generalized virial relation (Sections 3.1.1 and 3.1.2) with slope or describes the dynamics of EGS completely: as there is zero intrinsic scatter about the best-fit lines, adding another free parameter by letting scale independently with and either or would not provide additional information (Occam’s razor). This is illustrated in Section 4.3 of Cappellari et al. (2013): their mass plane analysis, using their full sample of galaxies minus a few outliers, returns which is identical to – as expected for a fit with too many free parameters.
The analysis in Section 3.1.1 unambiguously shows that, when using as scale radius, the virial relation is tilted, with being significantly smaller than unity. This is consistent with the original mass plane analysis by Cappellari et al. (2013) who found that their values for and were smaller than the expected values by 2.8 and 2.0, respectively. Indeed, when combining the corresponding false alarm probabilities, the analysis by Cappellari et al. (2013) finds a tilt with a significance of – but doing this is permissible only when assuming a priori that and are correlated (which is at odds with a mass plane analysis). My result also qualitatively agrees with the trend observed by Hyde & Bernardi (2009); however, I find a value for which is significantly larger than the one found from the SDSS sample. Given that I find the same result from two independently drawn and modeled samples of ETGs, I suspect that Hyde & Bernardi (2009) underestimated their systematic uncertainties. This can be compared to the results by Scott et al. (2015) who found for their sample, which likewise was smaller than unity, however not yet statistically significant. Scott et al. (2015) suspected the result to be a feature of JAM modeling. Given however that Saglia et al. (2016) use several different types of dynamical modeling to derive EGS masses (cf. their Section 2.2), it seems unlikely that the tilt in the virial relation can be a modeling artifact.
As shown in Section 3.1.2, empirical and theoretical virial relation agree (within errors) when adopting the semi-major axis of the half-light ellipse, , as galactic scale radius. Indeed, an improved agreement in this case was already noted in the original mass plane analysis by Cappellari et al. (2013) (cf. also Section 4.2.1 of Cappellari 2016), although in their analysis the difference between the two formulations (with and , respectively) was not yet statistically significant when assuming independence of and from each other. The difference between using and using in the virial relation arises from a scaling of ellipticity with galaxy mass: the higher , the higher the roundness (Section 3.2). As noted by van der Wel et al. (2009) and Weijmans et al. (2014), this trend is due to a lack of highly elliptical () galaxies at masses (see also Figure 3); van der Wel et al. (2009) interpreted this observation as evidence for major merging being the dominant mechanism for forming massive galaxies. With and thus , the empirical roundness–mass relation is sufficient to explain the difference between and unity (within errors). It seems that my analysis is the first to explicitly note the impact of the roundness–mass relation on the virial and mass plane relations of early-type galaxies.
Accepting Equation (3) as the correct virial relation means accepting that is a proper proxy for the scale radius of early-type galaxies (whereas is not). This was already suggested by Hopkins et al. (2010) and later supported by Cappellari et al. (2013). Hopkins et al. (2010) argued that is affected by projection whereas is not: the same axisymmetric and oblate galaxy viewed under different angles will show different but always the same . (This is actually the reason why Cappellari et al. (2013) argued in favor of using ; they did not yet note the effect of ellipticity scaling with ETG mass.) Combining this argument with the fact that Equation (3) fits the available data with no intrinsic scatter implies that early-type galaxies are intrinsically axisymmetric and oblate in general – if they were triaxial or prolate, would not usually coincide with the longest axis in projection and would not be a measure of galaxy size. For the ATLAS3D sample, uncertainties on either or are given as 10%, limiting deviations from axisymmetry – more specifically, the deviation of the ratio of the two longest axes of a triaxial ellipsoid from unity – to about the same amount. This is in good agreement with the results from modeling the intrinsic shapes of early-type galaxies based on their kinematics and light distributions (with the possible exception of a small sub-population of slowly rotating ETGs; Weijmans et al. 2014).
5 Conclusions
Using public data for the early-type galaxy samples of Cappellari et al. (2011, 2013) and Saglia et al. (2016), I probe the validity and accuracy of the virial relation given by Equation (1). The key results are:
-
1.
Assuming a linear relationship between galaxy mass and virial term, I find ensemble-averaged virial factors of and for the ATLAS3D and Saglia et al. (2016) samples, respectively, in agreement with Cappellari et al. (2013) (for ATLAS3D). The difference between the two samples arguably arises from the Saglia et al. (2016) velocity dispersions being systematically higher than the ATLAS3D ones by 13% due to different conventions.
-
2.
For both galaxy samples, the empirical virial relation is significantly (by more than ) tilted, such that . For the ATLAS3D data, this is consistent with the mass plane analysis provided Cappellari et al. (2013).
- 3.
-
4.
All best-fit virial relations show intrinsic scatter consistent with zero. This implies that the mass plane of ETGs is fully determined by the virial relation, i.e., that masses do not scale independently with and either or but only with (or ).
-
5.
The “roundness” , with ellipticity , mildly scales with galaxy mass such that . This agrees with the known lack of highly elliptical galaxies for . As , the scaling of mass and roundness explains the tilt in the virial relation that occurs when using instead of as galaxy scale radius.
-
6.
Given that (i) turns out to be the correct proxy for the galactic scale radius and (ii) the best-fit virial relation (Equation 4) fits the data with zero intrinsic scatter, one finds that early-type galaxies are axisymmetric and oblate in general. This agrees with results from modeling their intrinsic shapes based on kinematics and light distributions.
Acknowledgements.
I am grateful to Kyu-Hyun Chae (Sejong U) for valuable discussion. This work is based on the ATLAS3D database of Cappellari et al. (2011, 2013) and the database of Saglia et al. (2016). I make use of the data analysis software package dpuser developed and maintained by Thomas Ott at MPE Garching (www.mpe.mpg.de/~ott/dpuser/index.html). I acknowledge financial support from the National Research Foundation of Korea (NRF) via Basic Research Grant NRF-2015-R1D1A1A-01056807. Last but not least, thanks go to an anonymous referee for helpful comments.References
- Binney & Tremaine (2008) Binney, J. & Tremaine, S. 2008, Galactic Dynamics, 2nd edn. (Princeton, NJ: Princeton University Press)
- Bolton et al. (2007) Bolton, A. S., Burles, S., Treu, T., et al. 2007, A More Fundamental Plane, ApJ, 665, L105
- Cappellari et al. (2006) Cappellari, M., Bacon, R., Bureau, M., et al. 2006, The SAURON Project – IV. The Mass-to-Light Ratio, the Virial Mass Estimator and the Fundamental Plane of Elliptical and Lenticular Galaxies, MNRAS, 366, 1126
- Cappellari et al. (2011) Cappellari, M., Emsellem, E., Krajnović, D., et al. 2011, The ATLAS3D Project – I. A Volume-Limited Sample of 260 Nearby Early-Type Galaxies: Science Goals and Selection Criteria, MNRAS, 413, 813
- Cappellari et al. (2013) Cappellari, M., Scott, N., Alatalo, K., et al. 2013, The ATLAS3D Project – XV. Benchmark for Early-Type Galaxies Scaling Relations from 260 Dynamical Models: Mass-to-Light Ratio, Dark Matter, Fundamental Plane and Mass Plane, MNRAS, 432, 1709
- Cappellari (2016) Cappellari, M. 2016, Structure and Kinematics of Early-Type Galaxies from Integral Field Spectroscopy, ARAA, 54, 597
- Cardone et al. (2011) Cardone, V. F., Angus, G., Diaferio, A., et al. 2011, The Modified Newtonian Dynamics Fundamental Plane, MNRAS, 412, 2617
- Djorgovski & Davis (1987) Djorgovski, S. & Davis, M. 1987, Fundamental Properties of Elliptical Galaxies, ApJ, 313, 59
- Dressler et al. (1987) Dressler, A., Lynden-Bell, D., Burstein, D., et al. 1987, Spectroscopy and Photometry of Elliptical Galaxies. I. A New Distance Estimator, ApJ, 313, 42
- Faber & Jackson (1976) Faber, S. M. & Jackson, R. E. 1976, Velocity Dispersions and Mass-to-Light Ratios for Elliptical Galaxies, ApJ, 204, 668
- Hernquist (1990) Hernquist, L. 1990, An Analytical Model for Spherical Galaxies and Bulges, ApJ, 356, 359
- Hopkins et al. (2010) Hopkins, P. F., Bundy, K., Hernquist, L., et al. 2010, Discrimination between the Physical Processes that Drive Spheroid Size Evolution, MNRAS, 401, 1099
- Hyde & Bernardi (2009) Hyde, J. B. & Bernardi, M. 2009, The Luminosity and Stellar Mass Fundamental Plane of Elliptical Galaxies, MNRAS, 396, 1171
- Kormendy & Bender (2012) Kormendy, J. & Bender, R. 2012, A Revised Parallel-Sequence Morphological Classification of Galaxies: Structure and Formation of S0 and Spheroidal Galaxies, ApJS, 198, 2
- Saglia et al. (2016) Saglia, R. P., Opitsch, M., Erwin, P., et al. 2016, The SINFONI Black Hole Survey: The Black Hole Fundamental Plane Revisited and the Paths of (Co)Evolution of Supermassive Black Holes and Bulges, ApJ, 818, 47
- Sanders (2010) Sanders, R. H. 2010, The Universal Faber–Jackson Relation, MNRAS, 407, 1128
- Scott et al. (2015) Scott, N., Fogarty, L. M. R., Owers, M. S., et al. 2015, The SAMI Pilot Survey: The Fundamental Planes and Mass Planes in Three Low-Redshift Clusters, MNRAS, 451, 2723
- van der Wel et al. (2009) van der Wel, A., Rix, H.-W., Holden, B. P., et al. 2009, Major Merging: The Way to Make a Massive, Passive Galaxy, ApJ, 706, L120
- Weijmans et al. (2014) Weijmans, A.-M., de Zeeuw, P. T., Emsellem, E., et al. 2014, The ATLAS3D Project – XXIV. The Intrinsic Shape Distribution of Early-Type Galaxies, MNRAS, 444, 3340
- Wolf et al. (2010) Wolf, J., Martinez, G. D., Bullock, J. S., et al. 2010, Accurate Masses for Dispersion-Supported Galaxies, MNRAS, 406, 1220