Breaking news from the HST: The central star of the Stingray Nebula is now returning towards the AGB
Abstract
SAO 244567 is a rare example of a star that allows us to witness stellar evolution in real time. Between 1971 and 1990 it changed from a B-type star into the hot central star of the Stingray Nebula. This observed rapid heating has been a mystery for decades, since it is in strong contradiction with the low mass of the star and canonical post-asymptotic giant branch (AGB) evolution. We speculated that SAO 244567 might have suffered from a late thermal pulse (LTP) and obtained new observations with HST/COS to follow the evolution of the surface properties of SAO 244567 and to verify the LTP hypothesis. Our non-LTE spectral analysis reveals that the star cooled significantly since 2002 and that its envelope is now expanding. Therefore, we conclude that SAO 244567 is currently on its way back towards the AGB, which strongly supports the LTP hypothesis. A comparison with state-of-the-art LTP evolutionary calculations shows that these models cannot fully reproduce the evolution of all surface parameters simultaneously, pointing out possible shortcomings of stellar evolution models. Thereby, SAO 244567 keeps on challenging stellar evolution theory and we highly encourage further investigations.
keywords:
stars: AGB and post-AGB – stars: atmospheres – stars: evolution1 Introduction
Revealing the evolution of stars is a complex task, since their evolutionary history can usually only be
reconstructed indirectly due to the long evolutionary times scales.
In a few cases, however, the evolution of the surface properties of a star occurs on a time-scale shorter
than a human lifetime. Such events allow us to witness stellar evolution in real time and provide a unique
way to gain a direct knowledge of stellar evolution.
SAO 244567, the ionization source of the Stingray Nebula (PN G331.312.1), is one such
rare example of an unusually fast evolving star. Rapid changes of its observable properties were at first noticed by
Parthasarathy et al. (1993); Parthasarathy
et al. (1995). Based on the optical spectrum of SAO 244567 obtained in 1971 and its UBV coulors, they
concluded that SAO 244567 was a B-type star with an effective temperature of kK at that time.
However, the optical spectra from 1990 and 1992 as well as IUE spectra from 1992 on display many nebular emission
lines, which let them conclude that SAO 244567 has ionized its surrounding nebula within only two decades.
In Reindl
et al. (2014, Paper I), we presented first quantitative spectral analyses
of all available spectra taken from 1988 to 2006 with various space-based telescopes. We found that the central
star had steadily increased its from 38 kK in 1988 to a peak value of 60 kK in 2002. During the same time,
the star was contracting, as concluded from an increase in surface gravity from (g / cm s-2) = 4.8 to
6.0 and a drop in luminosity. Simultaneously, the mass-loss rate declined from
( / yr-1) = to and the terminal wind velocity increased from
= to km s-1.
The existence of the planetary nebula (PN) suggests that SAO 244567 is likely a post-AGB star because – in general – only
such a star is expected to eject a PN. On the other hand, its low mass is in strong contradiction with canonical
post-AGB evolution (Parthasarathy
et al. 1995; Bobrowsky et al. 1998). A comparison of the position of SAO 244567 in the log – plane with latest post-AGB stellar evolutionary calculations (Miller
Bertolami 2016) indicates a mass below
, while the rapid heating rate (d / d) would require a central star mass of
.
Under certain circumstances, however, the classical picture of the evolution of post-AGB stars is altered by the
occurrence of a late He-shell flash. These can occur either during the blue-ward excursion of the post-AGB star
(late thermal pulse, LTP), or during its early white dwarf cooling phase (very late thermal pulse, VLTP). The
release of nuclear energy by the flashing He-shell forces the already very compact star to expand back to giant
dimensions – the so-called born-again scenario. This scenario was first explored in detail by
Schönberner (1979) and by Iben et al. (1983) and is of great importance for the explanation of H-deficient post-AGB
stars, which make up about a quarter of the post-AGB stars. The evolutionary time-scales of stars, which are
considered to have undergone such a late He-shell flash, are very short (decades) and thus, the detection and the
repeated observation of such quickly evolving objects make it possible to record the temporal evolution of their
stellar parameters and to establish constraints for stellar evolution theory. Well known examples for
“born-again” stars are V605 Aql (e.g., Clayton et al. 2006), V4334 Sgr (Sakurai’s object, e.g.
Hajduk
et al. 2005) and FG Sge (e.g., Jeffery &
Schönberner 2006). V605 Aql and V4334 Sgr are
considered to have undergone a VLTP, which produces an H-free stellar surface already during the flash. FG Sge, on the
other hand, had a slower cooling rate and turned H-deficient only when it had returned back to the AGB. Therefore FG Sge
must instead have experienced an LTP (see Schönberner 2008 for a review about these objects).
In Paper I, we speculated that SAO 244567 might also have experienced a late He-shell flash shortly after leaving the AGB.
This scenario predicts that SAO 244567 would eventually become a cool supergiant, i.e., that the star
will become cooler and expand. To follow the evolution of the surface properties of SAO 244567 and to verify the LTP hypothesis,
we performed further observations with the Cosmic Origins Spectrograph (COS) on the Hubble Space Telescope (HST).
2 Observations
We obtained HST/COS spectra using the PSA aperture (total exposure time 13.4 ks, proposal ID 13708). The observations were performed on the 2015 August 9, more than nine years after the star was previously observed with an ultraviolet (UV) telescope. Far-UV medium and low resolution spectra were obtained using gratings G130M and G140L at central wavelength settings 1222 Å and 1280 Å, respectively. In addition, we acquired near-UV low resolution spectra with the G230L grating at central wavelength settings 2635 Å and 3360 Å. The latter are unfortunately blurred by the strong C II Å (nebular) and O II Å (nebular and geocoronal) emission lines and, hence, provide neither reliable fluxes nor line profiles. This is due to the very compact PN (″) and the much larger aperture used for COS () observations compared to the apertures used for the former STIS (″ ) and FOS () observations. Comparing the new HST/COS observation to the FUSE observations in 2002 and 2006, we found that the flux decreased slightly by a factor of 1.6 and 1.4, respectively.
3 Spectral analysis
The spectral analysis was carried out analogously to Paper I by modelling both the photospheric and the interstellar line-absorption spectrum. Again, we employ the OWENS program to model the ISM line absorption. The interstellar reddening was derived as outlined in Paper I. Using the LMC reddening law of Howarth (1983), we found E(B-V) = . For the quantitative spectral analysis we used the Tübingen non-LTE Model-Atmosphere Package (TMAP, Werner et al. 2003; Werner et al. 2012; Rauch & Deetjen 2003), which allows the computation of fully metal-line blanketed model atmospheres in radiative and hydrostatic equilibrium (Sect. 3.1). In order to constrain the presence of a possible weak stellar wind we employed PoWR (Potsdam Wolf-Rayet model-atmosphere code, Gräfener et al. 2002; Hamann & Gräfener 2003, 2004, Sect. 3.2).

3.1 TMAP model atmosphere analysis
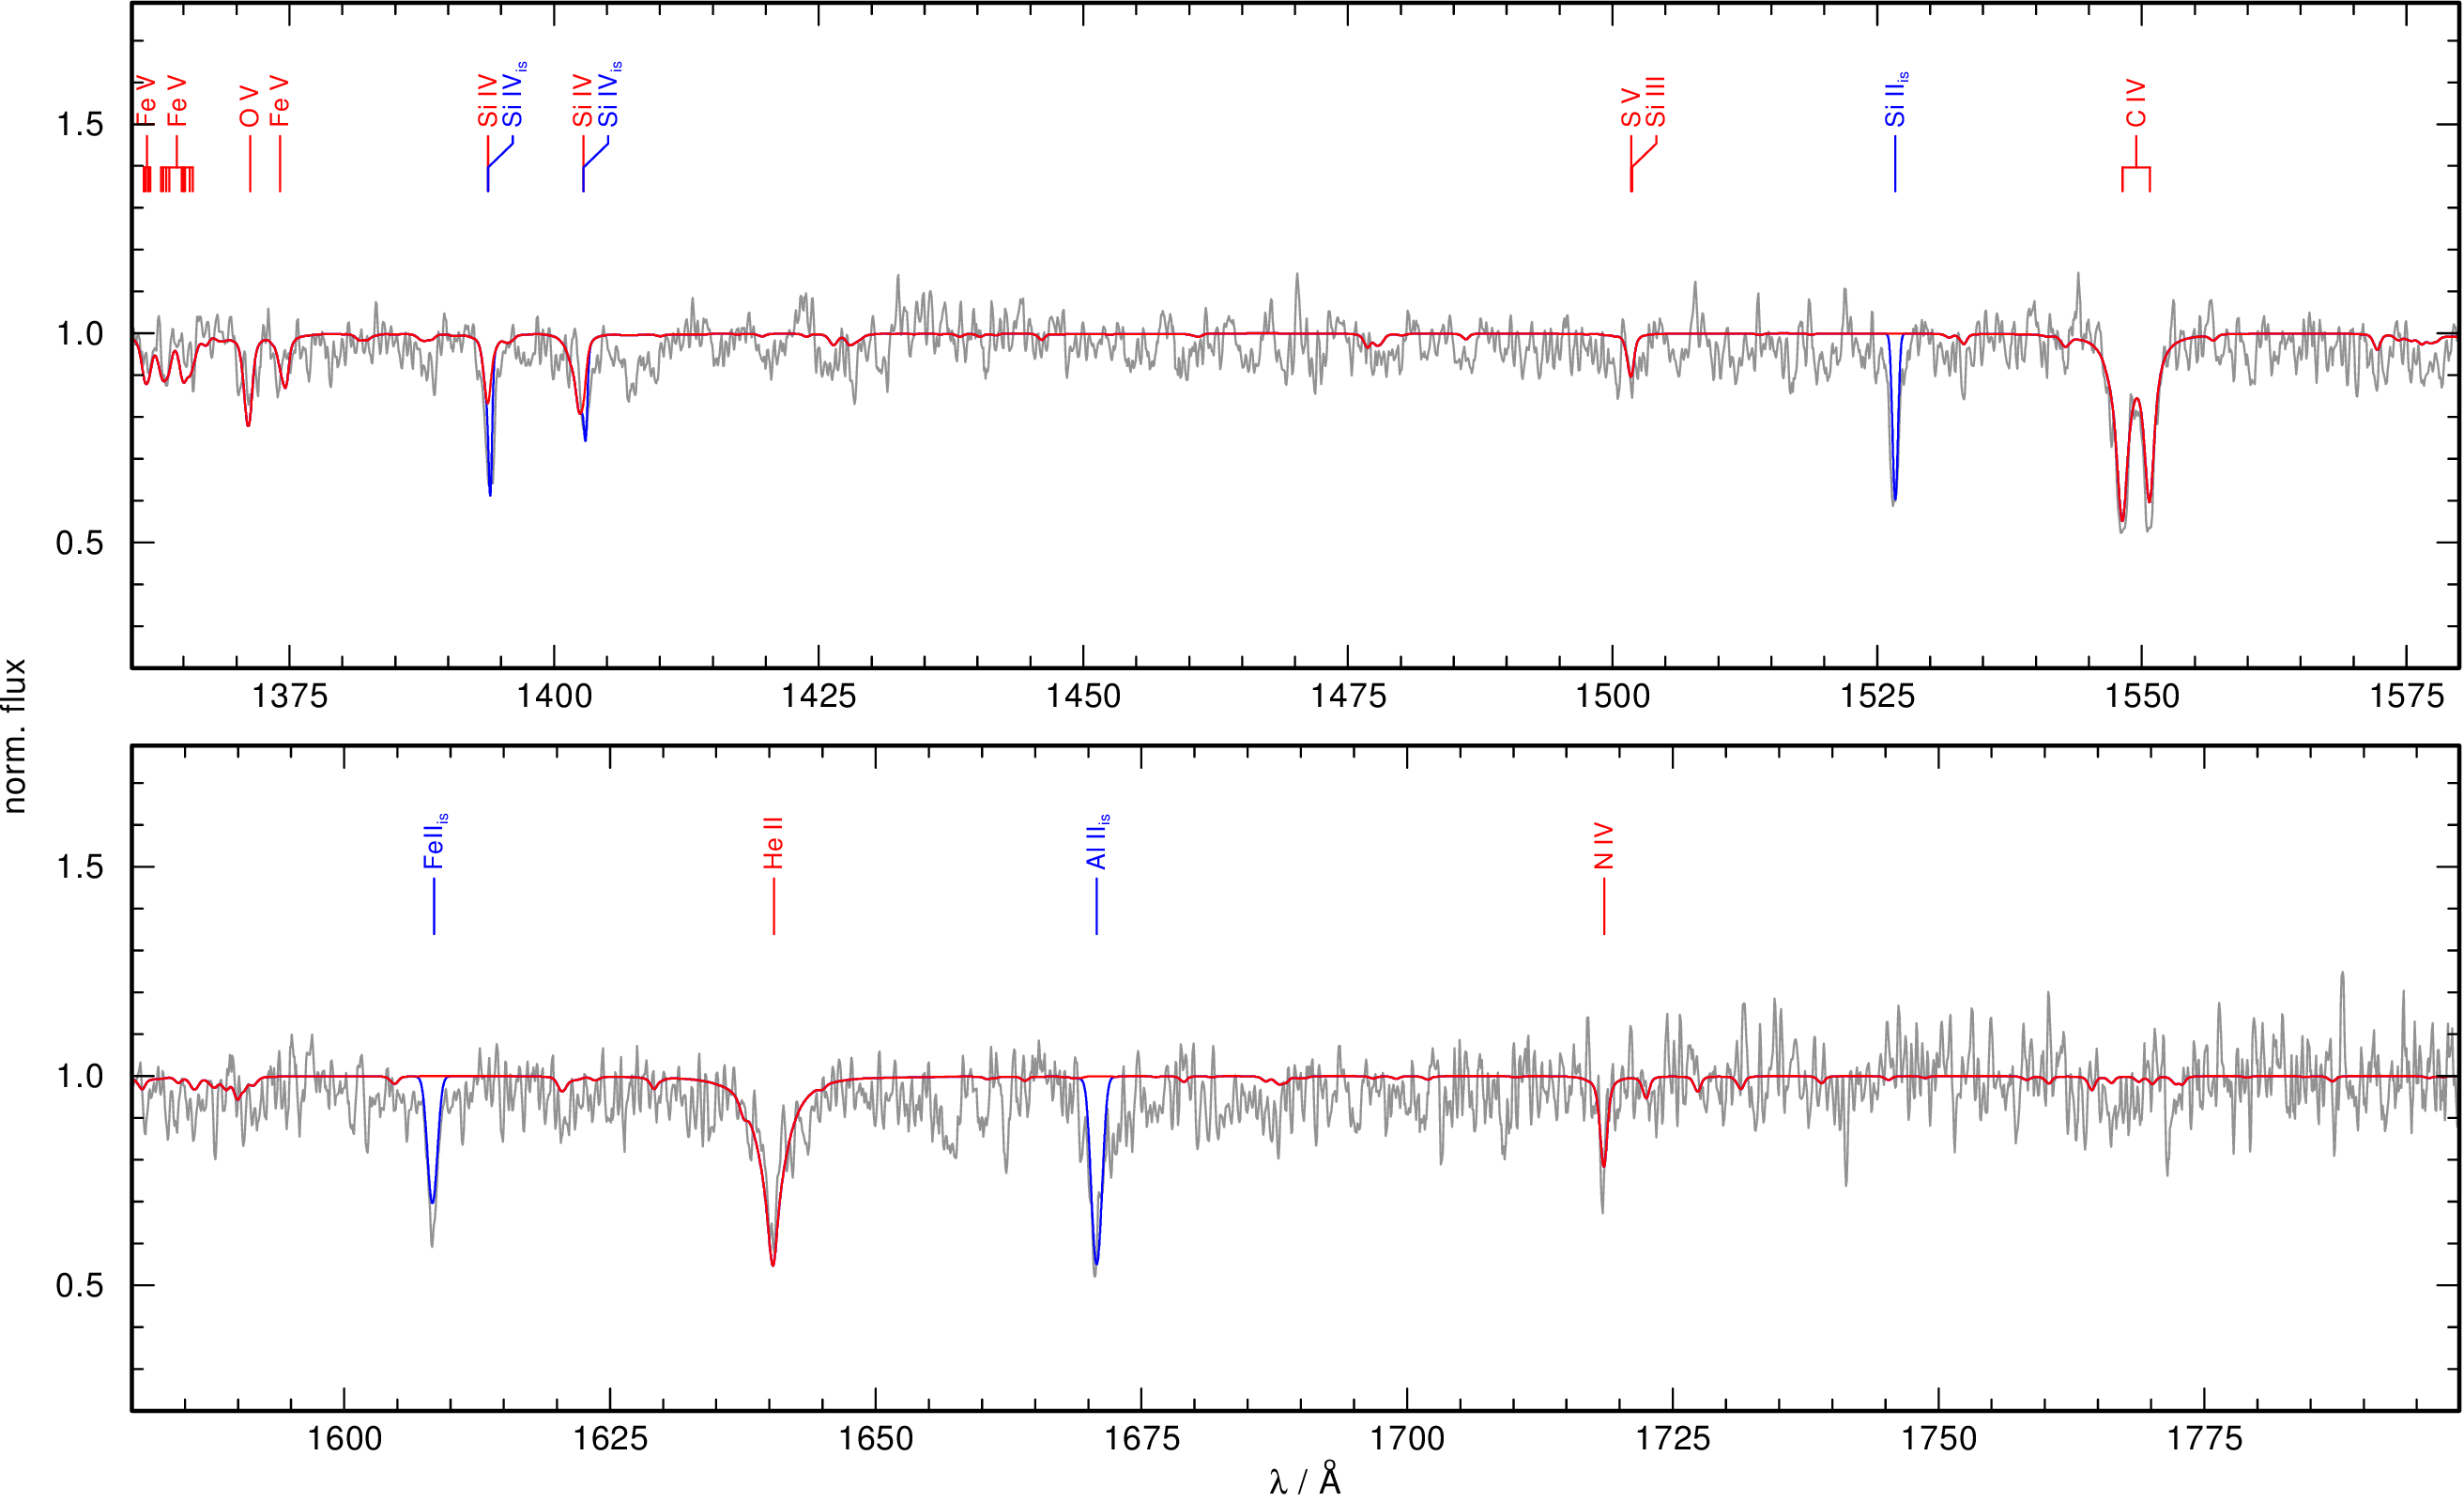
As a first step we compared the new observations with the best-fitting model atmosphere for 2006 (year of the last UV observations, see Paper I),
which included the elements H, He, C, N, O, Si, P, S, Fe, and Ni to
identify several interstellar and photospheric spectral lines. Thanks to the better S/N of the COS G130M spectrum and
the extent towards larger wavelengths we were able to identify numerous lines of Fe, and for the first time also Ni.
By comparison with the grid calculated in Paper I, we found = (mass fraction,
which is solar according to Scott et al. 2015b). Surprisingly, we discovered the emergence of the
Si III Å line in the new HST/COS spectra (Fig. 1). This line was not visible in the previous
FUSE observations, which cover this wavelength range as well and have about the same resolving power
().
Some lines, however remained unidentified. In order to investigate the origin of those lines we proceeded as follows.
To check for the presence of lines from iron-group elements, besides Fe and Ni, we calculated TMAP models including H and He,
plus Ca, Sc, Ti, V, Cr, or Mn (at abundances solar, according to Scott
et al. 2015a; Scott et al. 2015b),
respectively. These were then compared to the G130M observation in order to derive the abundances or at least upper limits.
The model atoms were calculated via the Tübingen iron-group opacity interface TIRO (Müller-Ringat 2013).
No lines of Sc are predicted in the G130M wavelength range and the strongest line of calcium (Ca IV Å) is blended
by interstellar lines of H 23 and Fe II. Therefore no upper limits are given for these elements.
The strongest predicted lines of titanium, namely Ti IV Å and Ti V Å are not
visible in the observations. We derive an upper limit of ( solar). Also the
strongest predicted lines of vanadium (V V Å), as well as manganese (Mn VI Å and
Mn V Å) are not detected. We derive upper limits of
(solar) and (solar), respectively. For the first time we discovered
Cr V Å and derived Cr = (solar).
As a next step, we increased the numbers of non-LTE levels for O, Si, P, and S for our model atmosphere calculations. We then
calculated a model grid spanning = kK (step size K) and including the elements H, He, C, N, O,
Si, P, S, Cr, Fe, and Ni (at abundances as derived above and in Paper I).
Because the near-UV COS spectrum, which we originally obtained to derive via the He II lines
( = ), is not suited for the spectral analysis (see Sect. 2),
we assumed initially = , i.e., that the surface gravity has not changed significantly. Note that the surface gravity
is further investigated below, but the next step only focused on the determination by comparing our grid to
the new observations.
We found that Si III Å was not visible in the FUSE observation in 2002, because the star was about kK
hotter in 2002 compared to 2015 where we find the best fit at = kK. The strengths of Si IV Å
do not show a strong dependence on in the temperature region studied, thus, the Si abundance derived in Paper I is
reliable. This value is also confirmed by evaluating additionally the ionization equilibria of
C III / C IV,
N III / N IV,
O III / O IV / O V,
S IV / S V / S VI,
Fe V / Fe VI, and
Ni IV / Ni V.
The good S/N allows the error on to be reduced to kK. For kK the lines of N III, O III,
Si III, and S IV are too strong in the models, whereat S VI Å becomes too weak. In contrast, for
kK the lines of C III, N III, O III, Si III, and S IV are too weak, while the lines
of N IV, S VI, and Fe VI are too strong in our models. The line profiles of
C IV, Si IV, S V, Ni IV and Ni V show only mild changes in the range = kK. The same
holds for O IV Å while the line strength of O IV Å increases significantly for
kK. The latter two lines were not included in the model of Paper I, and therefore not identified. However,
these lines are clearly detected in the FUSE observations from 2002 and 2006.
Finally, we investigated a possible impact of on the derived by calculating a second model grid with
= 5.5. We found that the metal lines hardly differ from the = 6.0 model and that the ionization
equilibria are also reproduced best at = kK. Furthermore, we find that He II Å (Fig. 6)
is best reproduced at = . For larger/lower values of , the line wings of our models become too broad/narrow
compared to the observations.
3.2 PoWR model atmosphere analysis
Conclusions about the properties of the stellar wind can be drawn by studying prominent wind lines located in the far-UV.
The S/N of the G140L spectrum is poor for Å and cannot be improved sufficiently by data binning, which
prevented investigations of the O VI resonance doublet. The C IV resonance doublet, also recorded with the G140L grating, does
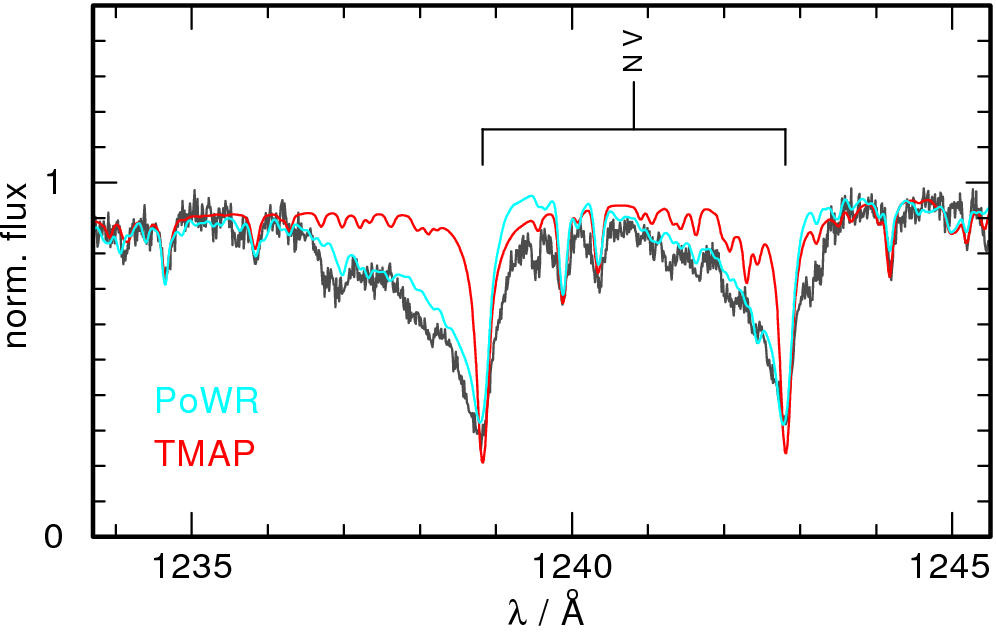
not show any signature of a stellar wind (Fig. 6). N V Å, however, show asymmetrical line profiles,
i.e., they show blue-shifted absorption wings while an emission, which would clearly point to a P-Cygni profile, cannot be detected
(Fig. 2). To investigate the origin of the asymmetry, we calculated non-LTE models for expanding model atmospheres
with PoWR. We assumed = , ( / ) = , = kK and elemental
abundances as found in the TMAP analysis.
In the absence of diagnostic lines, e.g., recombination emission lines vs. electron scattering line wings, we assume a smooth
wind for the calculation of the population numbers. In the formal integral we introduce optically thick inhomogeneities (see Oskinova et al. (2007))
to achieve a better fit of the N V resonance doublet line cores, which otherwise appear too strong in the PoWR model.
As the line opacity in the wind is already very low, the absorption wings of the P-Cygni profiles are less affected by the porosity effect.
We determine an upper limit for the mass loss rate of = yr-1. Below this value the emission peaks of the
N V lines vanish (Fig. 2). The terminal wind velocity was measured from the blue edge of the
absorption component of N V Å. We found = km s-1, which is significantly less than what was
found for the previous years ( = km s-1 in the year 2006). This drastic change implies that also the
surface gravity must have decreased by half an order of magnitude presuming .
Therefore a change from = 6.0 in 2006 to = 5.5 in 2015 is perfectly supported.
Note that the PoWR model (with = yr-1, = km s-1) does not predict P-Cygni profiles for
other prominent wind lines (e.g., the O VI and C IV resonance doublets). This is in line with previous IUE observations in
from 1994 to 1996 in which also only the resonance doublet of N V exhibited P-Cygni profiles and SAO 244567 had = kK
as well.
4 Results and discussion
The new HST/COS spectra allows us to identify lines of Cr and Ni and to measure their abundances for the first time. We
confirm the abundance values of all the other elements derived in Paper I, i.e., no hint of a change in the chemical
abundances is found. Figure 3 shows the elemental abundances of SAO 244567 as derived in this work and Paper I.
The largely solar surface composition is in line with the thin disk nature of SAO 244567 as concluded from its space velocities.
These were calculated using = km/s (measured from the G130M spectrum), proper motions
and statistical parallax from Fresneau
et al. (2007). We found () = () km/s, which is
typical for thin disk stars (Kordopatis
et al. 2011). We note, that the height of SAO 244567 above the Galactic plane
( = pc assuming = pc from Fresneau
et al. 2007) also lies within the scale height of the thin
disk.
The solar abundances of He and N excluded the occurrence of the second dredge-up and hot bottom burning. This agrees with
the fact that SAO 244567 must be a low mass star since the second dredge-up and hot bottom burning occurs only in stars
with initial mass (García-Hernández et al. 2013). In addition the sub-solar C abundance indicates that SAO 244567 has
not experienced a third dredge-up (Paper I), which implies that in case SAO 244567 was once a AGB star, it must have had a low
initial mass (, Cristallo et al. 2015; Girardi &
Marigo 2007).
Two well studied low-mass post-AGB stars that also avoided the third dredge-up are vZ 1128
(Chayer et al. 2015) and ROB 162 (Chayer et al. in
prep111http://www-astro.physics.ox.ac.uk/~aelg/SDOB7/proceedings/Chayer_rob162_proceedings.pdf.),
whose abundances are shown in Fig. 3, too. They display very similar abundance patterns to SAO 244567, although the
metal abundances are systematically lower by about one order of magnitude. This can, however, be simply understood in terms
of the lower initial metallicities of vZ 1128 and ROB 162, since they are found in globular clusters
(NGC 5272 and NGC 6397, respectively). Chayer et al. (2015, in prep.) demonstrated that their abundances
coincide with the abundances of red giant branch (RGB) and horizontal branch (HB) stars in these clusters, i.e., that
the abundances of these stars have not changed since the RGB.
The positions of vZ 1128 and ROB 162 in the – plane agree with a
post-AGB evolutionary track of Miller
Bertolami (2016, see Fig. 5 in
Reindl
et al. 2016), while SAO 244567 seems to have an even lower mass (Fig 4). In Paper I, we
discussed the possibilities of SAO 244567 being a post-RGB or post-extreme HB star and we will reconsider these later
on. From the star’s surface abundances, kinematics, height above the Galactic plane and the position in the
– plane, we can, for now, maintain that SAO 244567 is a low-mass, population I
star.

The most striking result that we obtained from the new HST observations is the fact that SAO 244567 cooled significantly since 2002.
While in 2002 the star had = kK, we find that in 2015 the ionization equilibria of several species are best
reproduced at = kK. Moreover, we found evidence, that SAO 244567 must have been expanding since 2006. This is
concluded from the decrease of the terminal wind velocity by about factor of five since 2006 ( = km s-1
in 2015, = km s-1 in 2006). This is in line with a decrease of the surface gravity from
= to = . Finally, we found that the mass loss rate of SAO 244567 has further declined
( yr-1, compared to = yr-1 in 2006).
From the initial rapid heating and contraction of SAO 244567 (heating rate from 1988 to 2002: K/yr), which is now
followed by a rapid cooling and expansion of the star, we conclude that SAO 244567 has indeed suffered a late He-shell flash and is now on its way
back towards the AGB. The cooling rate of SAO 244567 ( K/yr) is similar to that of FG Sge ( K/yr, Jeffery &
Schönberner 2006), the
only other hitherto known LTP object. FG Sge was, however, observed only during the final cooling phase, whereas SAO 244567 is now the only known
LTP object that was observed during its blue- as well as red-wards evolution.
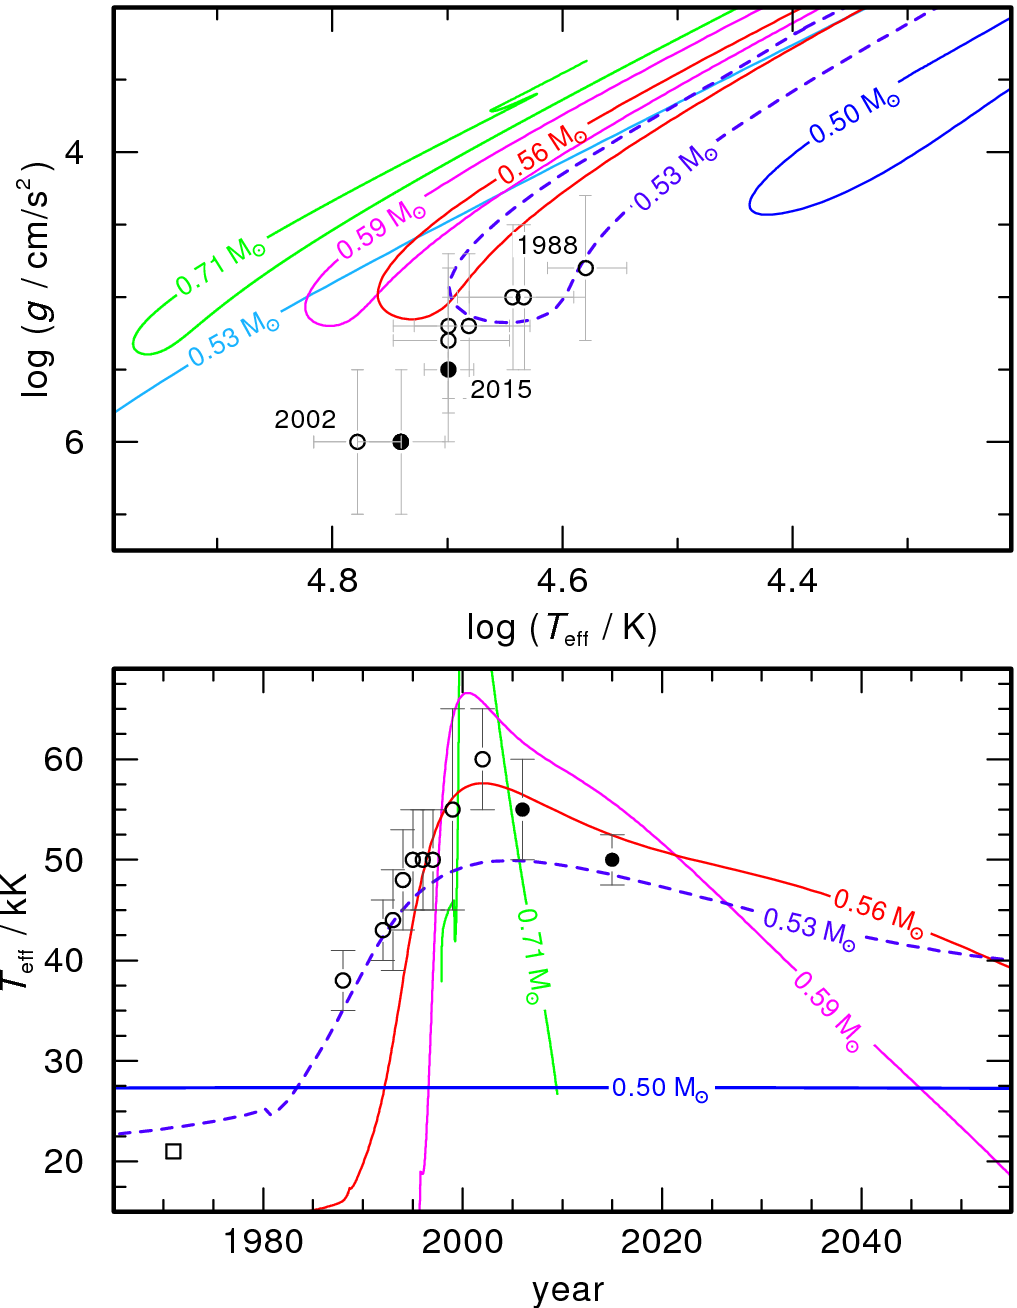
In the upper panel of Fig. 4 we compare the evolution of SAO 244567 in the – plane with five LTP
evolutionary tracks that were calculated from the sequences presented in Miller
Bertolami (2016) by deliberately removing mass at
the end of the AGB to obtain LTPs.
While the 0.50 track reproduces the low luminosities ( ) of the star, the model predicts a too low
maximum (only about 28 kK, hardly enough to ionize the PN). In addition, the evolutionary speed (lower panel of Fig. 4)
is too low. Slightly more massive models do reach kK, however, at too low surface gravities. The 0.71 track matches the
observed gravities, but heats up to kK and evolves too quickly. The heating until 1999 is well reflected by
the 0.53 model, while the 0.56 model nicely reproduces the evolutionary speed from 1996 until 2015.
Fine-tuning of the LTP model parameters may, however, lead to a better agreement of the observations with theoretical
predictions.
Let us now critically examine this LTP scenario in view of other possible evolutionary paths. He-shell flashes may also occur in
post-EHB stars (Dorman
et al. 1993) or after the merger of two low-mass stars (Zhang &
Jeffery 2012). The post-EHB scenario was
already ruled out in Paper I, since it is not possible to explain the young PN. In case of a merger event, He-shell
flashes occur on too long time-scales ( yrs, Zhang &
Jeffery 2012) and also the largely solar composition does
not support a merger scenario.
Finally, let us consider SAO 244567 as a post-RGB star which ended a common-envelope phase (during which the PN was ejected)
in thermal non-equilibrium. First, we could not find any hint of relative motion of interstellar and photospheric lines by
comparing the HST/COS observations with the FUSE observations in 2002 and 2006. Therefore, there is no proof for a close companion,
which would be required for such a scenario. Second, and more importantly, in such a scenario the star would directly, although
rapidly, evolve to become a white dwarf (Deinzer &
von Sengbusch 1970; Hall
et al. 2013). Therefore SAO 244567 would be expected to contract
further, and not, as shown in this work, expand again. The only way to explain the expansion nevertheless would be, if the star had
undergone a H-shell flash after entering the white dwarf cooling sequence. Such H-shell flashes occur, however, only when the star
had reached and additionally the cooling rate would be orders of magnitude lower
(Istrate et al. 2016, 2014; Althaus et al. 2001, 2013) than what is observed for SAO 244567.
5 Conclusions
In this work we have shown, that after the initial rapid heating and contraction (Paper I), SAO 244567 has cooled significantly since 2002 and is now expanding. This can only be explained with a LTP scenario, and indicates that the star is now on its way back to the AGB. We stress that SAO 244567 is the only LTP object, that was observed during its blue- and red-wards motion through the Hertzsprung-Russell diagram. The evolutionary speed suggests a central star mass between 0.53 and 0.56 . However, none of the current LTP models can fully reproduce the evolution of all surface parameters simultaneously. In particular the problem with the apparently high gravity of the star should be pursued further. A high S/N near-UV spectrum would therefore be highly desirable in order to derive more precisely. Refined LTP evolutionary calculations, on the other hand, may not only help to explain the nature of SAO 244567, but could also provide a deeper insight into the evolution of central stars of PNe as well as the formation of H-deficient stars.
Acknowledgements
NR is supported by a Leverhulme Trust Research Project Grant. NR was and TR is supported by the German Aerospace Center (DLR, grant 50 OR 1507). M3B is partially supported by ANPCyT through grant PICT-2014-2708 and by a Return Fellowship from the Alexander von Humboldt Foundation. We thank P. Chayer for reporting to us their results before publication and A. Istrate and M. Parthasarathy for helpful discussions and comments. Based on observations made with the NASA/ESA Hubble Space Telescope, obtained 20150809 at the Space Telescope Science Institute, which is operated by the Association of Universities for Research in Astronomy, Inc., under NASA contract NAS 5-26555. These observations are associated with program 13708. The TMAD service (http://astro-uni-tuebingen.de/~TMAD) used to compile atomic data and the TIRO service (http://astro-uni-tuebingen.de/~TIRO) used to calculate opacities for this paper were constructed as part of the activities of the German Astrophysical Virtual Observatory. This research has made use of NASA’s Astrophysics Data System, the VizieR catalogue access tool and the SIMBAD data base operated at CDS, Strasbourg, France.
References
- Althaus et al. (2001) Althaus L. G., Serenelli A. M., Benvenuto O. G., 2001, MNRAS, 324, 617
- Althaus et al. (2013) Althaus L. G., Miller Bertolami M. M., Córsico A. H., 2013, A&A, 557, A19
- Bobrowsky et al. (1998) Bobrowsky M., Sahu K. C., Parthasarathy M., García-Lario P., 1998, Nature, 392, 469
- Chayer et al. (2015) Chayer P., Dixon W. V., Fullerton A. W., Ooghe-Tabanou B., Reid I. N., 2015, MNRAS, 452, 2292
- Clayton et al. (2006) Clayton G. C., Kerber F., Pirzkal N., De Marco O., Crowther P. A., Fedrow J. M., 2006, ApJ, 646, L69
- Cristallo et al. (2015) Cristallo S., Straniero O., Piersanti L., Gobrecht D., 2015, ApJS, 219, 40
- Deinzer & von Sengbusch (1970) Deinzer W., von Sengbusch K., 1970, ApJ, 160, 671
- Dorman et al. (1993) Dorman B., Rood R. T., O’Connell R. W., 1993, ApJ, 419, 596
- Fresneau et al. (2007) Fresneau A., Vaughan A. E., Argyle R. W., 2007, A&A, 469, 1221
- García-Hernández et al. (2013) García-Hernández D. A., Zamora O., Yagüe A., Uttenthaler S., Karakas A. I., Lugaro M., Ventura P., Lambert D. L., 2013, A&A, 555, L3
- Girardi & Marigo (2007) Girardi L., Marigo P., 2007, A&A, 462, 237
- Gräfener et al. (2002) Gräfener G., Koesterke L., Hamann W.-R., 2002, A&A, 387, 244
- Hajduk et al. (2005) Hajduk M., et al., 2005, Science, 308, 231
- Hall et al. (2013) Hall P. D., Tout C. A., Izzard R. G., Keller D., 2013, MNRAS, 435, 2048
- Hamann & Gräfener (2003) Hamann W.-R., Gräfener G., 2003, A&A, 410, 993
- Hamann & Gräfener (2004) Hamann W.-R., Gräfener G., 2004, A&A, 427, 697
- Howarth (1983) Howarth I. D., 1983, MNRAS, 203, 301
- Iben et al. (1983) Iben Jr. I., Kaler J. B., Truran J. W., Renzini A., 1983, ApJ, 264, 605
- Istrate et al. (2014) Istrate A. G., Tauris T. M., Langer N., Antoniadis J., 2014, A&A, 571, L3
- Istrate et al. (2016) Istrate A., Marchant P., Tauris T. M., Langer N., Stancliffe R. J., Grassitelli L., 2016, preprint, (arXiv:1606.04947)
- Jeffery & Schönberner (2006) Jeffery C. S., Schönberner D., 2006, A&A, 459, 885
- Kordopatis et al. (2011) Kordopatis G., et al., 2011, A&A, 535, A107
- Miller Bertolami (2016) Miller Bertolami M. M., 2016, A&A, 588, A25
- Müller-Ringat (2013) Müller-Ringat E., 2013, Dissertation, University of Tübingen, Germany, http://tobias-lib.uni-tuebingen.de/volltexte/2013/6774/
- Oskinova et al. (2007) Oskinova L. M., Hamann W.-R., Feldmeier A., 2007, A&A, 476, 1331
- Parthasarathy et al. (1993) Parthasarathy M., Garcia-Lario P., Pottasch S. R., Manchado A., Clavel J., de Martino D., van de Steene G. C. M., Sahu K. C., 1993, A&A, 267, L19
- Parthasarathy et al. (1995) Parthasarathy M., et al., 1995, A&A, 300, L25
- Rauch & Deetjen (2003) Rauch T., Deetjen J. L., 2003, in Hubeny I., Mihalas D., Werner K., eds, Astronomical Society of the Pacific Conference Series Vol. 288, Stellar Atmosphere Modeling. p. 103 (arXiv:astro-ph/0403239)
- Reindl et al. (2014) Reindl N., Rauch T., Parthasarathy M., Werner K., Kruk J. W., Hamann W.-R., Sander A., Todt H., 2014, A&A, 565, A40
- Reindl et al. (2016) Reindl N., Geier S., Kupfer T., Bloemen S., Schaffenroth V., Heber U., Barlow B. N., Østensen R. H., 2016, A&A, 587, A101
- Schönberner (1979) Schönberner D., 1979, A&A, 79, 108
- Schönberner (2008) Schönberner D., 2008, in Werner A., Rauch T., eds, Astronomical Society of the Pacific Conference Series Vol. 391, Hydrogen-Deficient Stars. p. 139
- Scott et al. (2015a) Scott P., et al., 2015a, A&A, 573, A25
- Scott et al. (2015b) Scott P., Asplund M., Grevesse N., Bergemann M., Sauval A. J., 2015b, A&A, 573, A26
- Werner et al. (2003) Werner K., Deetjen J. L., Dreizler S., Nagel T., Rauch T., Schuh S. L., 2003, in Hubeny I., Mihalas D., Werner K., eds, Astronomical Society of the Pacific Conference Series Vol. 288, Stellar Atmosphere Modeling. p. 31 (arXiv:astro-ph/0209535)
- Werner et al. (2012) Werner K., Dreizler S., Rauch T., 2012, TMAP: Tübingen NLTE Model-Atmosphere Package, Astrophysics Source Code Library (ascl:1212.015)
- Zhang & Jeffery (2012) Zhang X., Jeffery C. S., 2012, MNRAS, 419, 452
Appendix A Images
In the following we compare our best fit TMAP model to the HST/COS observations.