Multi-wavelength Temporal Variability of the Blazar 3C 454.3 during 2014 Activity Phase
Abstract
We present a multi-wavelength temporal analysis of the blazar 3C 454.3 during the high -ray active period from May-December, 2014. Except for X-rays, the period is well sampled at near-infrared (NIR)-optical by the SMARTS facility and the source is detected continuously on daily timescale in the Fermi-LAT -ray band. The source exhibits diverse levels of variability with many flaring/active states in the continuously sampled -ray light curve which are also reflected in the NIR-optical light curves and the sparsely sampled X-ray light curve by the Swift-XRT. Multi-band correlation analysis of this continuous segment during different activity periods shows a change of state from no lags between IR and -ray, optical and -ray, and IR and optical to a state where -ray lags the IR/optical by 3 days. The results are consistent with the previous studies of the same during various -ray flaring and active episodes of the source. This consistency, in turn, suggests an extended localized emission region with almost similar conditions during various -ray activity states. On the other hand, the delay of -ray with respect to IR/optical and a trend similar to IR/optical in X-rays along with strong broadband correlations favor magnetic field related origin with X-ray and -ray being inverse Comptonized of IR/optical photons and external radiation field, respectively.
keywords:
radiation mechanisms: non-thermal – galaxies: active – quasar: individual: 3C 454.3 – galaxies: jets – X-rays: galaxies1 Introduction
Blazars are jetted active galactic nuclei (AGNs) with relativistic jets align at close angles to observer’s line of sight. They are characterized by a highly variable, predominantly non-thermal continuum emission spanning the entire accessible electromagnetic spectrum with a significant polarization at radio-to-optical wavelengths, and superluminal features in high-resolution radio imaging (Lister et al., 2013). In the temporal domain, flux variability is seen on all timescales ranging from minutes to years and is believed to be a manifestation of Doppler boosting associated with the close alignment of the relativistic jet with the line of sight. Traditionally, blazars have been classified as BL Lacertae objects (BL Lacs) and flat spectrum radio quasars (FSRQs) based on the absence and presence of prominent broad emission lines in their optical-ultraviolet spectra (Urry & Padovani, 1995).
Despite a wide range of variability in energy and time domains, blazars spectral energy distributions (SEDs) exhibit a characteristic broad double-hump profile (Fossati et al., 1998; Mao et al., 2016). The low energy hump peaks between infra-red (IR) to ultraviolet(UV)/X-rays, and is widely accepted to be due to synchrotron emission from relativistic non-thermal electrons in the jet. The emission at high energy hump which peaks at -ray energies is still unclear and, is well reproduced by both leptonic and/or hadronic non-thermal processes (e.g. Böttcher et al., 2013; Dermer, 2015). In the leptonic models, the high energy emission originates as a result of inverse Compton (IC) scattering (e.g. Ghisellini et al., 2014) of ambient photons which can be synchrotron photons and/or photons external to the jet, like photons from the broad-line region (BLR), torus photons and/or Cosmic Microwave Background (CMB) photons. The hadronic models, on the other hand, attribute it to the interactions of relativistic protons in the jet with the magnetic field (proton synchrotron, Mücke & Protheroe, 2001) and/or with the soft radiation field (photo-pion cascade, Mannheim & Biermann, 1992).
Understanding the nature of variability in Blazars has eluded the researchers over the years. Generally attributed to relativistic shocks and/or magnetic reconnection processes, it differs from source-to-source, and even during different activity states of a source. Furthermore, its highly energy dependent manifestation across the electromagnetic (EM) spectrum makes it complex to decipher. This makes multi-wavelength spectral and temporal study of blazars emission one of the potential tools to probe and understand the physical conditions/processes responsible for its energy dependent variability within the compact unresolvable sites (e.g. Kushwaha, Singh, & Sahayanathan, 2014). The correlations between different wavelengths carry an imprint of dynamics of interplay between energization and losses and hence, their relative dominance in different energy bands.
3C 454.3, located at the redshift of is a bright and a highly variable FSRQ first detected at -ray energies ( MeV) by the EGRET telescope onboard the CGRO (Hartman et al., 1993). The source has been studied extensively at different wavelengths over the last two decades. However, only after 2005 activity which was seen in all the accessible window of the electromagnetic spectrum (Villata et al., 2006; Giommi et al., 2006; Pian et al., 2006), that it became one of the targets of coordinated multi-wavelength studies.
3C 454.3 has been extremely active FSRQ at -ray energies since 2007 as seen by AGILE (Striani et al., 2010) as well as the scanning -ray observatory Fermi-LAT post its launch in 2008. Many extraordinary -ray activities in terms of spectral and temporal variations (Ackermann et al., 2010; Abdo et al., 2011; Britto et al., 2015) have been reported with counterparts in other parts of the electromagnetic spectrum. The coordinated follow-ups during many of these high -ray activity periods have revealed diversity and complexity of emission processes in the source. The AGILE 2007 multi-wavelength campaign observed a correlated optical and -ray variation with no lags during the November (Vercellone et al., 2009), but found a possible day lag with -ray lagging the optical during the December observations (Donnarumma et al., 2009). A more extensive multi-wavelength campaign led by AGILE over 18 months found almost simultaneous peaks in different energy bands with a delay of less than a day (Vercellone et al., 2010), consistent with its previous finding. Similarly, the multi-wavelength observation during Fermi-LAT operation by Bonning et al. (2009) for the period of August to December 2008 revealed an excellent correlation between the IR, optical, UV, and gamma-ray light curves with a time lag of less than one day but no correlation between X-ray flux with either of these EM bands. A similar result was found for another multi-wavelength data set compiled by Bonning et al. (2012) for the period of June 2008 to December 2010 showing excellent correlations between the IR, optical, and -rays with a time lag of less than a day, while Wehrle et al. (2012) have found near-simultaneous variations in millimeter, far-IR and -rays with -ray lagging IR (160 ) by days for November 2010 - January 2011 period. On the other hand, a study by Gaur et al. (2012) for November- December 2009, has found a lag of days with -ray leading optical, but neither being correlated with X-rays. Thus, the broadband emission during various -ray activity states seems to have recurring features despite widely different variability amplitudes in both flux and time domains. The well sampled simultaneous/contemporaneous data set generated by the coordinated follow-ups across the EM spectrum by the ground and space based observatories in response to the Fermi-LAT triggers have, thus, opened a window for systematic exploration of various characteristics associated with particular sources (e.g. Kushwaha et al., 2016), thereby providing insights and constraints on the rich physics of the relativistic jets, emission region etc.
Here, we present correlation analysis of multi-wavelength data during a -ray active period between May-December, 2014, when the source -ray fluxs over daily timescale were and was followed in other electromagnetic bands. The source exhibited high -ray variability of different levels which were also noticed in X-rays and NIR-optical bands. The paper is organized into five sections with the next section presenting the details of data resources and associated reduction processes. Section 3 presents the temporal analysis technique and results, followed by discussion and implications in Section 4. We finally conclude in Section 5.
2 Multi-wavelength Archival Data and Reduction
We have made use of publicly available multi-wavelength data from -rays to NIR-optical. The -ray and X-ray data are taken from their respective data archive centers and reduced following the procedures recommended by the respective instrument teams. The corresponding contemporaneous/simultaneous NIR-optical data are taken from the SMARTS facility supporting the Fermi Multiwavelength AGN Science. The multi-wavelength observations preseneted here are part of coordinated follow-ups when the source flux in Fermi Large Area Telescope (LAT) approaches (Ciprini, Gasparrini, & Bastieri, 2012).
2.1 Fermi -ray Data
The LAT onboard Fermi Gamma-ray Space Telescope is a pair conversion imaging telescope which normally operates in scanning mode. It is sensitive to -ray photons with energy 20 MeV (Atwood et al., 2009) and covers the entire sky every 3 hours. Here, we have used the LAT data of 3C 454.3 from May 13th, 2014 to December 24, 2014 (MJD: 56790-57015) and analyzed using the Fermi Science Tool version v10r0p5 with appropriate selections and cuts recommended for the scientific analysis of PASS8 data.
The photon like events categorized as “evclass=128, evtype=3” with energies 0.1E300 GeV within a maximum zenith angle of 90∘ were selected from a circular region of interest (ROI) of centered on the source. The appropriate good time intervals were then generated by using the recommended criteria “(DATA_QUAL0)&&(LAT_CONFIG==1)”. The likely effects of cuts and selections, as well as the presence of other sources in the ROI, were incorporated by generating exposure map on the ROI and an additional annulus of around it. These events were then modeled using ‘unbinned likelihood analysis’ with input model file from the 3rd LAT catalog (3FGL –gll_psc_v16.fit; Acero et al., 2015)111 3C 454.3 is fitted with a log parabola model. The Galactic and isotropic extragalactic contributions were accounted by using the respective templates, gll_iem_v06.fits and iso_P8R2_SOURCE_V6_v06.txt file provided by the instrument team. A significance criterion of corresponding to a TS (Test Statistic) value of has been used for the source detection.
2.2 Swift X-ray Data
The Swift-XRT data during the mentioned period were analyzed using the methods suggested by the instrument team with the default parameters setting. Only pointed observations from the window timing (WT) or photon counting (PC) modes have been used. Each XRT observation is processed with the xrtpipeline task using the latest CALDB files within heasoft-6.18. Higher order products like source light-curves and spectra were generated with xselect using a source region of (90% PSF, Moretti et al., 2005). Most of the PC mode data have count rates above the pile-up free limit of 0.5 counts/s. Such observations were accounted for the pile-up using an annulus region, leaving the central 4-8 pixel radius corresponding to the departure of the XRT PSF model (King222 profile) and the data (Vaughan et al., 2006)333http://www.swift.ac.uk/analysis/xrt/pileup.php. The departure point was estimated by first fitting the King profile to the outer wing () of the PSF with normalization being the only free parameter and then extrapolating this best fit to the center. Accounts of instrument related effects and various selections on data are compensated by generating ancillary response file through xrtmkarf task. The resulting spectra were then modeled using phabs*powerlaw within XSPEC with a fixed neutral hydrogen column density (nH) of as deduced from Chandra observations444XRT observations with good exposure ( 5000 s) also suggest similar nH values. of 3C 454.3 (Villata et al., 2006). The best model parameters were then used to calculate the unabsorbed 0.3-10.0 keV flux using cflux.
2.3 NIR-Optical Data from SMARTS
The near-infrared (NIR)-optical photometric data are taken from the SMARTS555http://www.astro.yale.edu/smarts/glast/home.php blazar monitoring campaign, supporting the Fermi Multiwavelength AGN Science. Except for reddening corrections, the data are publicly available for Science use. The details of instruments and data reduction processes are mentioned in Bonning et al. (2012). Here, we have used all the available data during the high -ray activity period, corrected for reddening using an E(B-V) value of following Schlafly & Finkbeiner (2011).
2.4 Multi-wavelength Light Curves
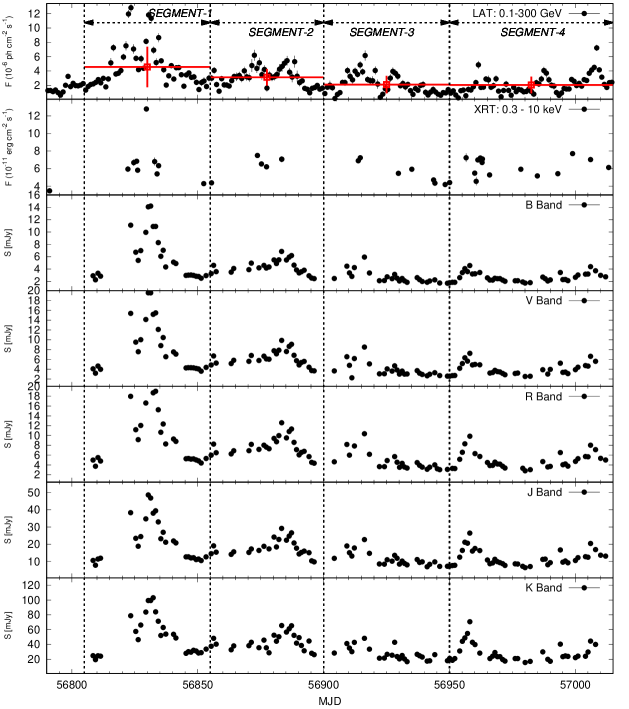
The multi-wavelength light curves from -rays to IR-optical between May 13th to December 24th, 2014 are shown in Figure 1. Varied levels of variability in both flux and time from IR-optical to -ray energies at different times can be seen. Though X-ray data are not well sampled, the trend does reflect the activity seen in the IR-optical and -ray light curves. Thus, based on -ray variability and sampling of data at other energies (IR-optical), the multi-wavelength light curve is divided into four segments; SEGMENT-1: MJD 56805-56855, SEGMENT-2: MJD 56855-56900, SEGMENT-3: MJD 56900-56950 and SEGMENT-4: MJD 56950-57015 demarcated by the vertical lines in Figure 1 to further investigate the variability. In addition, we have plotted the segment wise mean with intrinsic variance as its error for the -ray light curve (red points, Fig. 1) with fluxes for the entire duration being consistent with a log-normally distribution (e.g. Kushwaha et al., 2016). Flares in the -ray band, on the other hand, are defined using the segment’s variance: fluxes inconsistent with the segment’s intrinsic variance and total duration (rise + fall) of a week (termed as strong flares henceforth).
3 Variability Analysis and Results
We have carried out cross-correlation analysis between ray vs optical, ray vs NIR, optical vs optical, NIR vs NIR, and optical vs NIR using the z-transformed discrete correlation function (ZDCF) method (Alexander, 2013, 1997). The method uses equal population binning and Fisher’s z-transform to account for biases introduced by sparse, uneven sampling of data. It estimates the correlation coefficients using the data pairs sorted according to their lags with at least 11 (default) pairs in a bin, after the removal of interdependent data pairs from each bin. The errors on the coefficients, on the other hand, are estimated by employing Monte Carlo simulation of the light curve by taking into account the observational errors on the fluxes. For each instance of simulated light curve pair, the estimated correlation coefficients are transformed to the z-space via (Alexander, 2013, 1997)
where is the correlation coefficient and is the unknown population correlation coefficient of the bin. The transformed quantities are normally distributed and the ZDCF uses an ansatz to estimate the mean and variance of the (Alexander, 2013, for more details). Theses errors are then transformed to the correlation space providing errors on the correlation coefficients.
In the present study, we generated 1000 realizations of each light curve pair to estimate the error on the DCF values. The resulting DCF plots between different light curves for all the four segments are shown in Figure 2 and the corresponding lag values are reported in Table 1. A positive lag for DCF labeled as “LC1 vs LC2” means LC2 emission lagging LC1 and vice-versa.
In the cross-correlation analysis, we have not used X-ray observations taken with Swift/XRT in 0.5 – 10 keV energies and plotted in the 2nd panel from top in Figure 1. The X-ray data, though sparsely sampled are very few for the ZDCF analysis which by default requires at least 11 data pairs to form a bin. Data in optical and NIR bands, on the other hand, have almost identical sampling and on visual inspection appear very well correlated without any lag. To avoid many plots, we used V and R optical bands LCs for correlation with ray, and optical-optical correlation. NIR J band LCs are used for correlation with ray, NIR K band, and optical R band LCs. Cross-correlated plots for four segments are plotted in Figure 2 and correlation done between different bands are marked in different panels.
3.1 SEGMENT 1
SEGMENT 1 is taken from MJD 56805 to 56855 which shows three strong flares in -ray peaked at MJDs: 56823.5, 56830.5 and 56834.5, and appear nearly simultaneous (within observation cadence) in optical, NIR, and X-rays as well (see Figure 1). The ZDCFs are plotted in the 1st column from left of Figure 2, and cross-correlation results are reported in the 2nd column of Table 1. The results in Figure 2 and Table 1 show the strong flare detected in all EM bands are simultaneous (i.e. ZDCF lag is 0 within error). The flare emission is thus, likely co-spatial and hence, intrinsic to the source.
3.2 SEGMENT 2
SEGMENT 2 is taken from MJD 56855 to 56900 which shows three strong flares in LAT peaked at MJDs: 56872.5, 56885.5, and 56888.5 (see trends in X-rays) but only two similar trends in optical and NIR bands (see Figure 1). The trends in optical and NIR bands visually appear simultaneously with 2nd flare in ray. The corresponding ZDCFs are plotted in the 2nd column from left of Figure 2, and cross-correlation results are reported in the 3rd column of Table 1. The results in Figure 2 and Table 1 show the 2nd ray flare detected in all EM bands are simultaneous (i.e. ZDCF lag is 0 within error). The 1st gamma-ray flare is not observed in optical and NIR bands. Thus, similar to SEGMENT 1, 2nd ray flare emission is intrinsic in nature with the same emitting region in optical and NIR bands.
3.3 SEGMENT 3
SEGMENT 3 corresponds to MJD 56900 to 56950 and exhibits four strong flares in ray peaked at MJDs: 56909.5, 56916.5, 56920.5, and 56927.5 with the second being the most prominent. Further, the first two and the last ray flares are also accompanied in the optical and NIR bands, though the data sampling is comparatively poor (see Figure 1). The corresponding ZDCFs are plotted in the 3rd column from left in Figure 2 with results reported in the 4th column of Table 1. Though the DCFs are flatter and chaotic especially the optical-optical/NIR correlations, the results in Figure 2 and Table 1, nevertheless, show that the first prominent flare is detected nearly simultaneous in ray, optical, and NIR bands (i.e. ZDCF lag is 0 within error). The flare emission is therefore, just like the flares during the SEGMENTs 1 and 2.
3.4 SEGMENT 4
SEGMENT 4 is taken from MJD 56950 to 57015 and exhibits three strong flares in ray peaked at MJDs: 56961.5, 56987.5 and 57008.5. Similar trends can also be seen in the well sampled optical and NIR bands, though a few days earlier ( 3 days, see Figure 1). The ZDCFs are plotted in the 4th column from left of Figure 2 and show many (suggest two) peaks of similar strengths for -ray-optical/NIR (optical-optical/NIR) correlations. However, we select the DCF peak closest to the zero lag as others (except one at +20) are almost at the edge of the plot where the lags are of order of the data length used for estimating the correlations and are likely due to the three strong -ray flares in the segment correlating with the strongest optical/NIR fluxes in the segments (also supported by their separation in the light curves, see Fig. 1). The cross-correlation results corresponding to this DCF peak are reported in the 5th column of Table 1. The results in Figure 2 and Table 1 show the prominent rise/fall detected in ray lag by 3 days with respect to similar features seen in the optical and NIR bands. This is also supported by the well sampled optical-NIR data around the first and the last -ray flare. Thus, apart from flare emission being intrinsic, it hints that the emission probably originates from a different emitting regions for the optical/NIR and ray bands and/or an act of magnetic field within the same region (see §4).


| Light curves | SEGMENT-1 | SEGMENT-2 | SEGMENT-3 | SEGMENT-4 |
|---|---|---|---|---|
| vs V | ||||
| vs R | ||||
| vs J | ||||
| V vs R | ||||
| R vs J | ||||
| J vs K |
4 Discussion
The correlation analyses performed on a few continuous segments of multi-wavelength light curves exhibit a wide variety of features, ranging from nicely peaked to flat DCF between different energy bands. These DCF profiles signify the inter-relation and relative contributions of various emission components as reflected in the multi-wavelength light curves. Since the appearance of the biggest -ray flare (SEGMENT 1) to the last segment (SEGMENT 4), the lags between IR/optical--rays change from zero to a lag of 3 days with IR-optical leading -rays. On the other hand, the IR-optical remains consistent with no lags throughout (see Figure 2, and Table 1). The profiles too become more or less similar in all the bands by the end i.e. SEGMENT 4. The correlation analyses during SEGMENT 1 show a double peak in IR/optical--rays but a single peak in IR-optical correlations. The highest value DCF peak, however, is consistent with zero lag for all the bands (see Table 1). SEGMENT 2 also shows a similar nature and results. The correlation for SEGMENT 3 are comparatively flatter across all the bands compared to the rest (SEGMENTS) with the peak values being consistent with zero lags. SEGMENT 4, contrary to all, exhibits a lag of 3 days for -ray with respect to IR-Optical.
The highly correlated and nearly simultaneous variations across the electromagnetic spectrum strongly indicate a co-spatial origin with the same population powering the emission at all energies, at least during the flares. This, in turn, favors leptonic processes where the non-thermal relativistic electrons emitting synchrotron emission scatter the low energy seed photons to higher energies via IC. In 3C 454.3, multi-wavelength correlation studies in the past and the spectral analysis of the -ray flares suggest the emission to be mainly originating at the boundary of the BLR and/or beyond it i.e. at the torus scales (Fuhrmann et al., 2014; Coogan, Brown, & Chadwick, 2016; Britto et al., 2015). For a given lepton population , with being lepton Lorentz factor, the observed radiation due to synchrotron and IC of external seed photons follow the dependency (Kushwaha, Sahayanathan, & Singh, 2013; Sahayanathan & Godambe, 2012)
where is the bulk Lorentz factor, B is the emission region magnetic field, and with being the angle with respect to our line of sight. and refers to the energy density and peak frequency of the isotropic thermal photon field external to the jet in the AGN frame while is the Larmor frequency of electron of mass , and c is the speed of light in vacuum. Thus, the only difference between the two for a given emission region (particle population) is the magnetic field B, bulk Lorentz factor , and the external radiation field associated with the other AGN components like BLR, IR torus etc666Note that there exit other radiation fileds like extragalactic Background light (EBL), Cosmic Microwave Background (CMB). However, their energy densities are much below those from the AGNs components.. The external fields, however, hardly vary in comparison to the jet emission on timescales of days to week.
Further, the emitted power in 3C 454.3 is dominated by the GeV -rays, even in the quiescent phase observed by the Fermi-LAT (e.g. Lei & Wang, 2014). Thus, the cooling time of the particles emitting at GeV energies (, peak of the SED and also at the peak of low energy hump) in the observer’s frame can be estimated as (e.g. Kushwaha, Singh, & Sahayanathan, 2014)
assuming a blackbody torus field () of with a covering fraction of as observed in PKS 1222+216 (Malmrose et al., 2011) and a bulk Lorentz factor of 20 (Lister et al., 2013). The addition of BLR field will only lower the cooling timescale further.
The estimated cooling timescale is, thus, too small compared to the duration of any of the flares as well as the binning duration of the LAT data in the analysis. Hence, one expects a nearly simultaneous variation at IR/optical and -rays with profile of light curves governed by the size of the emission region. This is true for the SEGMENT 1-3 but not for SEGMENT 4. The appearance of flares in -ray without any counterparts in synchrotron bands (IR/optical) can be explained as a result of the orientation of magnetic field (Manasvita Joshi *private communication*). Even in multi-zone leptonic models that have been advocated for such flares (Cohen et al., 2014), the problem remains. Thus, the appearance of IR/optical flare before -ray suggest some dynamical effect associated with the magnetic field, bulk motion, and/or the external radiation field. Since IR/optical emission, for a given particle distribution, depends only on magnetic field; the IR/optical flare without -ray could be just due to change in orientation and/or magnitude of the magnetic field (Chatterjee et al., 2013). This interpretation is also supported by the X-ray (being synchrotron self-Compton origin, e.g. Lei & Wang, 2014) emission which show the trend observed in the IR/optical. Alternatively, it can be a combined effect of changes in magnetic field and a lower bulk Lorentz factor, suggesting the origin close to the black hole (Chatterjee et al., 2013). However, we disfavor this option as the -ray starts rising while the IR/optical flare is still in declining mode, demanding a substantial change in Lorentz factor. Moreover, a decelerating jet model is expected to have asymmetric light curves, contrary to the symmetric profile of the flares here (e.g. Kushwaha et al., 2014). Another possible explanation could be a steeper decline of external radiation field energy density relative to the magnetic field energy density in the jet (Hayashida et al., 2012; Janiak et al., 2012). This present an interesting picture where the location is probably at the boundary of transition from BLR to IR dominance as advocated by multi-wavelength studies (Fuhrmann et al., 2014). Thus, one can estimate the typical magnetic field required assuming the equivalence between the external and magnetic energy density as
| (1) |
consistent with the typical values required by SED modeling ( is the Stefan-Boltzmann constant).
The strong correlation found here is consistent with other similar studies on the source with lags of zero to few days (Bonning et al., 2009; Li et al., 2015; Tachibana et al., 2015; Wehrle et al., 2012). The remarkably similar results during various -ray flaring states of different amplitude and durations in combination with a very small cooling timescales, implies an extended -ray emitting region with almost similar physical conditions with the duration and profile being governed by the size and number density of the emitting particles. This, in turn, also implies almost similar spectral evolution during these flaring states. The hardening/softening of -ray spectra (Britto et al., 2015) can be understood as a result of competitive contributions between the BLR and IR torus photons, most likely associated with the variation in the bulk Lorentz factor. These results are also in agreement with the correlation studies on FSRQs which show lags between 0 to few 10s of days (Ackermann et al., 2014; Bonning et al., 2012; Hayashida et al., 2012, 2015) with a tendency of -ray leading the optical (Gaur et al., 2012; Cohen et al., 2014). Here in this case, however, the case is opposite with IR-optical emission leading the -rays (but see Gaur et al., 2012) and has also seen in other blazars as well (Chatterjee et al., 2013).
5 Conclusions
We performed a correlation analysis of multi-wavelength emission from 3C 454.3 during a high -ray activity period from May 13 - December 24, 2014, which is also noticed in other energy bands. The study performed over an almost continuous segment of data shows a highly correlated variation, almost simultaneous across the electromagnetic spectrum supporting a co-spatial emission, thereby strongly favoring leptonic origin scenarios. Interestingly, the correlation during this period changes from no lags between IR/optical--ray to a lag of 3 days with IR/optical leading the -ray suggesting a change in magnetic field configuration/strength and/or a declining external field as the likely process driving the emission.The similarity of results with previous studies also suggests that the physical conditions remain more or less similar during different flaring events with amplitude and durations of flares being mainly governed by the size and particle/magnetic-energy density respectively.
PK’s work at University of Sao Paulo (IAG-USP) is supported by the FAPESP Grant No. 2015/13933-0. Most of the work was done while PK was in IUCAA. ACG’s work is partially supported by Chinese Academy of Sciences (CAS) President’s International Fellowship Initiative (PIFI) Grant No. 2016VMB073. This research has made use of data, software and web tools of High Energy Astrophysics Science Archive Research Center (HEASARC), maintained by NASA’s Goddard Space Flight Center and an up-to-date SMARTS optical/near-infrared light curves available at www.astro.yale.edu/smarts/glast/home.php.
References
- Abdo et al. (2011) Abdo A. A., et al., 2011, ApJ, 733, L26
- Acero et al. (2015) Acero F., et al., 2015, ApJS, 218, 23
- Ackermann et al. (2014) Ackermann M., et al., 2014, ApJ, 786, 157
- Ackermann et al. (2010) Ackermann M., et al., 2010, ApJ, 721, 1383
- Alexander (2013) Alexander T., 2013, arXiv, arXiv:1302.1508
- Alexander (1997) Alexander T., 1997, ASSL, 218, 163
- Atwood et al. (2009) Atwood W. B., et al., 2009, ApJ, 697, 1071
- Błażejowski et al. (2000) Błażejowski M., Sikora M., Moderski R., Madejski G. M., 2000, ApJ, 545, 107
- Bonning et al. (2012) Bonning E., et al., 2012, ApJ, 756, 13
- Bonning et al. (2009) Bonning E. W., et al., 2009, ApJ, 697, L81
- Böttcher et al. (2013) Böttcher M., Reimer A., Sweeney K., Prakash A., 2013, ApJ, 768, 54
- Britto et al. (2015) Britto R. J. G., Buson S., Lott B., Razzaque S., Bottacini E., 2015, arXiv, arXiv:1511.02280
- Chatterjee et al. (2013) Chatterjee R., et al., 2013, ApJ, 763, L11
- Ciprini, Gasparrini, & Bastieri (2012) Ciprini S., Gasparrini D., Bastieri D., 2012, IAUS, 285, 294
- Cohen et al. (2014) Cohen D. P., Romani R. W., Filippenko A. V., Cenko S. B., Lott B., Zheng W., Li W., 2014, ApJ, 797, 137
- Coogan, Brown, & Chadwick (2016) Coogan R. T., Brown A. M., Chadwick P. M., 2016, arXiv, arXiv:1601.07180
- Dermer (2015) Dermer C. D., 2015, MmSAI, 86, 13
- Donnarumma et al. (2009) Donnarumma I., et al., 2009, ApJ, 707, 1115
- Fossati et al. (1998) Fossati G., Maraschi L., Celotti A., Comastri A., Ghisellini G., 1998, MNRAS, 299, 433
- Fuhrmann et al. (2014) Fuhrmann L., et al., 2014, MNRAS, 441, 1899
- Gaur et al. (2012) Gaur, H., Gupta, A. C., & Wiita, P. J. 2012, AJ, 143, 23
- Ghisellini et al. (2014) Ghisellini G., Tavecchio F., Maraschi L., Celotti A., Sbarrato T., 2014, Natur, 515, 376
- Giommi et al. (2006) Giommi P., et al., 2006, A&A, 456, 911
- Hartman et al. (1993) Hartman R. C., et al., 1993, ApJ, 407, L41
- Hayashida et al. (2015) Hayashida M., et al., 2015, ApJ, 807, 79
- Hayashida et al. (2012) Hayashida M., et al., 2012, ApJ, 754, 114
- Janiak et al. (2012) Janiak M., Sikora M., Nalewajko K., Moderski R., Madejski G. M., 2012, ApJ, 760, 129
- Jorstad et al. (2013) Jorstad S. G., et al., 2013, ApJ, 773, 147
- Kalberla et al. (2005) Kalberla P. M. W., Burton W. B., Hartmann D., Arnal E. M., Bajaja E., Morras R., Pöppel W. G. L., 2005, A&A, 440, 775
- Kushwaha et al. (2016) Kushwaha, P., Chandra, S., Misra, R., et al. 2016, ApJ, 822, L13
- Kushwaha et al. (2014) Kushwaha P., Sahayanathan S., Lekshmi R., Singh K. P., Bhattacharyya S., Bhattacharya D., 2014, MNRAS, 442, 131
- Kushwaha, Sahayanathan, & Singh (2013) Kushwaha P., Sahayanathan S., Singh K. P., 2013, MNRAS, 433, 2380
- Kushwaha, Singh, & Sahayanathan (2014) Kushwaha P., Singh K. P., Sahayanathan S., 2014, ApJ, 796, 61
- Li et al. (2015) Li H. Z., Chen L. E., Yi T. F., Jiang Y. G., Chen X., Lü L. Z., Li K. Y., 2015, PASP, 127, 1
- Lei & Wang (2014) Lei, M., & Wang, J. 2014, PASJ, 66, 92
- Lister et al. (2013) Lister, M. L., Aller, M. F., Aller, H. D., et al. 2013, AJ, 146, 120
- Malmrose et al. (2011) Malmrose M. P., Marscher A. P., Jorstad S. G., Nikutta R., Elitzur M., 2011, ApJ, 732, 116
- Mannheim & Biermann (1992) Mannheim K., Biermann P. L., 1992, A&A, 253, L21
- Mao et al. (2016) Mao P., Urry C. M., Massaro F., Paggi A., Cauteruccio J., Künzel S. R., 2016, arXiv, arXiv:1604.03856
- Moretti et al. (2005) Moretti A., et al., 2005, SPIE, 5898, 360
- Mücke & Protheroe (2001) Mücke A., Protheroe R. J., 2001, APh, 15, 121
- Pian et al. (2006) Pian E., et al., 2006, A&A, 449, L21
- Potter & Cotter (2013) Potter W. J., Cotter G., 2013, MNRAS, 429, 1189
- Raiteri et al. (1998) Raiteri C. M., Ghisellini G., Villata M., de Francesco G., Lanteri L., Chiaberge M., Peila A., Antico G., 1998, A&AS, 127, 445
- Sahayanathan & Godambe (2012) Sahayanathan S., Godambe S., 2012, MNRAS, 419, 1660
- Schlafly & Finkbeiner (2011) Schlafly E. F., Finkbeiner D. P., 2011, ApJ, 737, 103
- Striani et al. (2010) Striani E., et al., 2010, ApJ, 718, 455
- Tachibana et al. (2015) Tachibana Y., Kawai N., Pike S., for the MAXI team, the MITSuME team, 2015, arXiv, arXiv:1502.03610
- Urry & Padovani (1995) Urry C. M., Padovani P., 1995, PASP, 107, 803
- Vaughan et al. (2006) Vaughan S., et al., 2006, ApJ, 638, 920
- Vercellone et al. (2010) Vercellone S., et al., 2010, ApJ, 712, 405
- Vercellone et al. (2009) Vercellone S., et al., 2009, ApJ, 690, 1018
- Villata et al. (2006) Villata M., et al., 2006, A&A, 453, 817
- Wehrle et al. (2012) Wehrle A. E., et al., 2012, ApJ, 758, 72
- Zdziarski Böttcher (2015) Zdziarski A. A., Böttcher M., 2015, MNRAS, 450, L21