Adsorption-induced symmetry reduction of metal-phthalocyanines studied by vibrational spectroscopy
Abstract
We investigate the vibrational properties of Pt- and Pd-phthalocyanine (PtPc and PdPc) molecules on Ag(111) with high resolution electron energy loss spectroscopy (HREELS). In the monolayer regime, both molecules exhibit long range order. The vibrational spectra prove a flat adsorption geometry. The red shift of vibrational modes and the presence of asymmetric vibrational peaks suggest a moderate interaction of the molecules with the substrate, accompanied by a static charge transfer from the metal to the molecules. The appearance of a particular vibrational mode, which (i) belongs to the representation of the original fourfold molecular symmetry group and which (ii) exhibits interfacial dynamical charge transfer (IDCT), proves that a preferential charge transfer from the Ag surface into one of the originally doubly degenerate lowest unoccupied molecular orbitals (LUMOs) of symmetry takes place, i.e. the electronic degeneracy is lifted and the molecule-surface complex acquires the twofold symmetry group . The vibration-based analysis of orbital degeneracies, as carried out here for PtPc/Ag(111) and PdPc/Ag(111), is not restricted to these cases. It is particularly useful whenever the presence of multiple molecular in-plane orientations at the interface makes the analysis of orbital degeneracies with angle-resolved photoemission spectroscopy difficult.
I Introduction
Organic molecules with -conjugated electron systems have been intensively studied in recent years. Apart from a fundamental interest in their electronic properties, this activity is motivated by the wide range of possible applications in the fields of optoelectronicsFriend et al. (1999); Blom et al. (2007) and spintronics Sanvito (2011). Among these molecules, metal-phthalocyanines (MPc), i.e. tetrabenzoporphyrazine macrocycles with a metal atom in their center, play an important role, because of their planar geometry, their thermal stability, their suitability for organic molecular beam epitaxy, and their chemical versatility that its brought about by very diverse central metal atoms Gottfried (2015). In fact, MPc molecules have been employed in organic light emitting diodesBlochwitz et al. (1998), field effect transistorsCrone et al. (2000); Horowitz (1998) and solar cellsConboy et al. (1998).
The interaction of MPc with metal surfaces is interesting both from a fundamental point of view, in particular regarding the balance between the contributions of the central metal atom and the -electron system, and for applications, in which such interfaces are the primary functional elements. For MPc with almost filled -shells, the molecule-substrate interaction is dominated by the chemisorptive or physisorptive interaction of the macrocycle with the metal surface Gottfried (2015). If there is a chemisorptive contribution to this bond, this often leads to charge transfer from the metal into the lowest unoccupied molecular orbital (LUMO) of the molecule Gottfried (2015). This is also true in the case of PtPc and PdPc on Ag(111), as we show in this paper.
An interesting issue in relation to the molecule-substrate interaction in general and the charge transfer in particular is the symmetry of adsorbed MPc molecules. Except for a few cases, e.g., SnPc Wang et al. (2009a), the central metal fits into the inner cavity and the corresponding isolated MPc belongs to the symmetry group Gottfried (2015). Because of the presence of the surface, the symmetry of the molecule is lowered to . However, a further molecular symmetry reduction to a twofold symmetry is often observed in scanning tunneling microscopy (STM) Chang et al. (2008); Karacuban et al. (2009); Wang et al. (2009a, b); Cuadrado et al. (2010); Snezhkova et al. (2015).
The symmetry reduction of MPc molecules from fourfold to twofold symmetry raises an intriguing question regarding the charge transfer into the molecule. The LUMO of isolated MPc is twofold degenerate and belongs to the irreducible representation of the symmetry group. This degeneracy is closely related to cross-conjugation in the central porphyrazine macrocycle of phthalocyanine molecules Phelan and Orchin (1968); Gottfried (2015). When charge is transferred into the LUMO, two situations are conceivable: either both orbitals remain degenerate and receive the same amount of charge, or the degeneracy is lifted and charge is transferred preferentially into one of the two. Degeneracy lifting has been invoked in certain cases to explain the symmetry reduction of MPc molecules Karacuban et al. (2009); Uhlmann et al. (2013); Snezhkova et al. (2015), while in other cases equal filling of both orbitals was conjectured Feyer et al. (2014), or the symmetry reduction was assigned to structural effects Chang et al. (2008); Cuadrado et al. (2010); Niu et al. (2013).
At first glance, STM seems to be the method of choice for symmetry analysis of molecular adsorbates, because any symmetry breaking should become immediately obvious in the image. However, in STM purely electronic as well as purely geometric effects can both lead to a symmetry reduction in the image, and there are only a few cases in which the origin of the broken symmetry can be determined on basis of STM alone (e.g. Ref. Uhlmann et al., 2013). Of course, in most cases geometric and electronic effects will be coupled to each other, because a geometric distortion of the molecule by the influence of the external environment will also break the electronic symmetry within the molecule, and vice versa an electronic symmetry reduction will generally lead to a structural distortion (Jahn-Teller effect Jahn and Teller (1937); Köpper et al. (2009); Uhlmann et al. (2013)). Yet, it is still an important question to ask which is the dominant of the two effects. For example, a strong geometric distortion may lead to a negligible symmetry break of electronic states.
For this reason, additional experimental methods have been employed to settle the issue of a possible lifting of the degeneracy. These include core level spectroscopy Snezhkova et al. (2015), near-edge x-ray absorption spectroscopy (NEXAFS) Borghetti et al. (2014), or density functional theory (DFT) Snezhkova et al. (2015). Recently, also photoemission tomography Puschnig et al. (2009, 2011) has been applied to this problem: In the case of FePc/Ag(111) no splitting of the LUMO was found Feyer et al. (2014), while for CuPc/Ag(110) a clear splitting was observed Schönauer et al. (2016). Photoemission tomography has the unique advantage that if a degeneracy lifting takes place, the actual orientation of the filled orbital can be determined Schönauer et al. (2016). However, this orientational sensitivity can also be a drawback, if many molecules with many different orientations are present at the surface. In this case, photoemission tomography results become difficult to analyze Feyer et al. (2014).
Here we present an approach that does not suffer from the presence of multiple orientations, because only the internal symmetry of the molecule-surface complex matters. Yet at the same time, if applicable, it leads to unambiguous results regarding electronic symmetry breaking, i.e. degeneracy lifting. This approach is based on vibrational spectroscopy. Specifically, we employ high resolution electron energy loss spectroscopy (HREELS) which in its dipole scattering mechanism is sensitive to infrared (IR) active vibrational modes Ibach and Mills (1982). Due to the surface selection rule, only totally symmetric modes of the molecule-surface complex are IR active Ibach and Mills (1982). Any reduction of the molecular symmetry group upon adsorption may imply that formerly inactive modes can become IR active. Because, as mentioned above, the symmetry reduction can be effected both by geometric and electronic effects, also the corresponding IR activation can have these two distinct origins. However, if additionally the line shape of an activated mode is taken into account, it is (under favorable conditions) possible to unambiguously link the activation of certain vibrational modes to an electronic symmetry breaking. More specifically, we argue here that if a mode that indicates a particular symmetry reduction has a Fano line shape, this proves an electronic contribution (i.e. degeneracy lifting) to this symmetry reduction, because the Fano line shape indicates an interfacial dynamical charge transfer (IDCT), and for an IDCT to be observable in a MPc molecule, there must exist an imbalance in the occupation of the two LUMOs. Hence, their degeneracy must be broken.
II experimental details
The experiments were performed in an ultra-high vacuum (UHV) system consisting of a preparation and an analysis chamber equipped with low electron energy diffraction (LEED) and HREELS. The pressures in the chambers were and mbar, respectively. The Ag(111) crystal surface was prepared by sputtering at keV followed by annealing to K until a sharp LEED pattern was observed. Thin films of PdPc and PtPc were prepared in UHV by depositing the molecules, evaporated from a home-made Knudsen cell, on the crystal kept at room temperature. The sublimation temperatures were 770 K and 670 K for PdPc and PtPc, respectively. A multilayer phase, which does not exhibit a LEED pattern, is prepared by sublimating PtPc more than ten times longer than the sublimation time necessary to obtain the ordered monolayer phase. The pressure in the preparation chamber did not exceed mbar during sublimation.
After the layer was prepared, its long range order was checked by LEED. Vibrational features were recorded with a primary electron beam energy of 6.3 eV in both specular and off-specular geometries. The incoming beam is directed to the sample with an angle of with respect to surface normal. In the specular (off-specular) geometry the electrons are detected at an angle of () with respect to the surface normal. The energy resolution, estimated from the full width at half maximum (FWHM) of the elastic peak, is in the range of (). In order to interpret the complex vibrational spectra, we performed theoretical calculations of isolated PtPc and PdPc molecules using Gaussian Frisch et al. . The DFT calculations of their electronic structure and of their vibrational eigenfrequencies were carried out using the LanL2DZ basis set and the B3LYP functional. The theoretical vibration energies were compressed by a factor Liu et al. (2007); Maslov (2006).
III Platinum-phthalocyanine on Ag(111)
III.1 Long range order
PtPc molecules form ordered two-dimensional structures on the Ag(111) surface. Like for most of the MPc molecules, two diffuse rings are detected at room temperature in LEED at low coverage after annealing a thick layer up to 730 K (see Ref. SM, ). This two-dimensional disordered phase has already been observed in the case of, for example, CuPc on Ag(111) and Au(111) Kröger et al. (2010); Stadtmüller et al. (2011); Schönauer et al. (2016). Stadler et al. interpreted the presence of this two-dimensional gas phase at low coverage as the result of an intermolecular repulsion Stadler et al. (2009). As the density of the PtPc molecules on the surface increases, diffraction spots are detected in LEED at room temperature (ordered phase). According to high resolution structural measurements for CuPc, the unit cell formed by the CuPc molecules decreases continuously in size as the coverage is increased. Our LEED measurements indicate a similar behavior for PtPc on Ag(111).
III.2 Vibrational properties of the multilayer and mode assignment
| Modes | Multilayer | Ordered monolayer | DFT | Symmetry | Description | |
|---|---|---|---|---|---|---|
| a | 145 | OP bend: | Molecule | |||
| R1 | - | 255 | - | - | - | |
| b | - | OP bend: | Molecule | |||
| c | 350 | OP bend: | N atoms | |||
| d | 430 | OP bend: | N + C atoms | |||
| e | - | IP sciss: | N + C atoms | |||
| R2 | - | 565 | - | - | - | |
| f | - | IP deform: | Molecule | |||
| R3 | - | 655 | - | - | - | |
| g | 715 | OP bend: | Main ring | |||
| h | 765 | OP bend: | N atoms + Phenyl groups | |||
| i | - | IP deform: | Molecule | |||
| j | - | OP bend: | Phenyl groups | |||
| k | - | IP deform/stretch: | Molecule | |||
| F1 | - | - | - | - | ||
| l | - | IP rock/stretch: | N atoms + Phenyl groups | |||
| F2 | - | - | - | - | ||
| m | - | IP stretch: | Main ring | |||
| F3 | - | - | - | - | ||
| n | - | IP stretch: | Phenyl groups | |||
| o | - | IP stretch: | H atoms | |||
PtPc has distinct vibrational modes ( is the number of atoms in the molecule). Its symmetry group is , its vibrational representation is . Modes transforming according to the irreducible representations and are IR active modes, i.e., the motion of the atoms produces a dynamic dipole moment . Depending on the direction of , the IR active modes can be classified as in-plane modes, in which lies in the molecular -plane ( modes), and as out-of-plane modes, in which is oriented perpendicular to the molecular plane along the -direction ( modes). The , , and modes are Raman (R) active modes, i.e., the atomic vibration induces a change of the molecular polarizability.
In this work we are interested in IR active modes, because HREELS is sensitive to the dynamic dipole moment . According to the surface selection rule Ibach and Mills (1982), modes for which is oriented perpendicular to the surface are excited in the dipole scattering mechanism (specular geometry), whereas modes having a dynamic dipole oriented parallel to the surface are suppressed, because the produced by the image charges in the substrate is anti-parallel to , leading to a cancellation of the two. In the language of group theory, the surface selection rule states that only totally symmetric modes (, and representations) of the molecule-substrate complex may be visible in HREELS. In contrast, all modes can be excited in the impact scattering regime (off-specular geometry). The appearance and/or disappearance of specific modes in the HREELS spectrum, depending on the measurement geometry, give important information on the symmetry of the molecule-substrate complex. Therefore, an accurate assignment of the vibrational features is necessary.
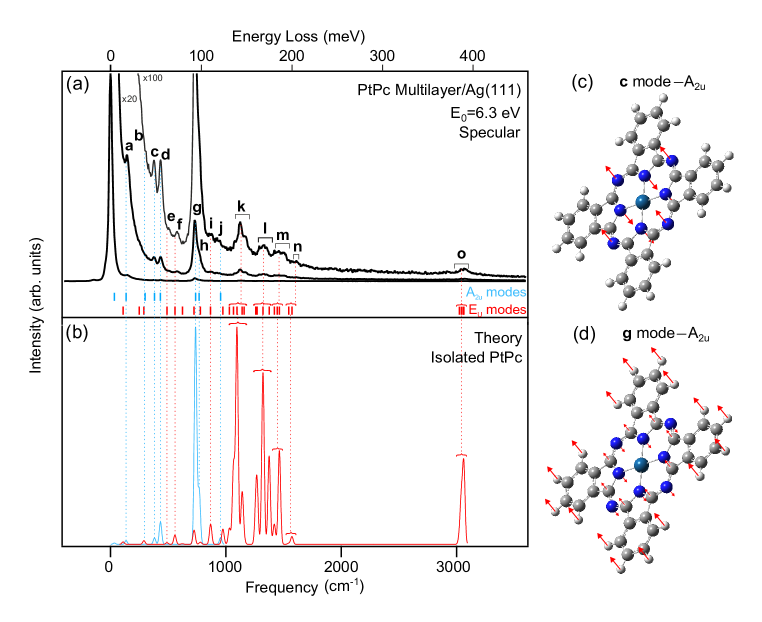
The assignment is carried out by comparing the experimental peaks in the spectrum of a multilayer with calculated frequencies of the isolated PtPc molecule. In the multilayer, the effect of the substrate is reduced and thus the spectral properties are expected to be similar to the isolated molecule. Fig. 1(a) shows the experimental spectrum of a PtPc multilayer on Ag(111), acquired in specular geometry, in comparison with the calculated spectrum of the isolated PtPc molecule (Fig. 1(b)). The calculated spectrum contains a gaussian broadening of , similar to the experimentally observed one, and is composed of (blue lines) and (red lines) modes only, because these are the sole IR active vibrations. We note that all experimental features can be identified in good agreement with theory. A simplified description of the modes is given in Tab. 1 (see Ref. SM, for details). The spectrum is dominated by the modes, with dynamic dipole moments perpendicular to the molecular plane, such as the strongest vibrations a at (out-of-plane bending of the whole molecule except Pt) and g at (out-of-plane bending of the central ring of alternating C and N atoms around the metal porphyrazin macrocycle together with the H atoms, Fig. 1(d)). Compared to experiment, the theoretical mode intensities appear reduced, suggesting a predominantly flat adsorption orientation of the molecules in the multilayer. However, the intensity ratio of the in-plane modes () and out-of-plane modes () is conserved in the off-specular spectrum (not shown). This can be caused by a residual contribution of the dipole scattering in the off-specular geometry due to, e.g., surface roughness.
III.3 Vibrational Properties of the ordered monolayer phase and molecular symmetry reduction
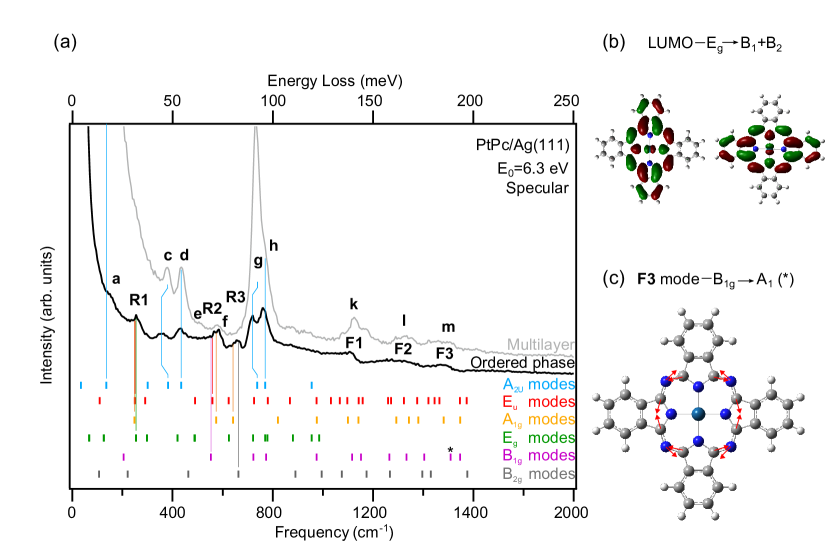
The vibrational properties of the ordered monolayer phase are discussed in comparison with those of the multilayer. Fig. 2(a) shows specular HREELS spectra of the ordered monolayer phase and the multilayer. In the ordered monolayer, most of the in-plane modes are absent, especially between 1000 and . But in this range three asymmetric peaks (F1, F2 and F3) are detected. Their origin will be discussed later. The absence of the in-plane vibrations indicates that the surface selection rule strongly attenuates the in-plane modes in comparison to the out-of-plane modes. We conclude that the molecules in the monolayer are oriented strictly parallel to the Ag surface.
III.3.1 Out-of-plane modes
Like in the multilayer, all of the out-of-plane modes are detected in the spectrum of the ordered monolayer phase. However, in the latter the c and g modes are shifted to lower wavenumbers. The shift of the c mode () is larger than that of the g mode (). The c mode is associated with the out-of-plane bending of the aza bridge N atoms against the pyrrole N atoms (Fig. 1(c)), while in the g mode all N atoms move in-phase against the C atoms in the porphyrazin macrocycle and the H atoms in the phenyl groups (Fig. 1(d)). We assign the sizable shifts of these two modes to the molecule-substrate interaction. In contrast to FePc and CoPc on Ag(111) Ohta et al. (2014); Baran and Larsson (2013), for which the central metal forms a covalent bond with the substrate, the molecule-substrate interaction in PtPc takes place through the porphyrazin macrocycle, because neither the c nor the g modes, which are the ones that are most strongly influenced by the substrate, involve the central metal atom, unlike the a mode for example, which involves the metal atom but does not show an appreciable shift. This observation is in agreement with the general trend of a reduced metal participation in the molecule-substrate bond as the number of -electrons increases Gottfried (2015). The observation that the shift of c is larger than that of g, in conjunction with the fact that the c mode displacement is due to the N atoms only while in the g mode the displacements of N atoms are relatively small, suggests that most of the interaction between the molecule and the Ag substrate occurs via the N atoms.
| Mode | Symmetry |
|---|---|
| R1 | // |
| R2 | // |
| R3 | / |
| F1 | // |
| F2 | /// |
| F3 |
III.3.2 Raman modes
Another noteworthy difference between the vibrational properties of the ordered monolayer phase and the multilayer is the appearance of new modes labeled R1, R2 and R3 in Fig. 2(a). Based on their frequencies, the R1 peak at can be interpreted either as a , or as a mode, while the R2 peak at may be attributed to either a , or a mode. Finally, the R3 peak at can either be ascribed to a or a mode. The possible assignments are summarized in Tab. 3. Ruling out the modes, because as in-plane IR modes they should be screened by the metal surface, only the , , and modes remain as possible assignments. However, they are R active modes and as such not expected to contribute to the spectrum of an isolated molecule. But they can be activated if the molecular symmetry is reduced. Thus, a symmetry reduction of the molecule in contact with the surface must be considered.
When a PtPc molecule adsorbs with its plane parallel to the surface, its molecular symmetry is reduced from the original group. Specifically, at least the in-surface-plane mirror symmetry is broken. A PtPc molecule lacking its -plane symmetry belongs to the group. However, further symmetry reductions are possible, e.g., to the group, if the fourfold symmetry of the molecule is broken. With the help of so-called correlation tables it is possible to deduce how the modes (representations) of the isolated molecule () relate to the ones of the molecule-substrate system of reduced symmetry ( or lower) Ibach and Mills (1982). An adaptation of the correlation tables of the group from Ref. Ibach and Mills, 1982, considering the observed R modes (and the F modes), is given in Tab. 2.
In principle, there is a chance that the observation of the R modes allows us to deduce the symmetry of the molecule-substrate complex. For example, a mode would become activated for HREELS dipole scattering only if the symmetry was reduced to upon adsorption (Tab. 2). Hence, we must look for a single reduced symmetry group in which the vibrational modes of the free molecule which we assign to R1, R2 and R3 map onto a totally symmetric representation (, or ). However, since it is a possibility that R1, R2 and R3 could all originate from modes (see Tab. 3), all three would in this case be visible in dipole scattering HREELS irrespective of the symmetry of the molecule-substrate complex (, or ). Hence, it is not possible to conclude on the basis of R1, R2 and R3 alone whether PtPc preserves its fourfold symmetry upon adsorption () or lowers its symmetry to a twofold one (/).
III.3.3 Asymmetric peaks
In order to identify the symmetry of the PtPc molecule on the Ag surface, we now turn to the analysis of the F modes. Between and , where the modes are excited in the multilayer spectrum (Fig. 1(a)), three asymmetric features, labeled F1, F2 and F3 in Fig. 2(a), are visible in the spectrum of the ordered monolayer. Asymmetric line shapes of Fano type are well known for molecular and atomic adsorbates on metallic surfaces in the presence of an IDCT Chabal (1985); Kröger et al. (1997); Tautz et al. (2002); Amsalem et al. (2009); Dou et al. (2010); Kröger (2010); Braatz et al. (2012); Rosenow et al. (2016). A prerequisite for the occurrence of IDCT is the partial filling of an orbital that couples to a molecular vibration. Then, as the vibration is excited, the associated distortion of the molecule along the vibrational coordinate modulates the orbital energy periodically, leading to an oscillatory charge flow between the molecule and the substrate that is effectively pumped by the vibration. In the presence of IDCT, the dynamical dipole moment of the vibration is the sum of the ionic and the electronic contributions, and . If the dynamic electron transfer between the orbital and the substrate, yielding , is not in phase with the ion movement, leading to , i.e. if the Born-Oppenheimer approximation breaks down, acquires an imaginary part (). This leads to a damping of the adsorbate vibration and yields an asymmetric Fano line shape. By introducing the asymmetry parameter the resulting line shape can be expressed as Langreth (1985); Crljen and Langreth (1987); Kröger (2006)
| (1) |
where and are constants, and denotes the width of the Fano profile. is the vibrational frequency of a given mode and , the asymmetry ratio, is (negative) positive if is (anti-) parallel to .
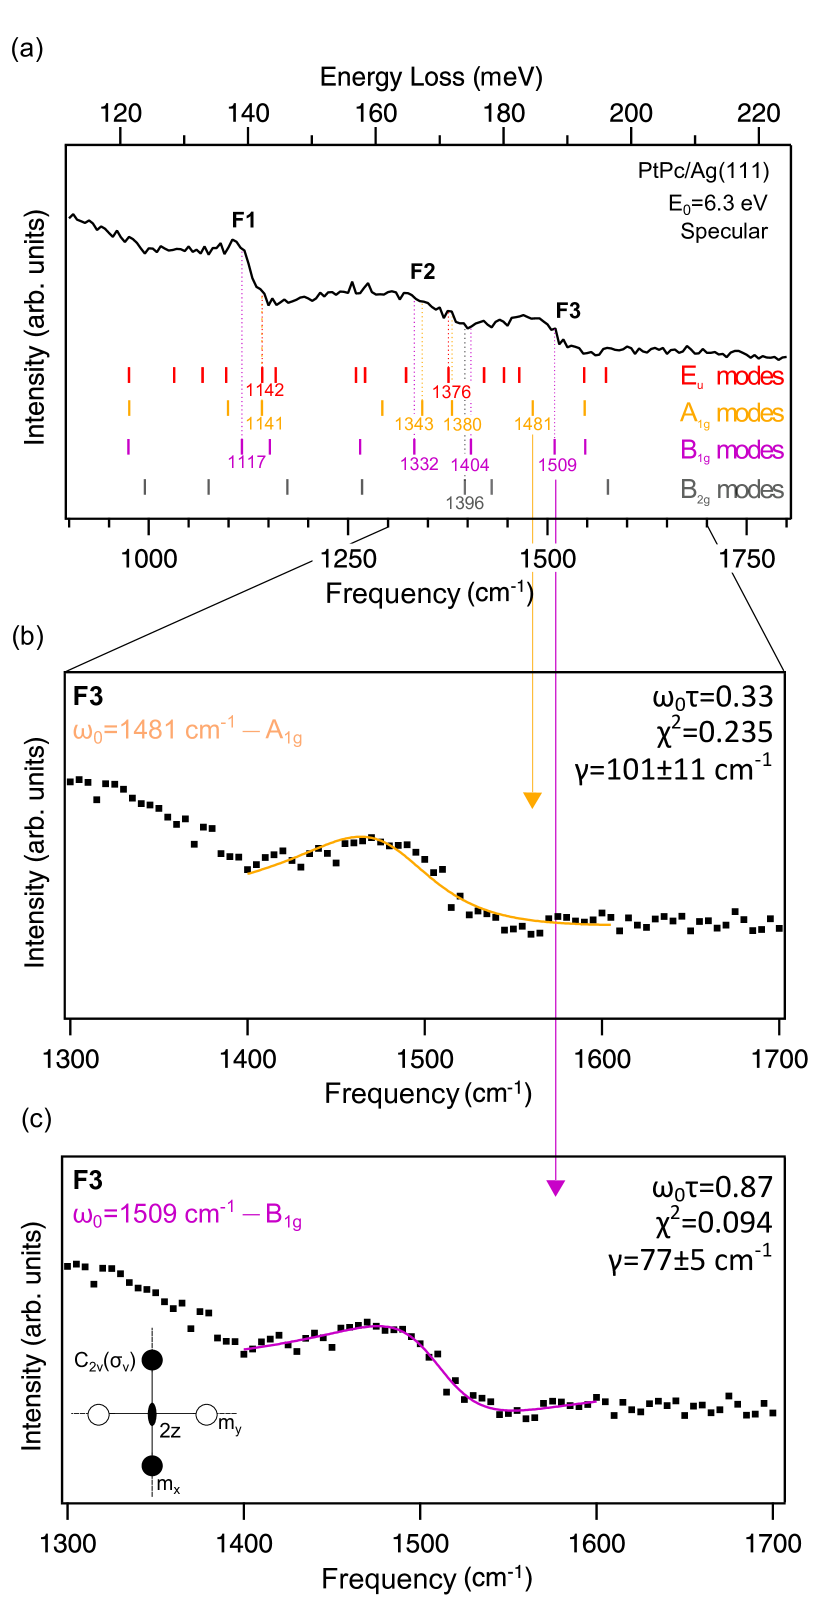
In order to identify which vibrational modes are involved in the IDCT that produces F1, F2 and F3, Eq. 1 is used to fit these features, using values of that are determined by DFT calculations of an isolated molecule. All the calculated frequencies in the range from to have been tested (Fig. 3(a)). The fits can be found in the supplement SM . The few modes that yield reasonable fits for F1 and F2 are summarized in Tab. 3. Because both features may possibly be assigned to a mode, whose representation in the group transforms into a totally symmetric one in both the or groups, it is not possible to identify the symmetry of the molecule-substrate complex by considering these modes.
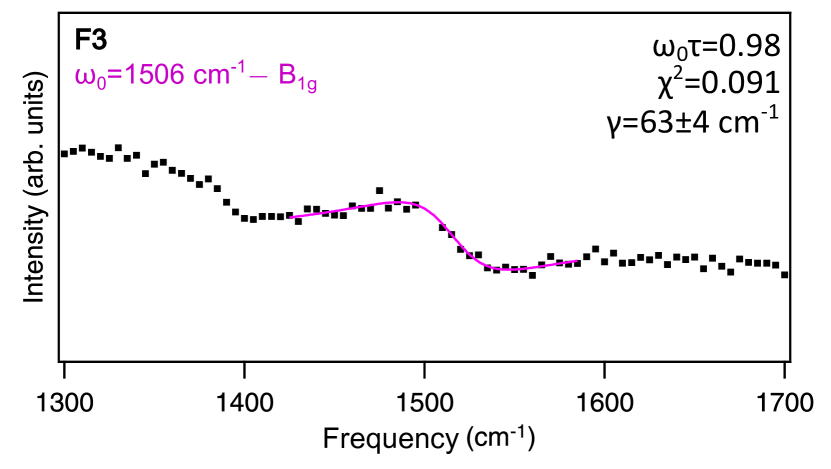
Interestingly, however, F3 at about can only be fitted well when using a vibrational mode, namely the one at , see Fig. 3(c). The fitted value of () compares well to the results for ZnPc/Ag(110) () Amsalem et al. (2009). For comparison, an example of a bad fit using an mode () is also shown in Fig. 3(b). Since the R active mode of the symmetry group transforms into an IR active mode only in the group (Tab. 2), we conclude that the molecular symmetry must be reduced to twofold. The full symmetry of the PtPc molecule on the Ag(111) surface is schematically shown in the inset of Fig. 3.
However, the mere appearance of the mode in the spectrum does not yet clarify the origin of the symmetry reduction . In principle, it is possible that because of a geometric distortion of the molecule is tilted out of the surface plane and acquires a perpendicular contribution. But in this case would necessarily remain real, and we would observe a conventional, symmetric line shape for F3. This is evidently not the case. Its Fano line shape shows that of F3 is complex. Hence, there must be a phase-shifted electronic contribution to its overall dynamical dipole moment .
We have already mentioned above that for PtPc/Ag(111) the LUMO is the most likely partner in IDCT, because it becomes filled upon adsorption and straddles the Fermi energy. Moreover, a comparison of the elongation pattern of F3, which predominantly involves the stretching of the C-N bonds in the porphyrazine macrocycle (Fig. 2(c)), with the lobular structure of the LUMO (Fig. 2(b)) shows that the ionic motion of F3 should indeed couple well to the LUMO. Comparing Figs. 2(b) and (c) moreover shows that exciting F3 with positive amplitude has the same effect on the -LUMO as exciting F3 with negative amplitude has on the -LUMO. Hence, if and were still degenerate, dynamic filling and depletion of the two would be 180∘ out of phase (assuming that the phase lag relative to the ionic movement is the same for both LUMOs, which is expected to be a good approximation, in spite of the observed symmetry breaking, see below). In other words, in one half of the vibrational oscillation cycle the -LUMO would be filled, while the -LUMO would be depleted, and vice versa in the other half. Overall, no would prevail (small differences between the IDCT in the - and -LUMOs notwithstanding).
However, in the experimental spectrum a substantial is observed, as argued above. This can mean two things. Either the two LUMOs are still degenerate and their dynamic couplings to the F3 vibration are different, or the LUMO levels and are indeed split. We consider it unlikely that the static level positions of the LUMOs are not affected by symmetry breaking, while their dynamic couplings to F3 are. Therefore, we conclude that the - and -LUMO levels must be split, i.e. the degeneracy of the PtPc LUMO is lost upon adsorption on Ag(111). One may speculate that this LUMO splitting proceeds via a geometric distortion that is induced by the environment (the Ag(111) surface), enhanced by a Jahn-Teller-like internal stabilization of this external geometric distortion via the splitting of the electronic LUMO stateJahn and Teller (1937); Köpper et al. (2009); Uhlmann et al. (2013).
IV Palladium-phthalocyanine on Ag(111)
PdPc molecules adsorbed on Ag(111) show similar long range order as PtPc/Ag(111). A two-dimensional gas phase is found after annealing the thick layer up to K and an ordered phase is detected in LEED for lower annealing temperatures, that is at higher coverages.
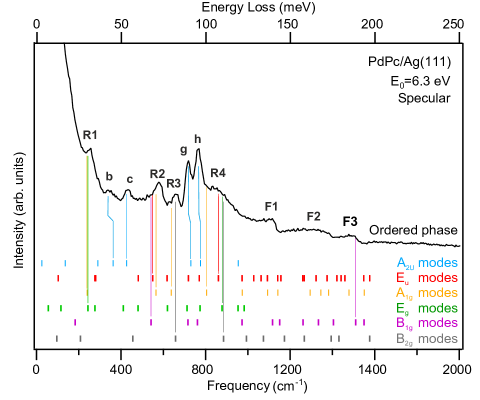
In Fig. 4 the specular HREELS spectrum of the PdPc ordered monolayer phase is shown together with the simulated results for the isolated molecule. The assignment of the experimental vibrational frequencies can be found in the supplement SM . As in the case of PtPc, the in-plane modes are absent and only the dipole scattering allowed out-of-plane modes of the isolated molecule are present. This indicates an essentially flat adsorption geometry. The c, g and h modes are shifted to lower frequencies by approximately 45, 15 and with respect to theory, respectively. The larger shift of the c mode for PdPc () than for PtPc () suggests a stronger interaction of PdPc with the Ag(111) substrate.
The presence of R modes in Fig. 4 suggests that a reduction of the molecular symmetry upon adsorption. In addition to the R1, R2 and R3 peaks that are also observed for PtPc/Ag(111), the PdPc spectrum shows a peak at , labeled R4. Possible assignments of R1, R2, R3 and R4 are listed in Tab. 4.
| Mode | Symmetry |
|---|---|
| R1 | / |
| R2 | // |
| R3 | / |
| R4 | /// |
| F1 | // |
| F2 | /// |
| F3 |
There is the possibility to assign the R1, R2, R3 and R4 peaks to modes with a representation (since R4 is very broad, it is rather difficult to assign it and a designation as a mode cannot be excluded); they would then be detectable in HREELS in specular geometry irrespective of the symmetry group of the molecule-substrate complex ( or ), cf. Tab. 2.
Three asymmetric peaks (F1, F2 and F3) are observed between 1000 and , which indicates that several vibrational modes are involved in an IDCT. Using Eq. 1, we single out vibrational frequencies given by DFT calculations for isolated PdPc () that yield the best fit of the experimental data as explain in Sec. III.3.3. As in the case of PtPc, several modes yield a reasonable fit for F1 and F2, while F3 can be fitted only with , a mode which belongs to the representation of the symmetry group (see Fig. 5), and a mode can only be detected in HREELS in the specular direction if the molecular symmetry is reduced to (see Tab. 2). As in the case of PtPc, this demonstrates that a preferential charge transfer occurs into one of the two LUMOs. Thus, the Ag(111) substrate lifts the degeneracy of the LUMO also in the case of PdPc.
V Summary and conclusion
In conclusion, the vibrational properties of Pt- and Pd-phthalocyanine molecules on the Ag(111) surface show that both molecules adsorb with their molecular plane parallel to the surface in the ordered monolayer phase. The red shift of some of the out-of-plane modes reflects a moderate interaction between the meso-tetraazaporphin (porphyrazin) macrocycle of the molecule and the Ag substrate. The presence of Raman vibrational modes proves the lowering of the molecular symmetry from the group of the isolated molecule upon adsorption on Ag(111). The asymmetrical line shape of some of the molecular vibrational modes further demonstrates that the charge transfer to the molecule is involved in the symmetry reduction to . Therefore, this study shows that HREELS is a valuable tool to determine the origin of the molecular degeneracy lifting upon adsorption on a metal surface.
VI Acknowledgment
F. C. Bocquet acknowledges financial support from the Initiative and Networking Fund of the Helmholtz Association, Postdoc Programme VH-PD-025. J. Sforzini thanks Prof. Dr. P. Jakob and Dr. P. Amsalem for fruitful discussions.
References
- Friend et al. (1999) R. H. Friend, R. W. Gymer, A. B. Holmes, J. H. Burroughes, R. N. Marks, C. Taliani, D. D. C. Bradley, D. A. Dos Santos, J. L. Bredas, M. Logdlund, and W. R. Salaneck, “Electroluminescence in conjugated polymers,” Nature 397, 121 (1999).
- Blom et al. (2007) P. W. M. Blom, V. D. Mihailetchi, L. J. A. Koster, and D. E. Markov, “Device Physics of Polymer : Fullerene Bulk Heterojunction Solar Cells,” Adv. Mater. 19, 1551 (2007).
- Sanvito (2011) S. Sanvito, “Molecular spintronics,” Chem. Soc. Rev. 40, 3336 (2011).
- Gottfried (2015) J. M. Gottfried, “Surface chemistry of porphyrins and phthalocyanines,” Surf. Sci. Rep. 70, 259 (2015).
- Blochwitz et al. (1998) J. Blochwitz, M. Pfeiffer, T. Fritz, and K. Leo, “Low voltage organic light emitting diodes featuring doped phthalocyanine as hole transport material,” Appl. Phys. Lett. 73, 729 (1998).
- Crone et al. (2000) B. Crone, A. Dodabalapur, Y. Y. Lin, R. W. Filas, Z. Bao, A. La Duca, R. Sarpeshkar, H. E. Katz, and W. Li, “Large-scale complementary integrated circuits based on organic transistors,” Nature 403, 521 (2000).
- Horowitz (1998) G. Horowitz, “Organic Field-Effect Transistors,” Adv. Mater. 10, 365 (1998).
- Conboy et al. (1998) J. C. Conboy, E. J. C. Olson, D. M. Adams, J. Kerimo, A. Zaban, B. A. Gregg, and P. F. Barbara, “Impact of Solvent Vapor Annealing on the Morphology and Photophysics of Molecular Semiconductor Thin Films,” J. Phys. Chem. B 102, 4516 (1998).
- Wang et al. (2009a) Y. Wang, J. Kröger, R. Berndt, and W. Hofer, “Structural and Electronic Properties of Ultrathin Tin-Phthalocyanine Films on Ag(111) at the Single-Molecule Level,” Angew. Chem. Int. Ed. 48, 1261 (2009a).
- Chang et al. (2008) S.-H. Chang, S. Kuck, J. Brede, L. Lichtenstein, G. Hoffmann, and R. Wiesendanger, “Symmetry reduction of metal phthalocyanines on metals,” Phys. Rev. B 78, 233409 (2008).
- Karacuban et al. (2009) H. Karacuban, M. Lange, J. Schaffert, O Weingart, T. Wagner, and R. Möller, “Substrate-induced symmetry reduction of CuPc on Cu(111): An LT-STM study ,” Surf. Sci. 603, L39 (2009).
- Wang et al. (2009b) Y. Wang, X. Ge, C. Manzano, J. Kröger, R. Berndt, W. A. Hofer, H. Tang, and J. Cerda, “Supramolecular Patterns Controlled by Electron Interference and Direct Intermolecular Interactions,” J. Am. Chem. Soc. 131, 10400 (2009b).
- Cuadrado et al. (2010) R. Cuadrado, J. I. Cerdá, Y. Wang, G. Xin, R. Berndt, and H. Tang, “CoPc adsorption on Cu(111): Origin of the C4 to C2 symmetry reduction,” J. Chem. Phys. 133, 154701 (2010).
- Snezhkova et al. (2015) O. Snezhkova, J. Lüder, A. Wiengarten, S. R. Burema, F. Bischoff, Y. He, J. Rusz, J. Knudsen, M.-L. Bocquet, K. Seufert, J. V. Barth, W. Auwärter, B. Brena, and J. Schnadt, “Nature of the bias-dependent symmetry reduction of iron phthalocyanine on Cu(111),” Phys. Rev. B 92, 075428 (2015).
- Phelan and Orchin (1968) N. F. Phelan and J. Orchin, “Cross conjugation,” J. Chem. Educ. 45, 633 (1968).
- Uhlmann et al. (2013) C. Uhlmann, I. Swart, and J. Repp, “Controlling the Orbital Sequence in Individual Cu-Phthalocyanine Molecules,” Nano Lett. 13, 777 (2013).
- Feyer et al. (2014) V. Feyer, M. Graus, P. Nigge, M. Wießner, R.G. Acres, C. Wiemann, C.M. Schneider, A. Schöll, and F. Reinert, “Adsorption geometry and electronic structure of iron phthalocyanine on Ag surfaces: A LEED and photoelectron momentum mapping study,” Surf. Sci. 621, 64 (2014).
- Niu et al. (2013) T. Niu, M. Zhou, J. Zhang, Y. Feng, and W. Chen, “Dipole Orientation Dependent Symmetry Reduction of Chloroaluminum Phthalocyanine on Cu(111),” J. Phys. Chem. C 117, 1013 (2013).
- Jahn and Teller (1937) H. A. Jahn and E. Teller, “Stability of Polyatomic Molecules in Degenerate Electronic States. I. Orbital Degeneracy,” Proc. Roy. Soc. A 161, 220 (1937).
- Köpper et al. (2009) H. Köpper, D. R. Yarkony, , and H. Berentzen, The Jahn-Taller Effect (Springer-Verlag Berlin Heidelberg, 2009).
- Borghetti et al. (2014) P. Borghetti, A. El-Sayed, E. Goiri, C. Rogero, J. Lobo-Checa, L. Floreano, J. E. Ortega, and D. G. de Oteyza, “Spectroscopic Fingerprints of Work-Function-Controlled Phthalocyanine Charging on Metal Surfaces,” ACS Nano 8, 12786 (2014).
- Puschnig et al. (2009) P. Puschnig, S. Berkebile, A. J. Fleming, G. Koller, K. Emtsev, T. Seyller, J. D. Riley, C. Ambrosch-Draxl, F. P. Netzer, and M. G. Ramsey, “Reconstruction of Molecular Orbital Densities from Photoemission Data,” Science 326, 702 (2009).
- Puschnig et al. (2011) P. Puschnig, E.-M. Reinisch, T. Ules, G. Koller, S. Soubatch, M. Ostler, L. Romaner, F. S. Tautz, C. Ambrosch-Draxl, and M. G. Ramsey, “Orbital tomography: Deconvoluting photoemission spectra of organic molecules,” Phys. Rev. B 84, 235427 (2011).
- Schönauer et al. (2016) K. Schönauer, S. Weiss, V. Feyer, B. Lüftner, D. Stadtmüller, C. Kumpf, P. Puschnig, M. G. Ramsey, F. S. Tautz, and S. Soubatch, “Charge transfer and symmetry reduction at the CuPc/Ag(110) interface,” Submitted to Phys. Rev. B (2016).
- Ibach and Mills (1982) H. Ibach and D. L. Mills, Electron Energy Loss Spectroscopy and Surface Vibrations (Academic Press, New York, 1982).
- (26) M. J. Frisch, G. W. Trucks, H. B. Schlegel, G. E. Scuseria, M. A. Robb, J. R. Cheeseman, G. Scalmani, V. Barone, B. Mennucci, G. A. Petersson, H. Nakatsuji, M. Caricato, X. Li, H. P. Hratchian, A. F. Izmaylov, J. Bloino, G. Zheng, J. L. Sonnenberg, M. Hada, M. Ehara, K. Toyota, R. Fukuda, J. Hasegawa, M. Ishida, T. Nakajima, Y. Honda, O. Kitao, H. Nakai, T. Vreven, J. A. Jr. Montgomery, J. E. Peralta, F. Ogliaro, M. Bearpark, J. J. Heyd, E. Brothers, K. N. Kudin, V. N. Staroverov, R. Kobayashi, J. Normand, K. Raghavachari, A. Rendell, J. C. Burant, S. S. Iyengar, J. Tomasi, M. Cossi, N. Rega, J. M. Millam, M. Klene, J. E. Knox, J. B. Cross, V. Bakken, C. Adamo, J. Jaramillo, R. Gomperts, R. E. Stratmann, O. Yazyev, A. J. Austin, R. Cammi, C. Pomelli, J. W. Ochterski, R. L. Martin, K. Morokuma, V. G. Zakrzewski, G. A. Voth, P. Salvador, J. J. Dannenberg, S. Dapprich, A. D. Daniels, Ó. Farkas, J. B. Foresman, J. V. Ortiz, J. Cioslowski, and D. J. Fox, “Gaussian∼09 Revision D.01,” Gaussian Inc. Wallingford CT 2009.
- Liu et al. (2007) Z. Liu, X. Zhang, Y. Zhang, and J. Jiang, “Theoretical investigation of the molecular, electronic structures and vibrational spectra of a series of first transition metal phthalocyanines,” Spectrochim. Acta. 67A, 1232 (2007).
- Maslov (2006) V. G. Maslov, “Interpretation of the electronic spectra of phthalocyanines with transition metals from quantum-chemical calculations by the density functional method,” Opt. Spectrosc. 101, 853 (2006).
- (29) “See supplemental material,” .
- Kröger et al. (2010) I. Kröger, B. Stadtmüller, C. Stadler, J. Ziroff, M. Kochler, A. Stahl, F. Pollinger, T.-L. Lee, J. Zegenhagen, F. Reinert, and C. Kumpf, “Submonolayer growth of copper-phthalocyanine on Ag(111),” New J. Phys. 12, 083038 (2010).
- Stadtmüller et al. (2011) B. Stadtmüller, I. Kröger, F. Reinert, and C. Kumpf, “Submonolayer growth of CuPc on noble metal surfaces,” Phys. Rev. B 83, 085416 (2011).
- Stadler et al. (2009) C. Stadler, S. Hansen, I. Kröger, C. Kumpf, and E. Umbach, “Tuning intermolecular interaction in long-range-ordered submonolayer organic films,” Nat. Phys. 5, 153 (2009).
- Ohta et al. (2014) N. Ohta, R. Arafune, N. Tsukahara, N. Takagi, and M. Kawai, “Adsorbed states of iron(II) phthalocyanine on Ag(111) studied by high-resolution electron energy loss spectroscopy,” Surf. Interface Anal. 46, 1253 (2014).
- Baran and Larsson (2013) J. D. Baran and J. A. Larsson, “Theoretical Insights into Adsorption of Cobalt Phthalocyanine on Ag(111): A Combination of Chemical and van der Waals Bonding,” J. Phys. Chem. C 117, 23887 (2013).
- Chabal (1985) Y. J. Chabal, “Electronic Damping of Hydrogen Vibration on the W(100) Surface,” Phys. Rev. Lett. 55, 845 (1985).
- Kröger et al. (1997) J. Kröger, S. Lehwald, and H. Ibach, “EELS study of the clean and hydrogen-covered Mo(110) surface,” Phys. Rev. B 55, 10895 (1997).
- Tautz et al. (2002) F. S. Tautz, M. Eremtchenko, J. Schaefer, M. Sokolowski, V. Shklover, and E. Umbach, “Strong electron-phonon coupling at a metal/organic interface: PTCDA/Ag(111),” Phys. Rev. B 65, 125405 (2002).
- Amsalem et al. (2009) P. Amsalem, L. Giovanelli, J.-M. Themlin, and T. Angot, “Electronic and vibrational properties at the ZnPc/Ag(110) interface,” Phys. Rev. B 79, 235426 (2009).
- Dou et al. (2010) W. Dou, Y.g Tang, C. S. Lee, S. N. Bao, and S. T. Lee, “Investigation on the orderly growth of thick zinc phthalocyanine films on Ag(100) surface,” J. Chem. Phys. 133, 144704 (2010).
- Kröger (2010) I. Kröger, Adsorption of phthalocyanines on noble metal surfaces, Ph.D. thesis (2010).
- Braatz et al. (2012) C. R. Braatz, G. Öhl, and P. Jakob, “Vibrational properties of the compressed and the relaxed 1,4,5,8-naphthalene-tetracarboxylic dianhydride monolayer on Ag(111),” J. Chem. Phys. 136, 134706 (2012).
- Rosenow et al. (2016) P. Rosenow, P. Jakob, and R. Tonner, “Electron-Vibron Coupling at Metal-Organic Interfaces from Theory and Experiment,” J. Phys. Chem. Lett. 7, 1422 (2016).
- Langreth (1985) D. Langreth, “Energy Transfer at Surfaces: Asymmetric Line Shapes and the Electron-Hole-Pair Mechanism,” Phys. Rev. Lett. 54, 126 (1985).
- Crljen and Langreth (1987) Ž. Crljen and D.C. Langreth, “Asymmetric line shapes and the electron-hole pair mechanism for adsorbed molecules on surfaces,” Phys. Rev. B 35, 4224 (1987).
- Kröger (2006) J. Kröger, “Electron-phonon coupling at metal surfaces,” Rep. Prog. Phys. 69, 899 (2006).