On the applicability of density dependent effective interactions in cluster-forming systems
Abstract
We systematically studied the validity and transferability of effective, coarse-grained, pair potentials in ultrasoft colloidal systems. We focused on amphiphilic dendrimers, macromolecules which can aggregate into clusters of overlapping particles to minimize the contact area with the surrounding (implicit) solvent. Simulations were performed for both the monomeric and coarse-grained model in the liquid phase at densities ranging from infinite dilution up to values close to the freezing point. For every state point, each macromolecule was mapped onto a single interaction site and the effective pair potential was computed using a coarse-graining technique based on force-matching. We found excellent agreement between the spatial dendrimer distributions obtained from the coarse-grained and microscopically detailed simulations at low densities, where the macromolecules were distributed homogeneously in the system. However, the agreement deteriorated significantly when the density was increased further and the cluster occupation became more polydisperse. Under these conditions, the effective pair potential of the coarse-grained model can no longer be computed by averaging over the whole system, but the local density needs to be taken into account instead.
I Introduction
Amphiphiles are chemical compounds consisting of both solvophilic and solvophobic blocks. When the solute concentration surpasses a certain threshold, these particles spontaneously self-assemble into micellar aggregates to minimize the interface between the solvophobic block and the surrounding solvent. The size and shape of the self-assembled superstructures depends mainly on the microscopic properties of the amphiphiles, allowing for, e.g. spherical, cylindrical and lamellar aggregates.Israelachvilli (1992) This peculiar ability makes amphiphilic molecules indispensable for a wide variety of applications,Kataoka, Harada, and Nagasaki (2001); Patist et al. (2002); Schramm, Stasiuk, and Marangoni (2003) for example as cleaning agents or emulsifiers in the cosmetic and food industry.
In this work we focus on the self-assembly behavior of amphiphilic dendrimers, which consist of a solvophobic core and a solvophilic shell. Recently, these macromolecules have gathered an increasing amount of attention, due to their propensity to form long-lived colloidal crystals, where each lattice site is populated by an aggregate.Mladek et al. (2006a); *mladek:prl:2006B; Mladek, Kahl, and Likos (2008); Moreno and Likos (2007); Zhang, Charbonneau, and Mladek (2010); Camargo, Moreno, and Likos (2010); Wilding and Sollich (2014); Lenz et al. (2011, 2012); Coslovich, Strauss, and Kahl (2011); Montes-Saralegui, Nikoubashman, and Kahl (2013, 2014) Simulation studies of these so-called cluster crystals have revealed a wide range of peculiar static and dynamic properties, which sets them apart from conventional single occupancy crystals. For example, the lattice constant of the cluster crystals is density-independent and therefore external pressure does not lead to a compression of the lattice, but rather to an increase of the occupation number.Montes-Saralegui, Nikoubashman, and Kahl (2014) The dynamics of this process are characterized by activated hopping of the constituent particles and merging of neighboring lattice sites.Moreno and Likos (2007); Camargo, Moreno, and Likos (2010); Coslovich, Strauss, and Kahl (2011); Montes-Saralegui, Nikoubashman, and Kahl (2013, 2014) Furthermore, reentrant melting and isostructural phase transitions have been reported for this class of amphiphiles.Zhang, Charbonneau, and Mladek (2010); Wilding and Sollich (2014)
Due to computational limitations, the majority of previous simulation studies relied on coarse-grained (CG) models, where the macromolecular amphiphiles were modeled as single interaction sites. The corresponding effective pair interactions were usually obtained in the limit of infinite dilution, and have then been employed to calculate system properties at considerably higher densities.Mladek, Kahl, and Likos (2008); Zhang, Charbonneau, and Mladek (2010) However, this strategy might lead to an inaccurate representation of the original microscopic model, since the transferability of the effective pair potentials from infinite dilution to finite densities is a priori not obvious.Louis (2002) For instance, it has been demonstrated for homopolymer systems that additional corrections are necessary to provide a faithful CG representation of the microscopically resolved (MR) systems at finite densities.Bolhuis et al. (2001)
To shed more light on this question, we performed a systematic analysis of amphiphilic dendrimers in the liquid phase at densities ranging from infinite dilution up to close to the freezing point. We computed the effective potentials at each state point using a force-matching CG algorithm.Izvekov and Voth (2005a, b); Noid et al. (2008); Izvekov, Chung, and Rice (2010) We then compared the emerging structures in the MR and CG simulations using the effective (pair) potentials obtained at infinite dilution, , and at the corresponding density, . We discovered that the CG simulations with failed at reproducing the MR structures even at the lowest investigated densities, and significantly underestimated the freezing density. The CG simulations with exhibited good agreement with the microscopic reference simulations at low densities, where the system predominantly consisted of isolated amphiphiles and small clusters. However, the agreement deteriorated rapidly as the density was increased further.
We did not expect such a significant deviation between the two representations, because the effective potentials employed in the CG simulations were calculated from MR simulations conducted at exactly the same density and temperature. This discrepancy can be rationalized by considering the spatial density variations in the system, which became more pronounced as the amphiphiles started to aggregate into clusters of heterogeneous size. These inhomogeneities make it impossible to represent all relevant interactions by a single effective pair potential. To validate our hypothesis, we systematically calculated the effective potential between aggregates of different sizes, and found a highly non-linear relationship between the effective interaction and the aggregation number.
The rest of this manuscript is organized as follows. In Section II.1 we introduce the investigated model systems and simulation method. The employed CG algorithm is presented in Section II.2. We discuss our findings in Section III, where we systematically compare our results from the microscopically resolved simulations with the coarse-grained ones. Finally, we summarize the findings and draw our conclusions in Section IV.
II Models and Methods
II.1 Systems and simulation method
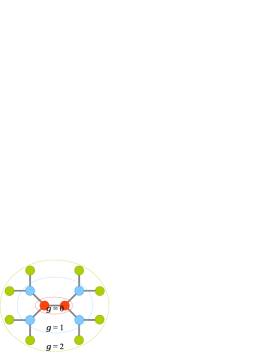
Dendrimers are characterized by a highly branched architecture, which is specified by the functionality, , the spacer length, , and the total number of generations, . Dendrimers are grown by attaching chains with monomers to two bonded central monomers (generation index ). This process was repeated times, resulting in a self-similar structure. Figure 1 shows a schematic representation of the resulting dendritic macromolecule.
All MR simulations were conducted using a bead-spring model, where the constituent monomers were represented by spherical beads with diameter that were tethered through massless springs. Three different cases were considered in this work: one non-clustering dendrimer model under good solvent conditions,Götze, Harreis, and Likos (2004) and two different amphiphilic dendrimer models,Mladek, Kahl, and Likos (2008); Lenz et al. (2012) denoted henceforward by I and II.
In all three cases the dendrimers are specified by , , and , consisting thus of monomers. Furthermore, the mass of the beads was set to unity, . Covalent bonds were mimicked via the finite extensible non-linear elastic (FENE) potential:Bishop, Kalos, and Frisch (1979); Welch and Muthukumar (1998)
| (1) |
with the reciprocal thermodynamic temperature of the system and interparticle distance . The spring constant was controlled through the parameter , whose magnitude depended on the identity of particles and . The minimum and maximum extension of the bond, and respectively, was set through the parameters:
For the non-clustering dendrimers at good solvent conditions, all the beads had the same identity. Excluded volume interactions were modeled using the purely repulsive Weeks-Chandler-Anderson (WCA) potential:Weeks, Chandler, and Andersen (1971)
| (2) |
where the interaction strength is quantified through .
In the case of the amphiphilic dendrimers, we distinguished between solvophobic core (C) and solovophilic shell (S) particles. Here, the bead-bead interactions were modeled via the Morse potential:
| (3) |
with . The parameters and controlled the strength and range of the interaction, respectively.
We used the interaction parameters from Ref. 23 for the non-clustering dendrimers at good solvent conditions and the interaction parameters from Ref. 7 (model I) and Ref. 13 (model II) for the amphiphilic dendrimers. The specific values are summarized in Table 1. If not stated otherwise explicitly, we used in all our MR simulations as our unit of length, and as our unit of mass. From these units the intrinsic time unit of the MD simulations can be derived as . Densities are defined as , where is the total number of dendrimers in the system and is the radius of gyration of the dendrimers [see Eq. (5)]. The overlap density of the polymer solution, , is defined as .
| Model | Type | Interaction | Type | Interaction | ||||||
|---|---|---|---|---|---|---|---|---|---|---|
| NC | WCA | 1 | 1 | FENE | 0.5 | 0 | 10 | |||
| CC | Morse | 0.714 | 1 | 6.4 | CC | FENE | 40 | 1.875 | 0.375 | |
| I | CS | Morse | 0.014 | 1.25 | 19.2 | CS | FENE | 20 | 3.75 | 0.75 |
| SS | Morse | 0.014 | 1.5 | 19.2 | ||||||
| CC | Morse | 0.714 | 1 | 1.8 | CC () | FENE | 60 | 3.1875 | 0.6375 | |
| II | CS | Morse | 0.01785 | 1.75 | 6.0 | CC () | FENE | 60 | 1.875 | 0.375 |
| SS | Morse | 0.01785 | 2.5 | 6.0 | CS | FENE | 30 | 3.5625 | 0.7125 |
Molecular dynamics simulations were conducted in the ensemble using the LAMMPS simulation package.Plimpton (1995) The velocity Verlet algorithmSwope et al. (1982); Allen and Tildesley (1989); Frenkel and Smit (2001) was employed for integrating the equations of motion, with a timestep of for the MR simulations and for the CG simulations. In the CG simulations we set the mass of the effective particles to unity, which introduced a factor of between the time units in the MR and the CG picture.
The temperature was fixed to through a Nosé-Hoover thermostat.Nosé (1984a, b); Hoover (1985, 1986) The central idea of this scheme is to couple the system to an (implicit) external heat reservoir through a fictitious spring, allowing for heating as well as for dissipation of excess heat. Here, the coupling strength can be tuned via the damping time of the spring, . On the one hand, too large values of (loose coupling) may cause poor temperature control, whereas on the other hand, too small values (tight coupling) may cause high-frequency temperature oscillation. We found that led to quick equilibration as well as good stability, and therefore used this value in all our simulations.
The initial configurations for the MR simulations were generated by growing each of the dendrimers along a self-avoiding random walk in a cubic simulation box. The systems were initialized in a highly diluted state, where the individual dendrimers were essentially isolated from each other. From these states, the final starting configurations were created by slowly compressing the simulation box until the desired density was reached. Once the starting configurations were produced, the systems were equilibrated until the potential energy did not change anymore.
II.2 Coarse-graining method
In many situations, microscopically resolved simulations are computationally unfeasible due to the vast number of interaction sites. Such microscopic simulations are further impeded by the relatively small timesteps, which are required for capturing the dynamics of the particles. Fortunately, the microscopic details of the individual macromolecules are often only of minor interest and can therefore be suitably traced out for the sake of computational efficiency. The acceleration achieved through such a coarse-graining is twofold: first, the number of interaction sites is reduced dramatically through this procedure, which facilitates the force calculation and the integration of the equations of motion. Second, CG models exhibit inherently faster dynamics compared to their MR counterparts, since the fast internal degrees of freedom have been integrated out.Karimi-Varzaneh et al. (2012)
Various techniques have been developed to map the complex interactions of the MR system onto effective pair potentials, for example iterative Boltzmann inversion,Almarza and Lomba (2003); Reith, Pütz, and Müller-Plathe (2003) force matching,Izvekov and Voth (2005a, b); Noid et al. (2008); Izvekov, Chung, and Rice (2010) or physically informed ad-hoc models.Pike et al. (2009); Müller et al. (2014) The mapping from the MR to the CG picture is in general not unique but depends on which of the physical quantities from the original MR system should be conserved.Louis (2002) In this work, we employed the so-called multi-scale coarse graining (MSCG) method developed by Voth and co-workers.Izvekov and Voth (2005a, b); Noid et al. (2008); Izvekov, Chung, and Rice (2010)
In what follows, we provide a short description of the employed CG approach. We distinguish between quantities in the MR and CG pictures by denoting the corresponding properties with lower- and upper-case symbols, respectively. Each dendrimer was mapped to a single interaction site, which was located at the center-of-mass (CM) of the original macromolecule:
| (4) |
where denotes the position of monomer of the -th dendrimer (omitting in the following the index for clarity). The size of the coarse-grained particle was defined through the dendrimer’s radius of gyration:
| (5) |
We assumed that the effective interaction between the CG particles depended only on the interparticle distance and that all interactions were pairwise additive. Furthermore, we introduced a cutoff radius, , beyond which CG particles did not interact with each other. In the MSCG framework, the force acting on the effective particle , , is given by:
| (6) |
Here, represents the entire set of the (with ), is the distance between particles and , and denotes the unit vector pointing along .
The function in Eq. (6) is non-zero in the range and needs to be determined from the MR simulations. For the explicit evaluation of , we divided the interval into equally spaced sub-intervals and performed a piecewise decomposition of into a sum over basis-functions, :
| (7) |
where the are linear splines with yet unknown coefficients . The functional form of a spline in the interval is given by:
| (8) |
The actual values of and are system-specific and will be reported in the corresponding subsections where the respective results are presented and discussed.
The effective potentials were then calculated by determining the coefficients in Eq. (7). Substituting and by and led to a set of linear equations of the parameters, which were solved using the least-squares (LSQR) algorithm.Paige and Saunders (1982a, b) To improve sampling, the parameters were computed and averaged from statistically independent configurations. In practice, snapshots were taken every 500 to 5000 timesteps, and we carefully checked that the solutions converged by continuously increasing until the results did not change anymore. We found that 10000 - 25000 configurations were in general sufficient to meet these requirements.
III Results
III.1 Dendrimers in a good solvent
In order to test our implementation of the MSCG algorithm, we first studied a system of dendrimers in a good solvent. Under these conditions, the macromolecules should not exhibit any clustering, but should be distributed homogeneously in the system. In Ref. 23, Götze et al. calculated the effective potential of dendrimers (, , and ) in a good solvent at . In the limiting case of infinite dilution, i.e. for , an effective potential with a Gaussian shape was obtained. The transferability of this model was tested by conducting additional MR simulations for densities up to the overlap density and comparing the resulting pair correlation functions with the ones obtained from CG simulations using .Götze and Likos (2005) Excellent agreement was observed for the entire density range with only slightly higher ordering observed in the MR simulations. This discrepancy was attributed to the deformation of the individual dendrimers in the MR simulations, which was not included in the employed CG model.
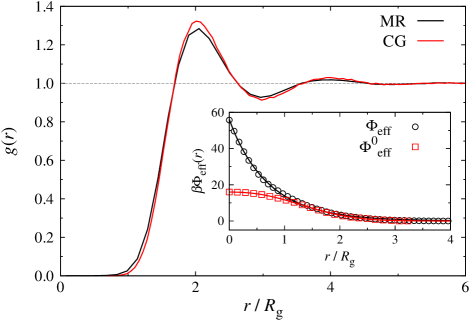
In this contribution, we extended the density range to using dendrimers. We measured a radius of gyration of for these macromolecules, and computed the effective pair interaction using a set of basis functions and a cutoff radius . The main panel of Figure 2 shows a comparison of the CM , computed both in the MR and CG simulations. A remarkable agreement between the data is evident, confirming that CG simulations can be used even at densities significantly larger than .
The inset of Figure 2 shows the corresponding effective potential and it is well visible that it changed significantly compared to its form at infinite dilution, ; as was increased beyond , the effective pair potential became significantly steeper at the origin. This effect can be attributed to the steric interactions between the monomers, which impeded the overlap of nearby dendrimers at high densities.
To obtain a functional form for , we fitted the computed potential via the generalized exponential model of index (GEM-):Mladek et al. (2006a); *mladek:prl:2006B
| (9) |
where parameterizes the strength of the potential, is the diameter of the effective particle, and controls the steepness of the shoulder. For , decays exponentially, while this function becomes a Gaussian for . In the limit of , becomes a square shoulder potential. It has been demonstrated in Ref. 43, that particles interacting via a potential exhibit clustering if .
We obtained an exponent of for the simulations conducted at , whereas was found for the situation at infinite dilution. Both values are below the theoretically estimated threshold for clustering, which is in agreement with the expected behavior for these macromolecules dispersed in a good solvent.
III.2 Amphiphilic dendrimers - Model I
In order to study the density dependence of the effective potentials in clustering systems, we first simulated the amphiphilic dendrimers systems investigated in Ref. 7. These dendrimers had a functionality of , a spacer length of , and were terminated in their growth after generations (see Figure 1). Mladek et al. calculated the zero-density effective potential for these amphiphiles,Mladek, Kahl, and Likos (2008) and demonstrated that it fulfills the clustering criterion derived in Ref. 43. Lenz et al. attempted to verify the validity of the CG picture at finite densities by performing MR simulations in the fluid state.Lenz et al. (2011) They found qualitative agreement between the pair correlation functions in the MR and CG simulations (using the zero-density effective potential) at low and intermediate densities.
In order to provide a more quantitative analysis, we systematically computed the effective potentials at five finite densities, i.e. , , , , and . This density range covers the state points investigated in Ref. 12. We simulated an ensemble of dendrimers for all densities ( for ) to ensure proper sampling of the measured system properties.
The main panel of Figure 3 shows all , which were computed using the MSCG algorithm with a basis of dimension and a cutoff radius . The effective potential between two isolated amphiphiles () has a local minimum at , which corresponds to a configuration where the solvophobic cores of the two dendrimers overlap. The effective potential had its maximum at , i.e. when the solvophilic shell of a dendrimer penetrates the solvophobic core of another one, and vice versa.
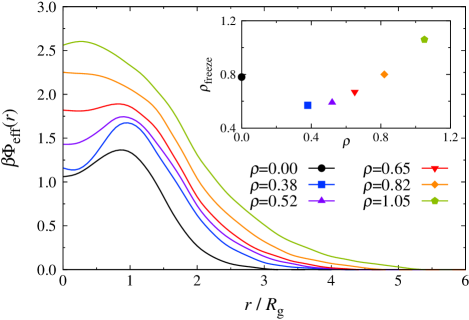
Our analysis revealed a strong density dependence of : the long-ranged repulsion of the potential increased monotonically with , while the short-ranged attraction, characterized by , gradually disappeared. However, we found an intermediate density range , where increased, indicating an enhanced affinity to form clusters.
The state point at which the system freezes into a cluster crystal can be estimated accurately by minimizing the free energy of the crystal with respect to the cluster occupation number and lattice spacing.Mladek et al. (2006a); *mladek:prl:2006B; Likos et al. (2007) Following the arguments brought forward in Ref. 44, the freezing density, , can be calculated directly from the effective potential through:
| (10) |
where is the freezing temperature, is the Fourier transformation of , and is the position of the minimum of . One peculiar property of Eq. (10) is the constant ratio between and , which leads to a straight freezing line in the phase diagram.Likos et al. (2007)
We computed for each at a fixed freezing temperature , and plotted the data in the inset of Figure 3. Here, we can see that changed significantly as was increased: for , decreased with respect to the freezing density in the zero-density limit, . In fact, attained its minimum at , the same density where is maximized. These data suggest that, initially, clustering was enhanced by the presence of additional amphiphiles. At low densities, it was beneficial to place dendrimers on top of each other, since this strategy decreased the contact area of the solvophobic cores with the surrounding solvent. However, as the density was increased further, excluded volume effects made it increasingly difficult to place additional dendrimers into a cluster. This interpretation is supported by the slight swelling of the dendrimers, quantified via the increase of from to (measurement uncertainty ) as the density was increased.
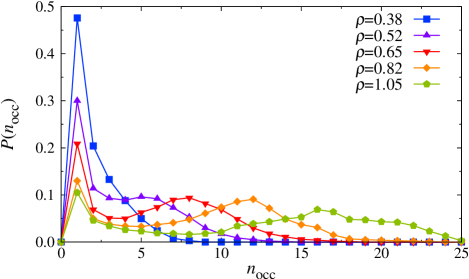
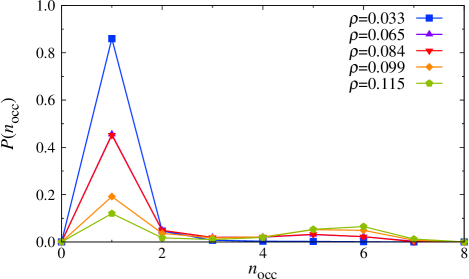
Figure 4 shows the cluster size distribution in the MR simulations, obtained by applying a simple distance-based cluster analysis algorithm, where dendrimers with a CM separation of less than were assigned to the same cluster. For , approximately half of all dendrimers were isolated and decreased monotonically with . For , the number of isolated dendrimers decreased to and we found a local maximum of at , indicating the onset of clustering. As was increased further, kept decreasing while the local maximum of shifted towards higher values of .
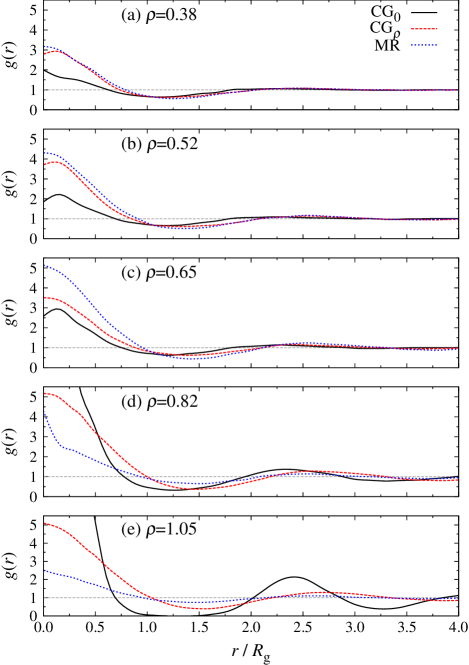
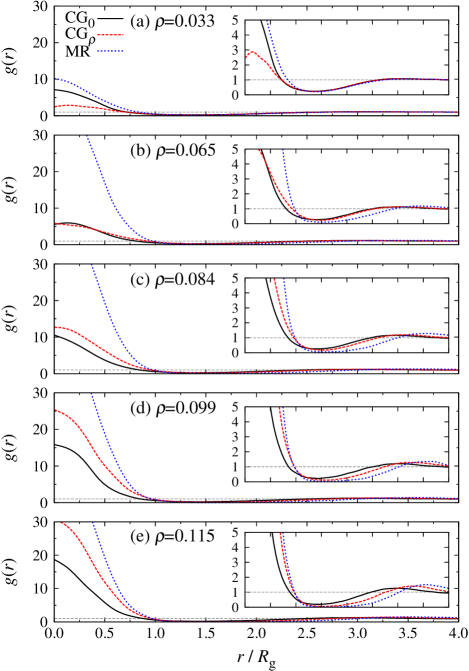
We then compared the resulting radial distribution functions of the MR simulations with the ones from the CG simulations using and . It is evident from Figure 5 that the CG simulations using failed completely in reproducing the structures observed in the MR simulations even at the lowest investigated density (). In contrast, the agreement between the MR simulations and the CG calculations with was significantly better up to , but then worsened rapidly as the density was further increased.
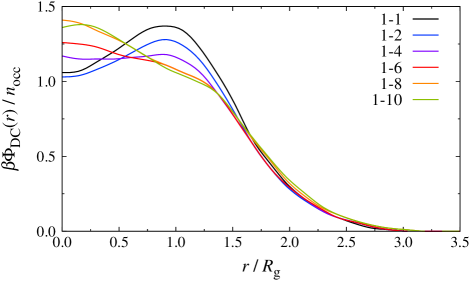
In order to better understand the origin of this startling discrepancy, we computed the effective interaction between a single amphiphile and a cluster of these macromolecules for various occupation numbers . Figure 6 shows , i.e. the effective dendrimer-cluster potential normalized by the occupation number. These data show that became increasingly repulsive with increasing , a trend which stemmed from crowding effects in the cluster center. However, for sufficiently small , was almost linearly additive with respect to .
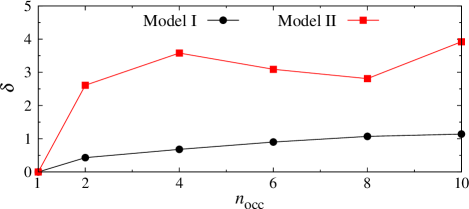
We quantified the additivity of the potentials via:
| (11) |
Figure 7 shows as a function of , and it is clearly visible that increased with . Hence, the description using worsened with increasing , resulting in erroneous structures in the CG description.
In order to understand the failure of , it is insightful to consider the cluster distribution shown in Figure 4. It becomes immediately clear that the interactions in the system cannot be described through a single effective pair potential : at high densities, was rather broad, resulting in a large number of different dendrimer-cluster and cluster-cluster interactions. By mapping all these effective potentials onto a single , we only preserve but lose all information concerning the shape of . This argument is corroborated by the fact that the obtained from the MR and CG simulations agreed remarkably well for low density states , where the cluster distributions were rather narrow (cf. Figure 4).
III.3 Amphiphilic dendrimers - Model II
To induce clustering of the amphiphiles at lower densities, considerable effort was put into tuning the interaction parameters of model I.Lenz et al. (2012) In the revised model II, amphiphiles had a significantly more open core region, which was achieved by increasing the rest length of the central bonds. In addition, the range of the attraction between the core monomers was increased and thus acted well beyond the polymer’s radius of gyration ( for all investigated densities). These features successfully lowered the freezing density from (model I) to . At this point we would like to mention, that an erroneous value of was reported originally in Ref. 13 for the model II, due to a miscalculation of the corresponding effective potential .
We computed in the zero-density limit and at the reduced densities , , , , , where each system consisted of at least dendrimers. We employed a basis of dimension and a cutoff radius . The effective potentials are plotted in Figure 8 for all investigated values. Only a very weak density-dependence of the effective potentials is discernible in this density regime. The inset of Figure 8 shows the corresponding freezing densities , which were consistently lower than the value.
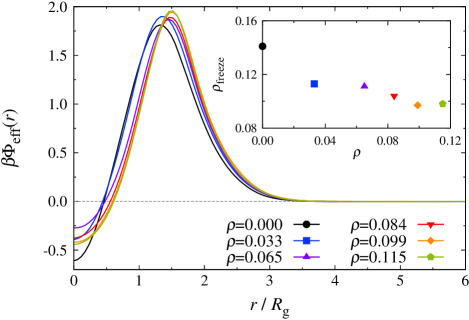
Figure 9 shows the cluster size distributions in the MR simulations, where we assigned dendrimers within a distance of to the same cluster. As was increased, the number of isolated amphiphiles decreased continuously and the dendrimers aggregated into clusters. At the same time, the local maximum at became more pronounced and shifted towards larger . The density at which clustering occurred was considerably lower compared to the model I case, resulting in lower occupation numbers (cf. Figure 4).
At a first glance, the data presented in Figure 8 and 9 seem to suggest that a CG description using should produce good agreement with the MR simulations, since there was only a weak density-dependence on and the system had a rather narrow cluster distribution. However, both and failed to replicate the structures of the MR simulations, as evidenced by the radial distribution functions plotted in Figure 10. In fact, the difference between the MR and CG simulations was significantly more pronounced compared to the model I case investigated in Section III.2 above.
To elucidate this surprising behavior, we computed for various occupation numbers , analogous to our previous study of amphiphiles of model I (see Figure 6). Figure 11 shows the resulting effective potentials and we can see that the local minimum at first decreased but then increased rapidly as was increased. At the same time, the local maximum monotonically decreased and moved to slightly higher values.
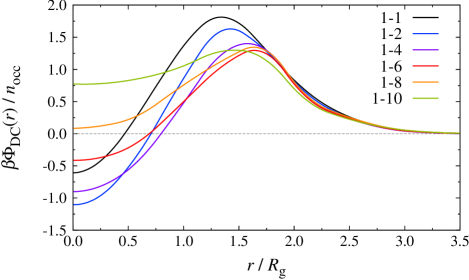
Figure 7 shows the deviation of [as defined by Eq. (11)] with respect to the effective dendrimer-dendrimer potential in the zero-density limit, . It is clearly visible that the deviations were significantly larger for the model II amphiphiles compared to the ones computed for model I, which explains the inferior agreement of the shown in Figure 10. In order to investigate a possible correlation between the conformation of the aggregated dendrimers and , we measured the radial density distribution of the solvophobic core and solvophilic shell monomers. For the model II amphipiles, we observed a peculiar backfolding of the monomers into the core region, while the monomers formed the corona. In contrast, for the model I amphiphiles we observed a layered structure with the monomers in the core, the solvophobic monomers in the intermediate region, and the monomers in the shell. In general, we observed that the core-shell structure became more pronounced as the cluster occupation number was increased. Furthermore, the conformation of the individual amphiphiles changed only marginally for the investigated values of , suggesting that the pronounced variation of predominantly originated from excluded volume effects, which impeded the stacking of dendrimers.
IV Conclusions
We have calculated effective pair potentials in ultrasoft colloidal systems at finite densities, and have systematically compared the emerging structural properties in the microscopically resolved and coarse-grained simulations based on effective pair potentials. For non-clustering systems, we observed almost perfect agreement between the two representations, even at densities well above the overlap density. However, a significant mismatch was observed for cluster-forming amphiphilic systems. This was surprising, since we employed effective pair potentials which were computed from the microscopically resolved simulations at exactly the same temperatures and densities.
The reason for this discrepancy is rooted in the heterogeneous density distributions of the clustering systems. By taking the average over the whole system during the coarse-graining procedure, all information on these cluster distributions is lost. Such an approach becomes problematic when the cluster sizes are not uniformly distributed, and the dendrimer-cluster and cluster-cluster interactions depend on the aggregation number of the partaking clusters.
Hence, improved coarse-graining strategies are necessary for accurately describing clustering systems. For instance, it is conceivable to use a set of effective pair potentials, which correctly take into account the occupancy of the involved clusters. However, such a modification makes coarse-grained simulations considerably more expensive from a computational view, since they require a complete cluster analysis at each time step. Therefore, further research is required to improve both accuracy and efficiency of such coarse-grained simulations.
Acknowledgements.
This work has been supported by the Marie Curie ITN-COMPLOIDS (Grant Agreement No. 234810), by the Austrian Science Fund (FWF) under Proj. Nos. P23910-N16 and F41 (SFB ViCoM), and by the WK “Computational Materials Science” of the Vienna University of Technology. Computing time on the Vienna Scientific Cluster (VSC) is gratefully acknowledged. A.N. acknowledges funding from the German Research Foundation (DFG) under the project number NI 1487/2-1.References
- Israelachvilli (1992) J. N. Israelachvilli, Intermolecular and Surface Forces, 2nd ed. (Academic Press, London, 1992).
- Kataoka, Harada, and Nagasaki (2001) K. Kataoka, A. Harada, and Y. Nagasaki, Adv. Drug Delivery Rev. 47, 113 (2001).
- Patist et al. (2002) A. Patist, J. R. Kanicky, P. K. Shukla, and D. O. Shah, J. Colloid Interface Sci. 245, 1 (2002).
- Schramm, Stasiuk, and Marangoni (2003) L. L. Schramm, E. N. Stasiuk, and D. G. Marangoni, Annu. Rep. Prog. Chem., Sect. C: Phys. Chem. 99, 3 (2003).
- Mladek et al. (2006a) B. M. Mladek, D. Gottwald, G. Kahl, M. Neumann, and C. N. Likos, Phys. Rev. Lett. 96, 045701 (2006a).
- Mladek et al. (2006b) B. M. Mladek, D. Gottwald, G. Kahl, M. Neumann, and C. N. Likos, Phys. Rev. Lett. 97, 019901 (2006b).
- Mladek, Kahl, and Likos (2008) B. M. Mladek, G. Kahl, and C. N. Likos, Phys. Rev. Lett. 100, 028301 (2008).
- Moreno and Likos (2007) A. J. Moreno and C. N. Likos, Phys. Rev. Lett. 99, 107801 (2007).
- Zhang, Charbonneau, and Mladek (2010) K. Zhang, P. Charbonneau, and B. M. Mladek, Phys. Rev. Lett. 105, 245701 (2010).
- Camargo, Moreno, and Likos (2010) M. Camargo, A. J. Moreno, and C. N. Likos, J. Stat. Mech. 10, P10015 (2010).
- Wilding and Sollich (2014) N. B. Wilding and P. Sollich, J. Chem. Phys. 141, 094903 (2014).
- Lenz et al. (2011) D. A. Lenz, B. M. Mladek, C. N. Likos, G. Kahl, and R. Blaak, J. Phys. Chem. B 115, 7218 (2011).
- Lenz et al. (2012) D. A. Lenz, R. Blaak, C. N. Likos, and B. M. Mladek, Phys. Rev. Lett. 109, 228301 (2012).
- Coslovich, Strauss, and Kahl (2011) D. Coslovich, L. Strauss, and G. Kahl, Soft Matter 7, 2127 (2011).
- Montes-Saralegui, Nikoubashman, and Kahl (2013) M. Montes-Saralegui, A. Nikoubashman, and G. Kahl, J. Phys.: Condens. Matter 25, 195101 (2013).
- Montes-Saralegui, Nikoubashman, and Kahl (2014) M. Montes-Saralegui, A. Nikoubashman, and G. Kahl, J. Chem. Phys. 141, 124908 (2014).
- Louis (2002) A. A. Louis, J. Phys.: Condens. Matter 14, 9187 (2002).
- Bolhuis et al. (2001) P. G. Bolhuis, A. A. Louis, J. P. Hansen, and E. J. Meijer, J. Chem. Phys. 114, 4296 (2001).
- Izvekov and Voth (2005a) S. Izvekov and G. A. Voth, J. Phys. Chem. B 109 (2005a).
- Izvekov and Voth (2005b) S. Izvekov and G. A. Voth, J. Chem. Phys. 123, 134105 (2005b).
- Noid et al. (2008) W. Noid, J.-W. Chu, G. Ayton, V. Krishna, S. Izvekov, G. A. Voth, A. Das, and H. C. Andersen, J. Chem. Phys. 128, 244114 (2008).
- Izvekov, Chung, and Rice (2010) S. Izvekov, P. W. Chung, and B. M. Rice, J. Chem. Phys. 133, 064109 (2010).
- Götze, Harreis, and Likos (2004) I. O. Götze, H. M. Harreis, and C. N. Likos, J. Chem. Phys. 120, 7761 (2004).
- Bishop, Kalos, and Frisch (1979) M. Bishop, M. H. Kalos, and H. L. Frisch, J, Chem. Phys. 70, 1299 (1979).
- Welch and Muthukumar (1998) P. Welch and M. Muthukumar, Macromolecules 31, 5892 (1998).
- Weeks, Chandler, and Andersen (1971) J. D. Weeks, D. Chandler, and H. C. Andersen, J. Chem. Phys. 54, 5237 (1971).
- Plimpton (1995) S. Plimpton, J. Comp. Phys. 117, 1 (1995).
- Swope et al. (1982) W. C. Swope, H. C. Andersen, P. H. Berens, and K. R. Wilson, J. Chem. Phys. 76, 637 (1982).
- Allen and Tildesley (1989) M. P. Allen and D. J. Tildesley, Computer Simulation of Liquids (Oxford University Press, USA, 1989).
- Frenkel and Smit (2001) D. Frenkel and B. Smit, Understanding Molecular Simulation: From Algorithms to Applications (Academic Press, 2001).
- Nosé (1984a) S. Nosé, J. Chem. Phys. 81, 511 (1984a).
- Nosé (1984b) S. Nosé, Mol. Phys. 52, 255 (1984b).
- Hoover (1985) W. G. Hoover, Phys. Rev. A 31, 1695 (1985).
- Hoover (1986) W. G. Hoover, Phys. Rev. A 34, 2499 (1986).
- Karimi-Varzaneh et al. (2012) H. A. Karimi-Varzaneh, N. F. A. van der Vegt, F. Müller-Plathe, and P. Carbone, ChemPhysChem 13, 3428 (2012).
- Almarza and Lomba (2003) N. G. Almarza and E. Lomba, Phys. Rev. E 68, 011202 (2003).
- Reith, Pütz, and Müller-Plathe (2003) D. Reith, M. Pütz, and F. Müller-Plathe, J. Comput. Chem. 24, 1624 (2003).
- Pike et al. (2009) D. Q. Pike, F. A. Detcheverry, M. Müller, and J. J. de Pablo, J. Chem. Phys. 131, 084903 (2009).
- Müller et al. (2014) K. Müller, N. Osterman, D. Babic, C. N. Likos, J. Dobnikar, and A. Nikoubashman, Langmuir 30, 5088 (2014).
- Paige and Saunders (1982a) C. C. Paige and M. A. Saunders, ACM Transactions on Mathematical Software 8, 1 (1982a).
- Paige and Saunders (1982b) C. C. Paige and M. A. Saunders, ACM Transactions on Mathematical Software 8, 2 (1982b).
- Götze and Likos (2005) I. O. Götze and C. N. Likos, J. Phys.: Condens. Matter 17, S1777 (2005).
- Likos et al. (2001) C. N. Likos, A. Lang, M. Watzlawek, and H. Löwen, Phys. Rev. E 63, 031206 (2001).
- Likos et al. (2007) C. N. Likos, B. M. Mladek, D. Gottwald, and G. Kahl, J. Chem. Phys. 126, 224502 (2007).